Tumor Suppressor DLEC1 can Stimulate the Proliferation of Cancer Cells When AP-2ɑ2 is Down-Regulated in HCT116

authors:

avatar Guo-Hua Qiu 1 , 2 , * , avatar Xiaojin Xie 2 , avatar Linhong Deng 1 , avatar Shing Chuan Hooi 2 , *

Institute of Biomedical Engineering and Health Sciences, Changzhou University, Changzhou, PR China
Department of Physiology, Faculty of Medicine, National University of Singapore, Singapore, Republic of Singapore
Corresponding Authors:

how to cite: Qiu G, Xie X, Deng L, Hooi S C. Tumor Suppressor DLEC1 can Stimulate the Proliferation of Cancer Cells When AP-2ɑ2 is Down-Regulated in HCT116. Hepat Mon. 2015;15(11):e29829. https://doi.org/10.5812/hepatmon.29829.

Abstract

Background:

The molecular mechanisms of tumor suppressor gene DLEC1 are largely unknown.

Objectives:

In this study, we established DLEC1 over-expression stable clones to study the cellular function of DLEC1 in the colorectal cancer cell line, HCT116.

Materials and Methods:

Stable clones with DLEC1 over-expression were first established by the transfection of DLEC1 expression construct pcDNA31DLEC1 in HCT116. On G418 selection, positive stable clones were screened for DLEC1 expression level by conventional reverse transcription-polymerase chain reaction (RT-PCR), and verified by real-time RT-PCR and Western blotting. Subsequently, these stable clones were subjected to colony formation and cell cycle analyses and identification of factors involved in G1 arrest. Lastly, three stable clones, DLEC1-7 (highest DLEC1 expression), DLEC1-3 (lowest expression) and pcDNA31 vector control, were employed to analyze cell proliferation and cell cycle after AP-2α2 knockdown by siRNAs.

Results:

The DLEC1 over-expression was found to reduce the number of colonies in colony formation and to induce G1 arrest in seven clones, and apoptosis in one clone in the cell cycle analysis. Furthermore, regardless of the different cell cycle defects in all eight stable clones, the expression level of transcriptional factor AP-2α2 was found to be elevated. More interestingly, we found that when AP-2α2 was knocked down, DLEC1 over-expression neither suppressed cancer cell growth nor induced G1 arrest, yet, instead promoted cell growth and decreased cells in the G1 fraction. This promotion of cell proliferation and release of G1 cells also seemed to be proportional to DLEC1 expression levels in DLEC1 stable clones.

Conclusions:

DLEC1 suppresses tumor cell growth the presence of AP-2α2 and stimulates cell proliferation in the down-regulation of AP-2α2 in DLEC1 over-expression stable clones of HTC116.

1. Background

Tumor suppressor gene DLEC1 (deleted in lung and esophageal cancer 1) is located within 3p22-p21.3 and encodes a cytoplasmic protein of 1755 amino acids with approximately 166 kDa of size, and without any significant homology to known proteins or conserved domains (1). It is robustly expressed in normal tissues yet down-regulated or silenced by DNA hypermethylation in tumor tissues of most organs, including ovary (2), lung (3), colon and stomach (4), breast (5), liver (6), kidney (7), nasopharynx (8), head and neck (9), and non-Hodgkin and Hodgkin lymphomas (10). Moreover, over-expression of DLEC1 in cancer cell lines, such as HepG2 cells markedly suppresses colony formation, cell growth and cell cycle arrest at the G1 phase, and impairs the invasiveness and tumorigenesis of cancer cells in nude mice (2, 6). However, the functional role of DLEC1 in cell growth and cell cycle arrest at the G1 phase remains unclear.

G1 arrest in cell cycle is known to be strictly regulated by a series of transcriptional factors. One of these transcriptional factors is AP-2α of AP-2 (activator protein 2) family. Other members of this family include AP-2 β, AP-2γ, AP-2δ, and AP-2ε. They are all localized predominantly in the nucleus and are structurally similar, each containing a less conserved proline and glutamine-rich activation domain at N-terminal, a DNA-binding domain, and a unique highly conserved helix-span-helix dimerization domain at C-terminal (11). Members of AP-2 family can directly activate their target genes by dimerization of the molecules for binding to GC-rich consensus sequences, most frequently the palindromic 5-GCCN3GGC-3 in regulatory DNA regions (11). They can also indirectly regulate their target genes through protein-protein interactions with other transcription factors such as c-CMY, pRB, and p53 (12). Through these direct and indirect regulations of target genes, AP-2 transcription factors are involved not only in multiple normal physiological activities, including embryogenesis, development, cellular proliferation and differentiation, but also in pathological processes, such as tumorigenesis (13).

Mainstream studies have suggested that the members of the AP-2 family act as tumor suppressors. In particular, AP-2α has been widely implicated for tumor suppression. During progression to malignant cells, normal breast cells show a gradual loss of AP-2α expression. The down-regulation or absence of AP-2α expression is associated with many cancers such as cutaneous melanomas (14), breast cancer (15), oral squamous cell carcinoma, colon (16), and prostate cancers (17). In contrast, over-expression of AP-2α is known to suppress cell growth (18) and induce apoptosis in cell lines of breast cancer (19), retinoblastoma (20), and colon and others (21). Furthermore, AP-2α has been shown to reduce intestinal tumor formation in Apc min mice (22). Conversely, the dominant negative mutant of AP-2α has been shown to increase invasiveness and tumorigenesis (14). Therefore, AP-2α seems to function as a bona fide tumor suppressor gene.

However, some other studies suggest that AP-2α may also act as an oncogene. For example, AP-2α expression has been found to be up-regulated in human primary pituitary tumors as compared with normal tissues (23). AP-2α also up-regulates the expression of proto-oncogene ERBB-2, which is over-expressed in many malignant tumors, such as primary human breast cancers (24). In addition, it has been shown that over-expression of AP-2α in cells significantly increases cell survival under UVA irradiation (25), suggesting a protective role of AP-2α against cell death from UV stress. On the other hand, the absence of AP-2α retards cell growth in embryonic fibroblasts (26). Direct knockdown of AP-2α expression by RNAi dramatically inhibits cancer cell growth in both cell line and animal model of nasopharyngeal carcinoma (27). Taken together, it appears that, depending on the context, AP-2α may function as either a tumor suppressor gene or an oncogene.

During functional studies of DLEC1, we suspect that DLEC1 may also play such dual opposing function in cancer cell growth. Thus, the aim of this study was to investigate whether the growth of cancer cells could be stimulated, instead of suppressed when AP-2α is modulated. We established DLEC1 over-expressing stable clones of HCT116, a colorectal cancer cell line, and subsequently examined the growth of these cells with or without the modulation of AP-2α expression. When AP-2α was not modulated, we confirmed that over-expression of DLEC1, as usual, resulted in cell suppression, by cell cycle arrest at G1 in seven clones and by apoptosis in one clone of the HCT116 cells. Furthermore, we found that one isoform of AP-2α, namely AP-2α2, was up-regulated in all DLEC1 over-expressing stable clones compared with vector clones. Perhaps more importantly, when AP-2α2 was knocked down by siRNAs, over-expression of DLEC1 was found to stimulate, rather than suppress, the proliferation of these cancer cells. All together, these findings suggest that DLEC1, besides being a tumor suppressor, may also play a potential role in the survival of cancer cells, depending, at least partly, on AP-2α2 expression level in HCT116 stable clones.

2. Objectives

The current study was performed to examine the cellular function of DLEC1 in colonrectal cancer cell HCT116 by establishing DLEC1 over-expressing stable clones.

3. Materials and Methods

3.1. Cell Culture

The human colorectal cancer cell line, HCT116, was purchased from American type culture collection (ATCC) and grown in McCoy’s 5A medium (Sigma-Aldrich Corporation) with 10% fetal bovine serum (Invitrogen Corporation, Inc.), at 37°C in a 5% CO2 humidified atmosphere.

3.2. Transfection of cells and establishment of stable clones

DLEC1 expression vector, pcDNA31DLEC1, was constructed previously (6). The plasmids for cell transfection were isolated and purified using the EndoFree Plasmid Kit (Qiagen), according to the manufacturer’s protocol. Cells were transfected by plasmids or siRNAs via Lipofectamine 2000 (Invitrogen Corporation, Inc.) or Lipofectamine RNAiMAX Transfection Reagent (Invitrogen) and OPTI-MEM (Gibco-BRL), respectively, as recommended by the manufacturers. To establish stable clones, 48 hours post-transfection, cells were trypsinized, serially diluted and re-seeded in 96-well plates with media containing 600 µg/mL G418 (GIBCO). Cells in 96-well plates were inspected daily under the microscope. Colonies that were derived clearly from a single cell within a well and survived, after a two- to three-week selection, were expanded by trypsinizing and replating cells in 24-well and then in six-well plates in clonal selection media. Half of the cells from each G418 positive colony were collected to screen the DLEC1 expression by conventional RT-PCR, real-time RT-PCR and Western blot. The other half of the cells was frozen down for storage. DLEC1 expressing clones were selected for further investigation. Meanwhile, stable controls were isolated from cells transfected with an empty pcDNA31 vector, following the same procedure.

3.3. Colony Formation Assay

Colony formation was carried out as previously described (6). Briefly, the cells of stable clones were plated in six-well plates with the initial cell number of 0.5 or 1 K in triplicates and cultured in medium containing 600 µg/mL G418 for two to three weeks. The colonies were then fixed by methanol and stained.

3.4. Luciferase Assay

Forty-eight hours post-transfection, luciferase activities were assayed using Dual-Luciferase reporter assay system (Promega) following the standard protocol provided by Promega. Briefly, cells were washed once with Phosphate-Buffered saline (PBS) at room temperature, before lysing in passive lysis buffer. Subsequently, firefly and Renilla luciferase activities were measured by reading luminescence using a luminometer (TECAN), according to the procedures and reagents provided. The relative firefly luciferase activities of each sample were calculated by normalizing the firefly luciferase activity with Renilla luciferase in the same sample to correct for transfection efficiency, and then by standardizing to that from the sample transfected with empty vector control (GAL4).

3.5. Extraction of RNA and Reverse Transcription-Polymerase Chain Reaction

Total cellular RNA was extracted from cells cultured in six-well plates using RNeasy Kit (Qiagen), according to manufacturer’s instructions. Traditional RT-PCR (6) and Real-time RT-PCR (28) were conducted as previously described, respectively. The used primers are listed in Table 1 or as described in previous papers (6, 29).

Table 1.

List of Primersa

GeneNameSequence (5’→3’)
DLEC1DLEC1LCF2CACGGAAGAGGCATCG
DLEC1LCR2ATAAGCCGGAAGTAGTGT
Cyclin A2CA2FTTTGGGGCCTCCTGTCTG
CA2RTGCTTCAGACTCCACGGG
Cyclin B1CB1FTGCTGCAACCTCCAAGCC
CB1RGGCACCAGCATAGGTACC
Cyclin D1CD1FCCATGGAACACCAGCTCC
CD1RAAGACCTCCTCCTCGCAC
Cyclin D3CD3FGCTGCTGTGTTGCGAAGG
CD3RCATGGCCAGGGGGAAGAC
Cyclin E1CE1FACAGGGATGCGAAGGAGC
CE1RAGGGGTCTGCACAGACTG
p21P21FCACCGAGGCACTCAGAGGA
P21RTCGAAGTTCCATCGCTCACG
SP1SP1FTTGTCCCTCAGCTGCCAC
SP1RGGCTGTGAGGTCAAGCTC
SP3SP3FATGGCTGCCTTGGACGTG
SP3RAATCACCTGTCGCTCCGG
AP2α1AP2α1FATATCCGTTCACGCCGATCC
AP2αRGGGGGGAAGTATGGGGGCTG
AP2α2AP2α2FTCGTTACCCCAGACTCTTCG
AP2 α RGGGGGGAAGTATGGGGGCTG
AP2γAP2γFACTGGCGACTGTTTTGGGGG
AP2γRGGGGGAAAGTAGGGTGGCGG
AP2εAP2εFAGCTACCGCACCGTGACCTC
AP2εRGGCGGGAAGTAGGGCGGCTG

3.6. Extraction of Protein and Western Blotting

Collected cells were suspended in cold radioimmnunoprecipitation assay (RIPA) (1 × PBS, 1% NP40, 0.5% sodium deoxycholate, and 0.1% SDS) and sonicated. Protein extracts were subjected to SDS-Polyacrylamide Gel Electrophoresis (PAGE) and transferred onto polyvinylidene fluoride (PVDF) membranes (Millipore), blocked with 1x PBS buffer containing 0.1% Tween 20 and 5% (w/v) skimmed milk powder and probed with an indicated primary antibody, subsequently with an anti-rabbit or an anti-mouse secondary antibody, and followed by enhanced chemiluminescence detection with SuperSignal West Dura (Pierce Biotechnology, Inc. Rockford, IL) chemiluminescent substrate. Expression of GAPDH or β-actin was used as a loading control. The primary antibodies used were anti-DLEC1 (HPA019077, Sigma-Aldrich), anti-p21 (Santa Cruz Biotechnologies Inc., Santa Cruz, CA, USA), anti-β-actin (Santa Cruz) and anti-GAPDH (Chemicon International Inc., Ternecula, CA, USA).

3.7. Flow Cytometry (FACS) and Cell Proliferation Assay

Experiments were carried out as described previously (6). Briefly, for cell cycle analysis, all cells were collected and fixed with 70% ethanol overnight, washed with PBS twice and then stained with propidium iodide solution. Cells were filtered before flow cytometry (Epics Elite Esp, Beakman coulter, USA) analysis. The relative cell numbers were analyzed using WinMDI (V2.8) and calculated. To monitor cell proliferation, 1000 cells were plated in 96-well plates and incubated at 37°C for the indicated duration. At the end of incubation, the numbers of viable cells were determined by the standard 3-(4, 5-dimethylthiazolyl-2)-2, 5-diphenyltetrazolium bromide (MTT) assay.

3.8. Statistical Analysis

Experimental differences were tested for statistical significance using the two-tailed t-test. P values of <0.05 were considered significant.

4. Results

4.1. The Transcriptional Regulatory Potency of DLEC1

To determine the potential biological function of DLEC1, we first performed a computer-based functional domain prediction of the DLEC1 protein. Using protein domain prediction programs PROSITE and SPORT II, we found a bipartite nuclear localization signal (NLS) KKELNKKLEDSCRKK at residues 245 - 259. This sequence matches perfectly with the consensus sequence of a typical bipartite NLS, which is composed of two small clusters containing basic amino acids KK and RKK, separated by ten amino acids (30). Therefore, we speculated that DLEC1 might be a transcriptional factor. Thus, we conducted GAL4-based luciferase assays to determine the transcriptional regulatory activity of DLEC1. According to the computational analysis of the available orthologous DLEC1 amino acid sequences, four potential conserved domains were identified in human DLEC1. Therefore, DLEC1 was divided into four fragments. The full-length DLEC1 open reading frame (ORF) or its four fragments A, B, C, or D was cloned into the pcDNA31GAL4 plasmid to produce GAL4-DLEC1 fusion proteins (Figure 1 A). The resulting plasmids were co-transfected with a luciferase reporter construct containing 5x GAL4 binding sites upstream of the firefly luciferase gene. Within transfected cells, the expressed GAL4-DLEC1 fusion protein bound to GAL4 binding sites to regulate luciferase gene expression. By measuring the luciferase activities, we determined the ability of DLEC1 to alter the transcription of luciferase gene. As shown in Figure 1 B, we observed only a slight increase of luciferase activity in the cells transfected with the full-length DLEC1 (2.6-fold), and fragments A, B, and D (1.4, 2.0, and 2.3-fold, respectively) as compared with that in the vector control alone (GAL4, Figure 1, right). Fragment C did not affect luciferase activity at all. These results indicate that DLEC1 is only able to slightly up-regulate the transcription of the target gene. Therefore, the main function of DLEC1 might not be a transcriptional factor due to the limited induction of transcription level over vector control by full-length ORF of DLEC1 or its derived fragments.

Transcription Activities of DLEC1
A, Schematic illustration of the full-length of DLEC1 ORF and its four fragments used in this study. Numbers with arrows denote the boundary nucleotide position in DLEC1 DNA fragments (top); schematic representation of the four peptides encoded by DLEC1 DNA fragments. Numbers with bars depict boundary amino acid residues in DLEC1 protein fragments (bottom); B, Relative luciferase activities affected by DLEC1 and its fragments. HCT116 cells were transiently co-transfected with firefly luciferase reporter plasmid, GAL4-DLEC1 (or fragments) construct and Renilla luciferase plasmid. Relative luciferase activity of each sample was expressed as firefly luciferase activity divided by the corresponding Renilla luciferase activity to correct for transfection efficiency and subsequently standardized to that from the empty vector control (GAL4). All data are presented as mean ± Standard Error (SE) and are representative of one of at least two independent experiments performed in triplicates.

4.2. Characterization of DLEC1-Overexpresing Stable Clones in the HCT116 Cell Line

Given that DLEC1 might not be a transcriptional factor, we aimed to study its function in DLEC1 stable clones of HCT116 cell line. Eight clones with DLEC1 stable over-expression were obtained (Figure 2 A) by transfecting cells with the DLEC1 expression construct pcDNA31DLEC1, and screening the G418-resistant clones using conventional RT-PCR and then validating the expression of DLEC1 using real-time RT-PCR and Western blotting. The expression of DLEC1 in these stable clones was variable, with the highest in clone DLEC1-7 and the lowest in clone DLEC1-3, based on real-time RT-PCR (Figure 2 A) and Western blotting (Figure 2 B). As shown in Figure 2 C and 2D, two DLEC1 stable clones, DLEC1-7, and DLEC1-3, and one vector control clone were used to assess the inhibitory effect of DLEC1 on cell proliferation by colony formation assay. Compared to the vector control, DLEC1 over-expression reduced the number of colonies and the reduction of colonies seemed negatively correlated with DLEC1 expression level, confirming the usual role of cell suppression of DLEC1 in HCT116 cells. Moreover, DLEC1 overexpression suppressed cell proliferation and this suppression was proportional to the DLEC1 expression levels as assessed by MTT (Figure 2 E). Therefore, all these clones were subsequently subjected to cell cycle analysis. As shown in Table 2, stable expression of DLEC1 resulted in defects in cell cycle, with G1 arrest in seven clones and apoptosis in one clone. Compared with vector controls, the cell fraction accumulation in G1 increased from ~ 45% to ~ 55% in seven clones, and in sub-G1 from ~ 15% to 36% in the remaining one clone. The data were consistent with our previous report of G1 arrest of cell cycle in one stable clone of DLEC1 in HepG2 (6). These results demonstrated that stable expression of DLEC1 leads to the suppression of cancer cell growth in both cell lines of hepatocellular carcinoma (HepG2) and colorectal cancer (HCT116), probably due to cell cycle defects, especially G1 arrest.

Characterization of DLEC1 in Stable Clones
Stable clones of DLEC1 over-expression were generated by transfection of pcDNA31DLEC1 construct in HCT116. On G418 selection, positive stable clones were verified for DLEC1 expression level by A, Real-time RT-PCR and B, Western Blotting. The relative expression of DLEC1 was expressed as DLEC1 mRNA level divided by GAPDH mRNA level and subsequently normalized against that from the pcDNA31 vector control. DLEC1 over-expression was able to suppress cell proliferation as shown by C, representative colony formation; D, quantification of colony formation and E, MTT assay. The initial plated cell numbers are indicated below. All data are presented as mean ± SE and are one representative of at least two independent experiments performed in triplicates. *, P < 0.05.
Table 2.

Cell Cycle Analysis of DLEC1 Stable Clones

VariablesControlsDLEC1-Transfected Stables
3434567101115
Sub-G116.311.67.110.18.213.16.610.112.136.2
G146.341.057.656.754.066.457.856.755.548.3
S19.826.122.018.122.312.218.218.117.28.1
G2/M17.621.312.315.115.58.317.415.115.27.4

4.3. The Role of p21 in G1 Arrest

Progression of cell cycle is widely known to be negatively regulated by p21, causing G1 arrest (31). Therefore, we analyzed the expression level of p21 in stable clones. From the eight clones, DLEC1-6, 7, 10, and 11 obviously exhibited higher level of p21 expression as compared to the controls by conventional RT-PCR, and real-time RT-PCR (6 ~ 8-fold), respectively (Figure 3 A and B). The increases in p21 level were also confirmed by Western blotting (Figure 3 C). Hence, our results suggest that p21 was likely involved in the G1 arrest caused by DLEC1 stable expression, at least in some of the stable clones.

p21 Expression of DLEC1 Stable Clones
Cultured stable cells were harvested and RNA or protein was prepared for A, conventional RT-PCR; B, Real-time RT-PCR or C, Western blotting. GAPDH or β-actin was used as a loading control for PCR or Western blot analysis, respectively. The relative expression of p21 was expressed as the p21 mRNA level divided by GAPDH mRNA level and subsequently normalized against that from the pcDNA31 vector control.

4.4. The Role of AP-2α2 in Mediation of DLEC1-Regulated Cancer Cell Growth

Figure 4 further shows that p21 was up-regulated in stable clones DLEC1 -5, -6, -7, -10, and -11, but not in DLEC1-3, -4 and -15. To explore the existence of master regulatory factor(s) that could be up-regulated in all the stable clones, we screened multiple potential factors that have been shown to affect G1 arrest in cell cycle using traditional RT-PCR, including cyclin A1, A2, B1, E1, D1, D2, and D3, and transcriptional factors SP1, SP2 and SP3 as well as all members of the AP-2 family (data not shown for cyclin A1, D2 and SP2 and some members of the AP-2 family). Amongst all the examined factors, we found that only AP-2α2 was up-regulated at varying levels in all stable clones (Figure 4). To determine whether the increase of AP-2α2 mediated the cell suppression caused by DLEC1 stable over-expression, we knocked down AP-2α2 expression using siRNAs against AP-2α2 in the highest and lowest DLEC1 expression stable clones, i.e. DLEC1-7 and DLEC1-3, respectively, and one vector control clone. The AP-2α2 siRNAs were shown to effectively knock down the expression of AP-2α2 (32, 33). Figure 5 A shows the down-regulation of AP-2α2 by RNA interference in both stable clones and the control using RT-PCR. The expression of AP-2α2 in all these clones was down-regulated to > 70%, after knockdown by two siRNAs. Figure 5 B shows the time-course of cell proliferation by measuring the number of viable cells at different time points after AP-2α2 knockdown. The growth pattern of cells knocked down by scramble (SCR) (Figure 5 B, top) was similar to those under normal non-knockdown conditions (Figure 2 E), with slowest cell growth in DLEC1-7 clones (highest DLEC1 expression) and fastest growth in the vector control pcDNA31 (lowest DLEC1 expression). The cell proliferation in DLEC1-overexpressing clones was significantly decreased (p < 0.05) at d5 post-seeding and onwards compared to the vector control clone. This result is consistent with the function of DLEC1 as a tumor suppressor that suppresses cell growth.

Identification of Factors Involved in G1 Arrest in Cell Cycle
Stable cells were cultured for extraction of RNA used in conventional RT-PCR analyses with indicated genes. GAPDH was used as an internal control for PCR.
Effects of AP-2α2 Knockdown
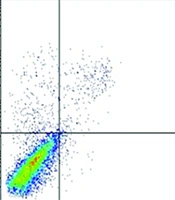
A, Down-regulation of AP-2α2 by siRNAs against AP-2α2; B, relative cellular proliferation; C, cell cycle analyses; and D, alteration of cells in sub-G1 and G1 fractions after the down-regulation of AP-2α2. Stable cells of three clones were transfected with AP-2α2 siRNAs and cells were harvested for analysis after 72 hours (or as indicated). For fluorescence activated cell-sorting (FACS) analysis, transfected cells were harvested, fixed, treated with RNase, and stained by PI. Cells in the sub-G1 phase were regarded as apoptotic cells. The numbers in insets of C indicate sub-G1 (upper) or G1 (lower) percentage of cells. The numbers in D are the comparison results of sub-G1 or G1 in AP-2α2 knockdown samples with respective SCR samples in each stable clones. All data are presented as mean ± SE and are one representative of at least two independent experiments performed in triplicates. *, P < 0.05; **, P < 0.01.

Interestingly, we found that AP-2α2 knockdown attenuated relative cell proliferation when compared to its respective SCR knockdown, including the stable clone of the empty vector control (pcDNA31) (Figure 5 B). For example, at d6 in the stable clone, pcDNA31, the relative proliferation was -17.5% by siAP2α2-3 (from 20% in SCR to 2.5% in siAP2α2-3) or -14% by siAP2α2-4 (from 20% in SCR to 6% in siAP2α2-4). These data showed that AP-2α2 is required for cell growth, which is consistent with the earlier reports about the role of AP-2α2 in cell survival and proliferation (26, 27). Unexpectedly, the loss of cell proliferation by AP-2α2 knockdown was partially reversed by DLEC1 over-expression in stable clones. At the same time-point in the stable DLEC1-3 clone (lowest DLEC1 over-expression), the relative proliferation was -8% (siAP2α2-3) or -2% (siAP2α2-4), and in DLEC1-7 (highest DLEC1 over-expression) this was 0% (siAP2α2-3) or +6% (siAP2α2-4). The above data indicate that in the absence of AP-2α2, DLEC1 loses its ability to suppress cell proliferation and conversely, stimulates cell growth. It also appears that the stimulation was proportional to the expression level of DLEC1 in stable clones after AP-2α2 knockdown, suggesting the promoting role of DLEC1 in cell progression in the absence of AP-2α2. Furthermore, cell proliferation in DLEC1-overexpressing clones was significantly increased (P < 0.05) at d5 post-seeding compared to the vector control clone. Hence, the cells of DLEC1-7 had the fastest, and those of pcDNA31 the slowest growth after AP-2α2 was knocked down by both siRNAs (Figure 5 B).

To further investigate the role of AP-2α2 in cell suppression, we analyzed the cell cycle of these three clones after AP-2α2 knockdown. Figure 5 C shows the percentages of sub-G1 (top) and G1 (bottom) from each sample. After AP-2α2 knockdown by two siRNAs, the sub-G1 cell fractions increased and G1 decreased in all six samples, including two DLEC1 stable clones and one vector control (Figure 5 D), compared with those in SCR. We found that AP-2α2 knockdown, caused obvious cell death in all three stable clones, regardless of the expression level of DLEC1. This observation may explain the loss of cell proliferation shown in Figure 5 B, where AP-2α2 knockdown attenuated relative cell proliferation even in the empty vector control (pcDNA31). Moreover, we found that cells in the G1 fraction decreased more in DLEC1 stable clones than those in vector control after AP-2α2 knockdown, especially by siAP2α2-4 (Figure 5 D). These data indicate that, opposing to the known function of inducing G1 arrest, DLEC1 is no longer able to increase yet instead to decrease cells in the G1 fraction in the absence of 2α2. It also seemed that more cells were decreased in the G1 fraction with higher DLEC1 expression after AP-2α2 knockdown, suggesting the possible promoting role of DLEC1 in cell cycle progression in the absence of AP-2α2 in HCT116 stable clones.

5. Discussion

Our and others’ previous reports have demonstrated that the tumor suppressor DLEC1 is able to suppress cancer cell growth in vitro and in vivo (2, 6). The present study further confirmed the cell suppression function of DLEC1 by inducing G1 arrest and apoptosis in DLEC1 stable clones in colorectal cancer cell line HCT116. Induction of G1 arrest is a complex process, involving numerous factors. In addition to those tested in our study, others, such as p27 and pRb, also regulate G1/S transition (34). In this study, we found that over-expression of DLEC1 stimulated the expression of AP-2α2 (Figure 4), another tumor suppressor known to induce cell cycle arrest at G1 and apoptosis in various cancers (19-21). Therefore, cancer cell suppression by DLEC1 may be mediated through up-regulation of AP-2α2.

Nevertheless, given that DLEC1 is unlikely to be a transcription factor (Figure 1), and that AP-2α2 was up-regulated at transcriptional level by DLEC1 over-expression (Figure 4), DLEC1 is not likely to directly induce the expression of AP-2α2. At transcriptional level, AP-2α2 has been shown to be up-regulated by transcription factors p53 (35), Sp1 and Sp3 (36), BTEB-1 (37) and enhancer (38) ETS-1, or down-regulated by AP-2α2 repressor AP-2rep (37). Hence, these factors could be one of the intermediate proteins between DLEC1 and AP-2α2. Presumably, DLEC1 could regulate these factors by direct interaction to alter their stability or activity, which could in turn result in increased RNA of AP-2α2. Interestingly, DLEC1 is a large protein with 1755aa and approximate molecular weight of 170 kD. Large proteins usually function as an assembly framework of protein complexes because they generally have multiple domains, which are potentially capable of binding various interaction partners (39). Therefore, DLEC1 might contain certain conserved and interactive domains, which need to be further identified. The identification of these domains would greatly help the understanding of the physiological roles for DLEC1.

On the other hand, our results further showed that cell proliferation was suppressed (Figure 5B) and more dead cells were detected (Figure 5 C and 5D) after knockdown of AP-2α in all HCT116 stable clones, including the vector control. Therefore, our current results support that AP-2α is essential for cell proliferation. Consistent with this finding, some evidences have indicated that AP-2α can act like an oncogene and might be required for cell survival and proliferation. Shi et al. recently reported that knockdown of AP-2α gene expression by siRNA dramatically suppresses cancer cell growth in vitro and in vivo (27), suggesting the requirement of AP-2α for cell proliferation. To account for the balance between cell survival and cell death, proposals for dual regulation of cellular homeostasis by AP-2α have been suggested with both activation and inhibition of apoptotic signaling pathways, possibly depending on the cell type (40), specific AP-2 isoforms, the ratio between isoforms in the AP-2 family and/or the ratio between isoform and AP-2-modulating factors in cells (41). Therefore, the dual opposing function nature of AP-2α2 could also imply similar properties of DLEC1 provided that AP-2α2 is an important downstream effector of DLEC1 in HCT116.

Previous studies have demonstrated that besides AP-2α2, certain other gene products can also work in this dual function manner. One example is CCAAT/Enhancer Binding Protein β (C/EBPβ), a basic leucine-zipper transcription factor. The C/EBP is involved in the regulation of genes in energy homeostasis, differentiation, proliferation, immune functions, female reproduction, tumorigenesis, and apoptosis. Conversion of C/EBPβ from a transcriptional repressor to an activator is contingent upon phosphorylation of a MAPK site by Ras oncoprotein accompanied by conformational change (42). Another example is Sp3 (specificity protein 3), a zinc-finger DNA-binding domain transcription factor. Sp3 executes the dual function of both transcriptional activation and repression in a sumo-dependent manner. Sumoylation of Sp3 is one of the main regulatory events controlling the activity of this transcription factor and is thus potentially the molecular switch that determines Sp3 to function as an activator or a repressor (43). Similarly, in the case of DLEC1, AP-2α2 appears to be a molecular switch to govern the cell suppression or proliferation function of DLEC1. Furthermore, DLEC1 suppresses cancer cell growth in the presence of AP-2α2 and could promote cell growth and/or cell cycle progression in the absence of AP-2α2 in HCT116. Additional investigations are needed to confirm cell survival function of DLEC1 and define the molecular mechanism(s) by which DLEC1 contributes to cell survival.

In summary, as described above, the data from HCT116 stable clones show that compared to the empty vector control, DLEC1 over-expression resulted in cell suppression and increased expression of AP-2α2. However, after AP-2α2 knockdown by siRNAs, DLEC1 became unable to suppress cell growth and increase cells in the G1 fraction. Instead, it stimulated cell growth and decreased cells in the G1 fraction. Therefore, we can conclude that DLEC1 could be a suppressor of cell proliferation in the presence of AP-2α2 as well as a promoter of cell growth and/or cell cycle progression in the absence of AP-2α2 in HCT116. Such dual function of DELC1 may provide important insights for the understanding of the physiological role of DLEC1, especially the function in cell survival, which would reveal possible new targets for therapeutic interventions.

Acknowledgements

References

  • 1.

    Daigo Y, Nishiwaki T, Kawasoe T, Tamari M, Tsuchiya E, Nakamura Y. Molecular cloning of a candidate tumor suppressor gene, DLC1, from chromosome 3p21.3. Cancer Res. 1999;59(8):1966-72. [PubMed ID: 10213508].

  • 2.

    Kwong J, Lee JY, Wong KK, Zhou X, Wong DT, Lo KW, et al. Candidate tumor-suppressor gene DLEC1 is frequently downregulated by promoter hypermethylation and histone hypoacetylation in human epithelial ovarian cancer. Neoplasia. 2006;8(4):268-78. [PubMed ID: 16756719]. https://doi.org/10.1593/neo.05502.

  • 3.

    Seng TJ, Currey N, Cooper WA, Lee CS, Chan C, Horvath L, et al. DLEC1 and MLH1 promoter methylation are associated with poor prognosis in non-small cell lung carcinoma. Br J Cancer. 2008;99(2):375-82. [PubMed ID: 18594535]. https://doi.org/10.1038/sj.bjc.6604452.

  • 4.

    Ying J, Poon FF, Yu J, Geng H, Wong AH, Qiu GH, et al. DLEC1 is a functional 3p22.3 tumour suppressor silenced by promoter CpG methylation in colon and gastric cancers. Br J Cancer. 2009;100(4):663-9. [PubMed ID: 19156137]. https://doi.org/10.1038/sj.bjc.6604888.

  • 5.

    Park SY, Kwon HJ, Lee HE, Ryu HS, Kim SW, Kim JH, et al. Promoter CpG island hypermethylation during breast cancer progression. Virchows Arch. 2011;458(1):73-84. [PubMed ID: 21120523]. https://doi.org/10.1007/s00428-010-1013-6.

  • 6.

    Qiu GH, Salto-Tellez M, Ross JA, Yeo W, Cui Y, Wheelhouse N, et al. The tumor suppressor gene DLEC1 is frequently silenced by DNA methylation in hepatocellular carcinoma and induces G1 arrest in cell cycle. J Hepatol. 2008;48(3):433-41. [PubMed ID: 18191269]. https://doi.org/10.1016/j.jhep.2007.11.015.

  • 7.

    Zhang Q, Ying J, Li J, Fan Y, Poon FF, Ng KM, et al. Aberrant promoter methylation of DLEC1, a critical 3p22 tumor suppressor for renal cell carcinoma, is associated with more advanced tumor stage. J Urol. 2010;184(2):731-7. [PubMed ID: 20639048]. https://doi.org/10.1016/j.juro.2010.03.108.

  • 8.

    Kwong J, Chow LS, Wong AY, Hung WK, Chung GT, To KF, et al. Epigenetic inactivation of the deleted in lung and esophageal cancer 1 gene in nasopharyngeal carcinoma. Genes Chromosomes Cancer. 2007;46(2):171-80. [PubMed ID: 17099870]. https://doi.org/10.1002/gcc.20398.

  • 9.

    Chan WH, Chang KP, Yang SW, Yao TC, Ko TY, Lee YS, et al. Transcriptional repression of DLEC1 associates with the depth of tumor invasion in oral squamous cell carcinoma. Oral Oncol. 2010;46(12):874-9. [PubMed ID: 20952247]. https://doi.org/10.1016/j.oraloncology.2010.09.007.

  • 10.

    Wang Z, Li L, Su X, Gao Z, Srivastava G, Murray PG, et al. Epigenetic silencing of the 3p22 tumor suppressor DLEC1 by promoter CpG methylation in non-Hodgkin and Hodgkin lymphomas. J Transl Med. 2012;10:209. [PubMed ID: 23050586]. https://doi.org/10.1186/1479-5876-10-209.

  • 11.

    Eckert D, Buhl S, Weber S, Jager R, Schorle H. The AP-2 family of transcription factors. Genome Biol. 2005;6(13):246. [PubMed ID: 16420676]. https://doi.org/10.1186/gb-2005-6-13-246.

  • 12.

    Stabach PR, Thiyagarajan MM, Woodfield GW, Weigel RJ. AP2alpha alters the transcriptional activity and stability of p53. Oncogene. 2006;25(15):2148-59. [PubMed ID: 16288208]. https://doi.org/10.1038/sj.onc.1209250.

  • 13.

    Kuckenberg P, Kubaczka C, Schorle H. The role of transcription factor Tcfap2c/TFAP2C in trophectoderm development. Reprod Biomed Online. 2012;25(1):12-20. [PubMed ID: 22560121]. https://doi.org/10.1016/j.rbmo.2012.02.015.

  • 14.

    Bar-Eli M. Gene regulation in melanoma progression by the AP-2 transcription factor. Pigment Cell Res. 2001;14(2):78-85. [PubMed ID: 11310795].

  • 15.

    Powe DG, Akhtar G, Habashy HO, Abdel-Fatah T, Rakha EA, Green AR, et al. Investigating AP-2 and YY1 protein expression as a cause of high HER2 gene transcription in breast cancers with discordant HER2 gene amplification. Breast Cancer Res. 2009;11(6):R90. [PubMed ID: 20025767]. https://doi.org/10.1186/bcr2461.

  • 16.

    Ropponen KM, Kellokoski JK, Pirinen RT, Moisio KI, Eskelinen MJ, Alhava EM, et al. Expression of transcription factor AP-2 in colorectal adenomas and adenocarcinomas; comparison of immunohistochemistry and in situ hybridisation. J Clin Pathol. 2001;54(7):533-8. [PubMed ID: 11429425].

  • 17.

    Zhang X, Leung YK, Ho SM. AP-2 regulates the transcription of estrogen receptor (ER)-beta by acting through a methylation hotspot of the 0N promoter in prostate cancer cells. Oncogene. 2007;26(52):7346-54. [PubMed ID: 17525739]. https://doi.org/10.1038/sj.onc.1210537.

  • 18.

    Zeng YX, Somasundaram K, el-Deiry WS. AP2 inhibits cancer cell growth and activates p21WAF1/CIP1 expression. Nat Genet. 1997;15(1):78-82. [PubMed ID: 8988173]. https://doi.org/10.1038/ng0197-78.

  • 19.

    Yan F, He Q, Hu X, Li W, Wei K, Li L, et al. Direct regulation of caspase3 by the transcription factor AP2alpha is involved in aspirininduced apoptosis in MDAMB453 breast cancer cells. Mol Med Rep. 2013;7(3):909-14. [PubMed ID: 23292806]. https://doi.org/10.3892/mmr.2013.1257.

  • 20.

    Li X, Glubrecht DD, Godbout R. AP2 transcription factor induces apoptosis in retinoblastoma cells. Genes Chromosomes Cancer. 2010;49(9):819-30. [PubMed ID: 20607706]. https://doi.org/10.1002/gcc.20790.

  • 21.

    Wajapeyee N, Britto R, Ravishankar HM, Somasundaram K. Apoptosis induction by activator protein 2alpha involves transcriptional repression of Bcl-2. J Biol Chem. 2006;281(24):16207-19. [PubMed ID: 16533807]. https://doi.org/10.1074/jbc.M600539200.

  • 22.

    Li Q, Lohr CV, Dashwood RH. Activator protein 2alpha suppresses intestinal tumorigenesis in the Apc(min) mouse. Cancer Lett. 2009;283(1):36-42. [PubMed ID: 19376641]. https://doi.org/10.1016/j.canlet.2009.03.026.

  • 23.

    Yu S, Asa SL, Weigel RJ, Ezzat S. Pituitary tumor AP-2alpha recognizes a cryptic promoter in intron 4 of fibroblast growth factor receptor 4. J Biol Chem. 2003;278(22):19597-602. [PubMed ID: 12642581]. https://doi.org/10.1074/jbc.M212432200.

  • 24.

    Zhu C, Huang Y, Weydert CJ, Oberley LW, Domann FE. Constitutive activation of transcription factor AP-2 is associated with decreased MnSOD expression in transformed human lung fibroblasts. Antioxid Redox Signal. 2001;3(3):387-95. [PubMed ID: 11491651]. https://doi.org/10.1089/15230860152409031.

  • 25.

    Yu L, Hitchler MJ, Sun W, Sarsour EH, Goswami PC, Klingelhutz AJ, et al. AP-2alpha Inhibits c-MYC Induced Oxidative Stress and Apoptosis in HaCaT Human Keratinocytes. J Oncol. 2009;2009:780874. [PubMed ID: 20066163]. https://doi.org/10.1155/2009/780874.

  • 26.

    Pfisterer P, Ehlermann J, Hegen M, Schorle H. A subtractive gene expression screen suggests a role of transcription factor AP-2 alpha in control of proliferation and differentiation. J Biol Chem. 2002;277(8):6637-44. [PubMed ID: 11741941]. https://doi.org/10.1074/jbc.M108578200.

  • 27.

    Shi D, Xie F, Zhang Y, Tian Y, Chen W, Fu L, et al. TFAP2A regulates nasopharyngeal carcinoma growth and survival by targeting HIF-1alpha signaling pathway. Cancer Prev Res (Phila). 2014;7(2):266-77. [PubMed ID: 24335623]. https://doi.org/10.1158/1940-6207.CAPR-13-0271.

  • 28.

    Qiu GH, Leung CH, Yun T, Xie X, Laban M, Hooi SC. Recognition and suppression of transfected plasmids by protein ZNF511-PRAP1, a potential molecular barrier to transgene expression. Mol Ther. 2011;19(8):1478-86. [PubMed ID: 21540836]. https://doi.org/10.1038/mt.2011.80.

  • 29.

    Huang BH, Laban M, Leung CH, Lee L, Lee CK, Salto-Tellez M, et al. Inhibition of histone deacetylase 2 increases apoptosis and p21Cip1/WAF1 expression, independent of histone deacetylase 1. Cell Death Differ. 2005;12(4):395-404. [PubMed ID: 15665816]. https://doi.org/10.1038/sj.cdd.4401567.

  • 30.

    Fontes MR, Teh T, Jans D, Brinkworth RI, Kobe B. Structural basis for the specificity of bipartite nuclear localization sequence binding by importin-alpha. J Biol Chem. 2003;278(30):27981-7. [PubMed ID: 12695505]. https://doi.org/10.1074/jbc.M303275200.

  • 31.

    Sherr CJ, Roberts JM. Inhibitors of mammalian G1 cyclin-dependent kinases. Genes Dev. 1995;9(10):1149-63. [PubMed ID: 7758941].

  • 32.

    Koinuma D, Tsutsumi S, Kamimura N, Taniguchi H, Miyazawa K, Sunamura M, et al. Chromatin immunoprecipitation on microarray analysis of Smad2/3 binding sites reveals roles of ETS1 and TFAP2A in transforming growth factor beta signaling. Mol Cell Biol. 2009;29(1):172-86. [PubMed ID: 18955504]. https://doi.org/10.1128/MCB.01038-08.

  • 33.

    Allouche A, Nolens G, Tancredi A, Delacroix L, Mardaga J, Fridman V, et al. The combined immunodetection of AP-2alpha and YY1 transcription factors is associated with ERBB2 gene overexpression in primary breast tumors. Breast Cancer Res. 2008;10(1):R9. [PubMed ID: 18218085]. https://doi.org/10.1186/bcr1851.

  • 34.

    Sun A, Bagella L, Tutton S, Romano G, Giordano A. From G0 to S phase: a view of the roles played by the retinoblastoma (Rb) family members in the Rb-E2F pathway. J Cell Biochem. 2007;102(6):1400-4. [PubMed ID: 17979151]. https://doi.org/10.1002/jcb.21609.

  • 35.

    Li H, Watts GS, Oshiro MM, Futscher BW, Domann FE. AP-2alpha and AP-2gamma are transcriptional targets of p53 in human breast carcinoma cells. Oncogene. 2006;25(39):5405-15. [PubMed ID: 16636674]. https://doi.org/10.1038/sj.onc.1209534.

  • 36.

    Hasleton MD, Ibbitt JC, Hurst HC. Characterization of the human activator protein-2gamma (AP-2gamma) gene: control of expression by Sp1/Sp3 in breast tumour cells. Biochem J. 2003;373(Pt 3):925-32. [PubMed ID: 12733991]. https://doi.org/10.1042/BJ20030388.

  • 37.

    Schuierer M, Hilger-Eversheim K, Dobner T, Bosserhoff AK, Moser M, Turner J, et al. Induction of AP-2alpha expression by adenoviral infection involves inactivation of the AP-2rep transcriptional corepressor CtBP1. J Biol Chem. 2001;276(30):27944-9. [PubMed ID: 11373277]. https://doi.org/10.1074/jbc.M100070200.

  • 38.

    Cheng YH, Handwerger S. Identification of an enhancer of the human activating protein-2alpha gene that contains a critical Ets1 binding site. J Clin Endocrinol Metab. 2003;88(7):3305-11. [PubMed ID: 12843180]. https://doi.org/10.1210/jc.2002-021831.

  • 39.

    Nakayama M, Iida M, Koseki H, Ohara O. A gene-targeting approach for functional characterization of KIAA genes encoding extremely large proteins. FASEB J. 2006;20(10):1718-20. [PubMed ID: 16807365]. https://doi.org/10.1096/fj.06-5952fje.

  • 40.

    Muller FU, Loser K, Kleideiter U, Neumann J, von Wallbrunn C, Dobner T, et al. Transcription factor AP-2alpha triggers apoptosis in cardiac myocytes. Cell Death Differ. 2004;11(5):485-93. [PubMed ID: 14752511]. https://doi.org/10.1038/sj.cdd.4401383.

  • 41.

    Orso F, Penna E, Cimino D, Astanina E, Maione F, Valdembri D, et al. AP-2alpha and AP-2gamma regulate tumor progression via specific genetic programs. FASEB J. 2008;22(8):2702-14. [PubMed ID: 18443366]. https://doi.org/10.1096/fj.08-106492.

  • 42.

    Mo X, Kowenz-Leutz E, Xu H, Leutz A. Ras induces mediator complex exchange on C/EBP beta. Mol Cell. 2004;13(2):241-50. [PubMed ID: 14759369].

  • 43.

    Valin A, Gill G. Regulation of the dual-function transcription factor Sp3 by SUMO. Biochem Soc Trans. 2007;35(Pt 6):1393-6. [PubMed ID: 18031229]. https://doi.org/10.1042/BST0351393.