1. Background
Hepatitis C virus (HCV) is a leading cause of chronic liver disease, cirrhosis and is the most common indication for liver transplant in many countries (1-3). HCV is a hepatotropic RNA virus that is a member of the Flaviviridae family and spread primarily by exposure to infected blood (4). According to the CDC, there has been a steady rise in cases of acute HCV across the United States. Of the forty-one reporting states, twelve states-including Indiana, Kentucky and Ohio-contributed 68.6% of acute cases in 2013 (5-9).
In 2012, a case series conducted at the University of Cincinnati described an epidemiologic pattern similar to that described by the CDC. Of the 29 cases, the mean age was 25 years (range 18 - 56), all were Caucasian, and 96.4% reported injection drug use. In addition, all cases were from suburban/exurban communities (10).
2. Objectives
To more robustly analyze HCV rates and demographic characteristics in southwest Ohio, the Ohio disease reporting system (ODRS) was utilized for information on all reported cases of positive HCV testing from 2010 through August 2015.
3. Methods
Data were obtained through the City of Cincinnati health department using ODRS to collect all reported cases of HCV from January 2010 through August 2015 for the following counties: Adams, Brown, Butler, Clermont, Clinton, Greene, Hamilton, Highland, Montgomery, Preble, and Warren. All data were de-identified prior to being provided for review. General demographic data including gender, race, age at time of testing, as well as residential ZIP code, and the HCV test performed were obtained.
In the state of Ohio, all new positive HCV tests are reported to the Ohio department of health. For acute HCV, there must be signs or symptoms consistent with acute viral hepatitis and either jaundice or an elevated ALT to levels > 400 IU/L in addition to positive serology supporting the presence of HCV. Laboratory evidence supporting the presence of HCV includes: positive test for HCV antibody (IgG), hepatitis C recombinant immunoblot assay (RIBA), or nucleic acid test for HCV RNA, and the absence of IgM for hepatitis A and IgM for hepatitis B core antigen. The only exception to this is in regards to individuals < 18 months of age. Due to the persistence of maternal antibody during this time, the only accepted diagnostic laboratory test for infant cases is a positive nucleic acid test for HCV RNA.
Given these strict criteria, and the fact that the majority of acute hepatitis C infections are asymptomatic, it is not surprising that the documentation of acute hepatitis C infection is rather low. If a case does not meet the criteria as defined above for acute HCV, it is considered past or present HCV infection. All cases listed in this category indicate past HCV exposure and subsequent infection but have insufficient data to determine if the reported cases are acute or chronic.
A total of 29,018 cases, from the counties of interest, were sent to the Ohio department of health for review. Each case had an associated case ID, date of testing, information about the test performed and its corresponding results, if available, in addition to the individual’s age at the time of testing, gender, race and county of if it was reported. The cases provided were reviewed, and all duplicate case IDs, entries with no associated HCV testing results, no date associated with the testing performed, or no data on the specific test performed were excluded. Of the initial 29,018 cases provided, 18,678 cases were included for final analysis. Cases were subsequently divided by the year of testing (2010 - 2015). Of the cases reviewed, 100% had data corresponding to the county of residence at the time of testing, 99.5% had a reported age and, 99.4% had a reported gender, but only 50.4% had a reported race. Type of HCV testing reported is as follows: 75% HCV antibody, 21% HCV RNA PCR, and 4% RIBA.
The primary endpoint was the incidence of new cases of positive HCV testing in each county in southwest Ohio. The counties reviewed were Adams, Brown, Butler, Clermont, Clinton, Greene, Hamilton, Highland, Montgomery, Preble, and Warren. US Census data were used to calculate the incidence of newly reported cases of HCV for each year in each county, and for southwest Ohio as a whole. The secondary endpoint was analysis of the demographic data describing the populations at greatest risk. Cases were sorted into the following age groups: 0 - 19, 20 - 29, 30 - 39, 40 - 49, and 50+. Using US Census data, the incidence of newly reported cases of HCV for each year was calculated for southwest Ohio as a whole. Cases were also sorted by gender, reported race (white, black, and other), and results were compared to the regional demographics. The incidence for each group was calculated based on US Census Bureau data. To standardize the data collected in 2015, the projected number of cases was calculated based on the number of cases reported through August 2015.
4. Results
A total of 18,678 cases of positive HCV tests were reported to the Ohio department of health during January 2010 - August 2015. 71.5% of cases were reported from Butler (Cincinnati suburbs and rural areas), Hamilton (Cincinnati and close-in suburbs), and Montgomery (Dayton and close-in suburbs) Counties. The majority of cases were male (53%), white (82%), and aged 20 - 39 (54%).
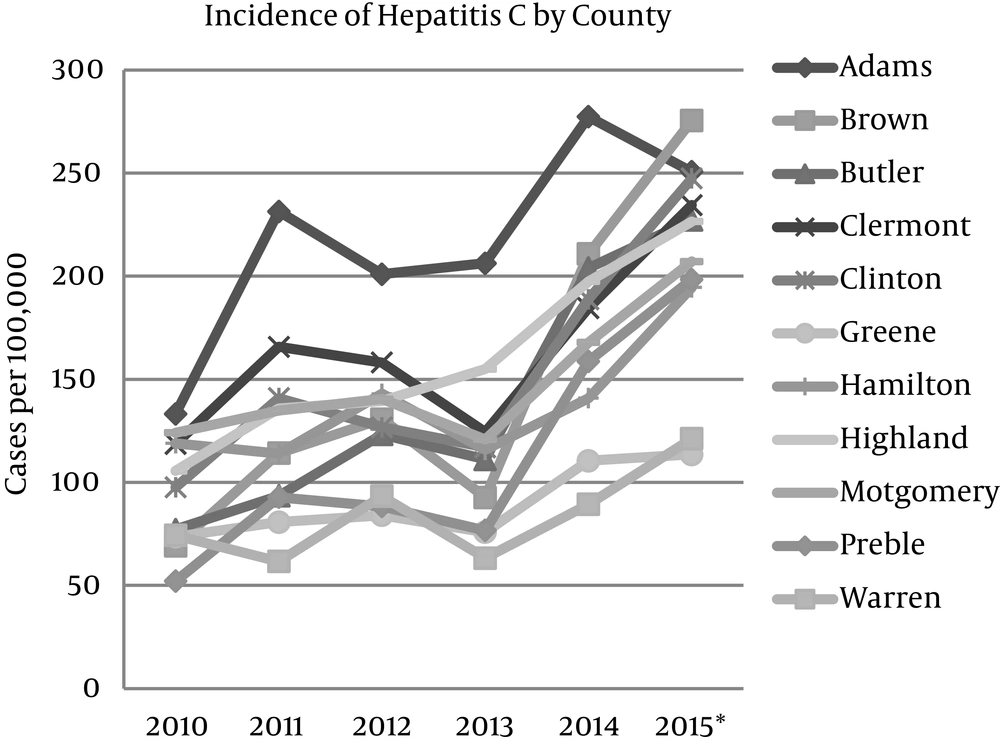
Across southwest Ohio, the incidence of cases of positive HCV tests rose from 104 per 100,000 individuals to 197 per 100,000 individuals-an increase of 89% from 2010 to 2015. All counties included in the analysis demonstrated a rise in the incidence of newly reported cases of positive HCV tests, with the percentage increase ranging from 54.1% to 298.4% (Figure 1). Of these counties, Brown, Butler, Clinton, Highland and Preble each demonstrated a greater than 100% increase in the incidence of positive HCV tests. Brown County demonstrated the most substantial increase in incidence-an increase of 298.4% from 2010 to 2015.
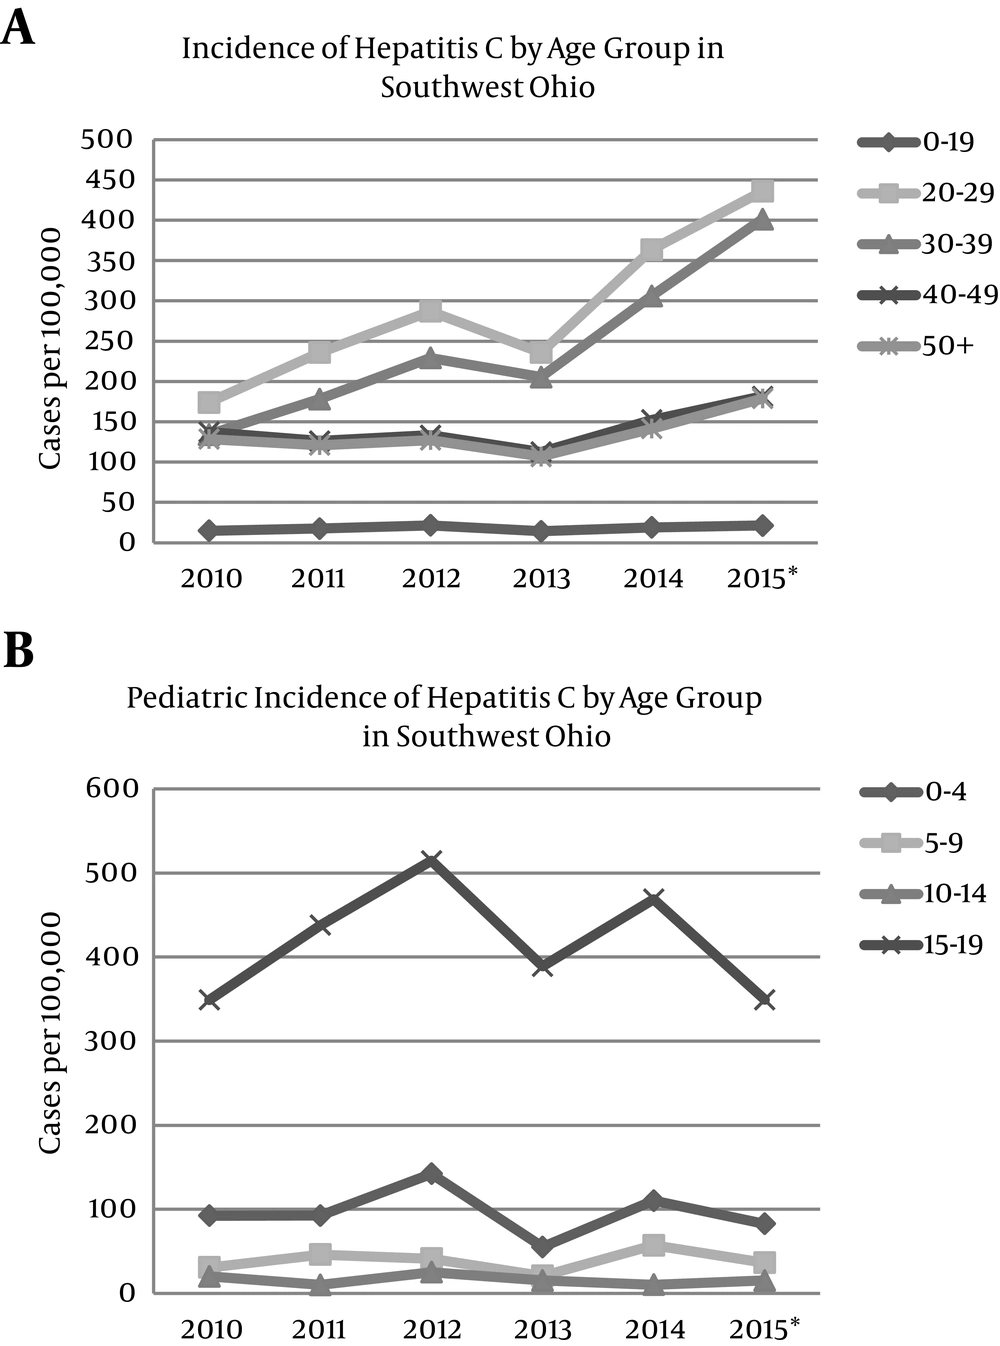
All age groups across southwest Ohio demonstrated an increase in the incidence of positive HCV testing from 2010 - 2015; however, the most substantial rise occurred among individuals 20 - 29 years (150% increase) and 30 - 39 years (199% increase) (Figure 2A). Closer examination of pediatric cases demonstrated that the highest incidence of positive HCV testing occurred among children aged 15 - 19, followed by those aged 0 - 4 (Figure 2B). The incidence of positive HCV tests from 2010 - 2015 increased for both males and females and for all ethnic groups. The greatest increase (79.6%) occurred among whites.
5. Discussion
Overall, the incidence of HCV positivity has risen dramatically from 2010 - 2015 across southwest Ohio. This increase is consistent with national trends noted by the CDC from 2009 through 2013. During this time, there was a rise in acute cases of HCV among individuals 20 - 29 and 30 - 39. Data from Ohio also demonstrate a similar rise in the incidence of HCV positivity in these age groups.
The data also demonstrate that our region’s at risk population is very similar to those identified by the CDC in their review of the surveillance data for acute case reports of HCV in Tennessee, Kentucky, West Virginia and Virginia during 2006 - 2012 (11). This review demonstrated a rise in cases of acute HCV in non-Hispanic whites less than 30 years of age in both urban and non-urban settings; however, the incidence observed in non-urban areas was much higher than those in urban areas (11). The current study demonstrates that Ohio is experiencing a similar rise in HCV positivity in a very similar population. Curiously, between 2010 and 2015 the trend for all age groups demonstrates a constant upward trend, except in 2013. The reason for this uniform drop in cases of HCV is unclear based on the data available.
Despite the similarities in the trends noted in our data when compared to that of the CDC, these data have several limitations. The primary limitation is that all positive HCV tests were collected in aggregate form; thus, true differentiation between acute and chronic infections was not possible. The inability to distinguish true acute versus chronic infection was largely due to the definitions applied by the Ohio department of health in regards to reporting cases of HCV and the dependence on the individual reporting to classify the case as acute or chronic. However, the inability to distinguish acute from chronic HCV infection does not detract from the fact that southwest Ohio has experienced a significant increase in positive HCV tests throughout our region, reflecting an increase in HCV exposure and subsequent infection.
Another limitation of this study is our inability to determine the rate of HCV testing in our region. Without that data, we are unable to determine whether the increase in positive testing is due to a true increase in the incidence of disease versus an increase in the number of individuals being tested and thus a reflection of the region’s true burden of disease. In addition to this, data on race are incomplete. Despite mirroring the region’s racial distribution, these data should be reviewed with caution.
As with many studies, we were unable to determine when individuals are being infected or what risk factors contributed to their infection from the ODRS database. From a public health perspective, it is alarming that individuals aged 20 - 39 years are the group with the greatest rise in the incidence of positive hepatitis C testing. It is also concerning that children aged 15 - 19 have a substantially elevated incidence of positive hepatitis C testing compared to the rest of the pediatric population, suggesting that this age group like those aged 20 - 39, is partaking in activities that increase their risk of infection. Based on the CDC data for Tennessee, Kentucky, West Virginia and Virginia, the most likely risk factor is exposure through injection drug use.
The data collected by the Ohio department of health reflects passive HCV surveillance, and as such, likely is an underestimate of the true burden of HCV infection. Given the advent of curative therapies and the consequences of unrecognized and untreated infection, more active screening measures should be implemented to capture those yet unrecognized cases of HCV in southwest Ohio, including contact tracing as is done for other infections of public health significance such as HIV. The use of disease information specialists to provide a more in-depth investigation into the risk factors associated with hepatitis C infection should be pursued. This would allow for targeted testing and education of at-risk individuals to help prevent ongoing disease transmission and identifying those who could potentially benefit from medical intervention. In addition, by identifying geographic locations with the highest risk for disease acquisition, needle exchange programs and/or treatment interventions could be implemented in a targeted fashion to interrupt ongoing disease transmission.

