1. Introduction
Cirrhosis is recognized by reduction in hepatocyte proliferation with an increase in fibrous tissue, which may ultimately lead to the development of cancerous nodules (1). Hepatitis C virus (HCV) infection is one of the causes of cirrhosis and one of the most serious global health problems that is growing worldwide (2). Studying cirrhosis is imperative because of (i) its high mortality rate worldwide, resulting in 1.2 million deaths in 2013 (3) and a 10-year mortality rate of 34% to 66%, depending on the cirrhosis (4); and (ii) approximately 70% to 90% of patients with hepatocellular carcinoma (HCC) have an established background of chronic liver disease and cirrhosis (5). Data from studies have suggested a paradigm for the pathogenesis of cirrhosis involving alterations of oxidative stress that provoke the inflammatory and apoptotic reactions in the generation of cirrhosis (6). Unfortunately, these biomarkers are not liver specific and still require extensive validation. In fact, liver biopsy, as an invasive method, is still the gold standard for confirming liver fibrosis stages (7), moreover, there are not any nonreversible and specific therapeutic methods to treat advanced cirrhosis (8). On the other hand, treating patients with decompensated cirrhosis is complex, and most of them would need liver transplantation to survive longer (9). One of the reasons for therapeutic failure may be the ambiguity and complexity of molecular mechanisms that cause liver disorder, making it irreversible (10). Several techniques have been developed to survey molecular alteration to clarify the pathogenesis of diseases (11). One of the powerful tools in biomarker discovery is metabolomics that can illuminate the underlying biology and discover clinical markers of diseases using bioinformatics pathway analysis (12). In recent years, some metabolomics studies in biomarker discovery have been reported on various diseases by our group (13-16). In the present study, we used the NMR method of investigation and the serum metabolic profile of HCV-cirrhotic patients with decompensated stage to find new markers in the serum of patients; this may be helpful in further understanding the nature of long-term effects of HCV virus. These findings may improve patient care and find suitable therapies.
2. Methods
2.1. Patients and Collection of Serum Samples
The sample collection of decompensated HCV-cirrhosis was conducted in gastroenterology and liver diseases research center of Taleghani and Loghman Hakim hospitals affiliated to Shahid Beheshti University of Medical Sciences. In total, 21 decompensated HCV-cirrhosis blood samples were obtained preoperatively from November 2014 to July 2015. Control blood samples were obtained from 18 healthy volunteers without no history and current diseases, a habit of alcohol consumption, or smoking. Decompensated cirrhosis was defined as the presence of the following 5 criteria: hypoalbuminemia, hyperbilirubinemia, ascites, peripheral edema of noncardiac, or renal origin (17) and were evaluated according to clinical examinations. The baseline clinical characteristics of the cirrhotic patients and controls are summarized in Table 1. All patients were positive for hepatitis C antigen for anti- HCV antibody and HCV RNA RT- PCR. The severity of liver disease was calculated according to the model for end stage liver disease (18). Patients with the past or current hepatocellular carcinoma, NAFLD, NASH, alcoholic, diabetes, cardiovascular disease, and kidney disease, or any other viral infection, hepatitis delta, or hepatitis B virus were excluded from the present study.
| Parameters | Control | Decompensated HCV-Cirrhosis |
|---|---|---|
| Age, y | 50 ± 2.0 | 56 ± 1.2 |
| Gender | ||
| Male | 14 | 17 |
| Female | 4 | 4 |
| ALT, U/L | 29.5 ± 4 | 81.4 ± 12.5 |
| AST, U/L | 23.1 ± 11.6 | 137.8 ± 53.9 |
| Total bilirubin, µmol/L | 16.9 ± 3.5 | 46.1 ± 10.7 |
| ALB, g/L | 45.8 ± 11.2 | 30 ± 15.7 |
| INR | 1.0 ± 0.08 | 1.4 ± 0.1 |
| TP, g/L | 69 ± 9.6 | 58 ± 4.5 |
| MELD score | - | 14.5 ± 6.5 |
Abbreviations: ALB, albumin; ALT, alanine aminotransferase; AST, aspartate aminotransferase; INR, international normalized ratio; MELD, Model for end stage liver disease; TP, total protein.
aValues are expressed as mean ± standard deviation.
The amount of blood collected was 5ml for each sample. All samples were incubated for 30 minutes at room temperature and centrifuged at 2000 g for 10 minutes at 25°C. The golden yellow supernatant was collected and stored in aliquots at -80°C until NMR experiments. The protocols of this study were approved by the ethics committee of Shahid Beheshti University of Medical Sciences (SBMU).
2.2. 1H NMR Acquisition and Data Processing
For NMR analysis, serum samples were left to thaw; 600 μL serum samples were each diluted by 100 μL D2O (deuterium oxide, 99.9% D, Aldrich Chemicals Company) to provide a field frequency lock. The experimental data consisted of 39 serum samples including 21 samples from decompensated HCV-cirrhosis patients and 18 from healthy controls. The NMR spectra were acquired using a Bruker Avance DRX 600 spectrometer, operating at 500 MHz at 300 K using the Carr-Purcell-Meiboom-Gill (CPMG) spin echo sequence to facilitate the detection of low molecular weight species (19). 1H-NMR spectra in the region of d 0.2 - 10 were subdivided into integrated regions of 0.02 ppm width, then, data were normalized and aligned using the ProMetab software (ProMetab- Version 3) (20) in MATLAB (Version 6.5.1, The MathWorks, Cambridge, UK). The spectra between 4.2 and 5.5 ppm containing residual water were removed from data.
2.3. NMR Statistical Analysis
SIMCA (SIMCA 14.0, Umetrics, Ume, Sweden) and SPSS 16.0 (SPSS, Inc., Chicago, IL) were used for all analysis. Multivariate statistics including unsupervised PCA and supervised OPLS-DA were performed. Analysis of the metabolite signals in the 1H NMR serum profiles was first conducted using unsupervised PCA to decrease the dimensionality of data. After an initial overview of the PCA analysis, we obtained the specific discriminant information between the 2 groups by OPLS-DA model (21, 22). Models were tested by 10-fold cross validation using R2 and Q2 parameters, where R2 provides a measure for how much variation is represented by the model and Q2 for the goodness of prediction. The area under the curve (AUC) represented the discriminatory ability of this metabolite as a potential biomarker, with values close to 1 implying a better classification. A significant metabolite was considered according to fold change ≥ 1.5.
2.4. Pathway Analysis
Analysis of metabolic pathways was conducted by MetaboAnalyst 3.0 (www.metaboanalystca/). To identify the most relevant pathways, p-values and false discovery rate (FDR) parameters less than 0.05 were considered.
3. Results
3.1. Discrimination Between Decompensated HCV-Cirrhosis and Healthy Controls by NMR-Based Metabolic Profiling
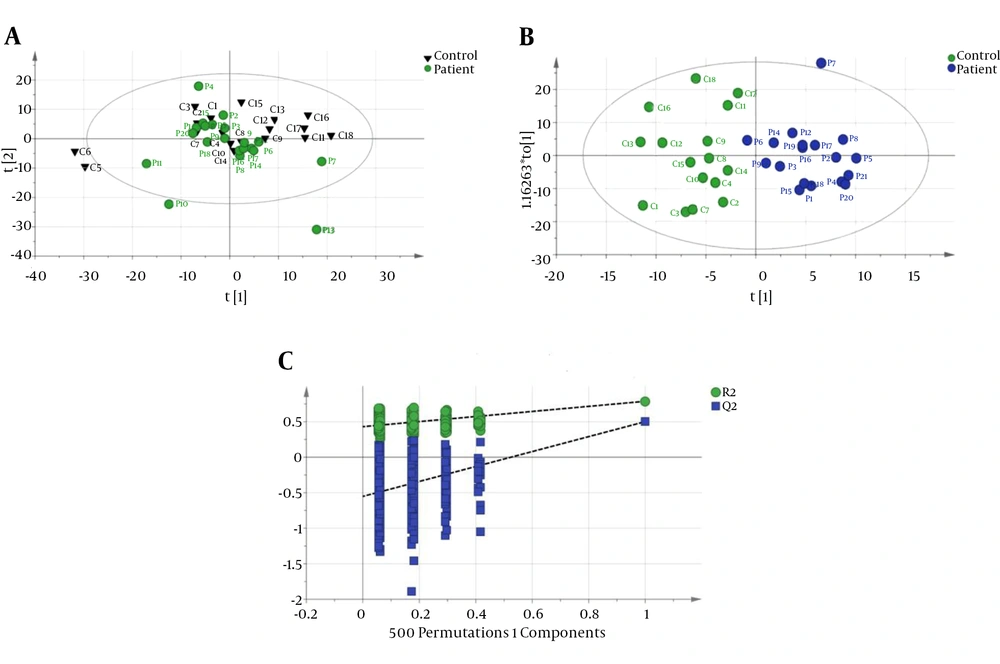
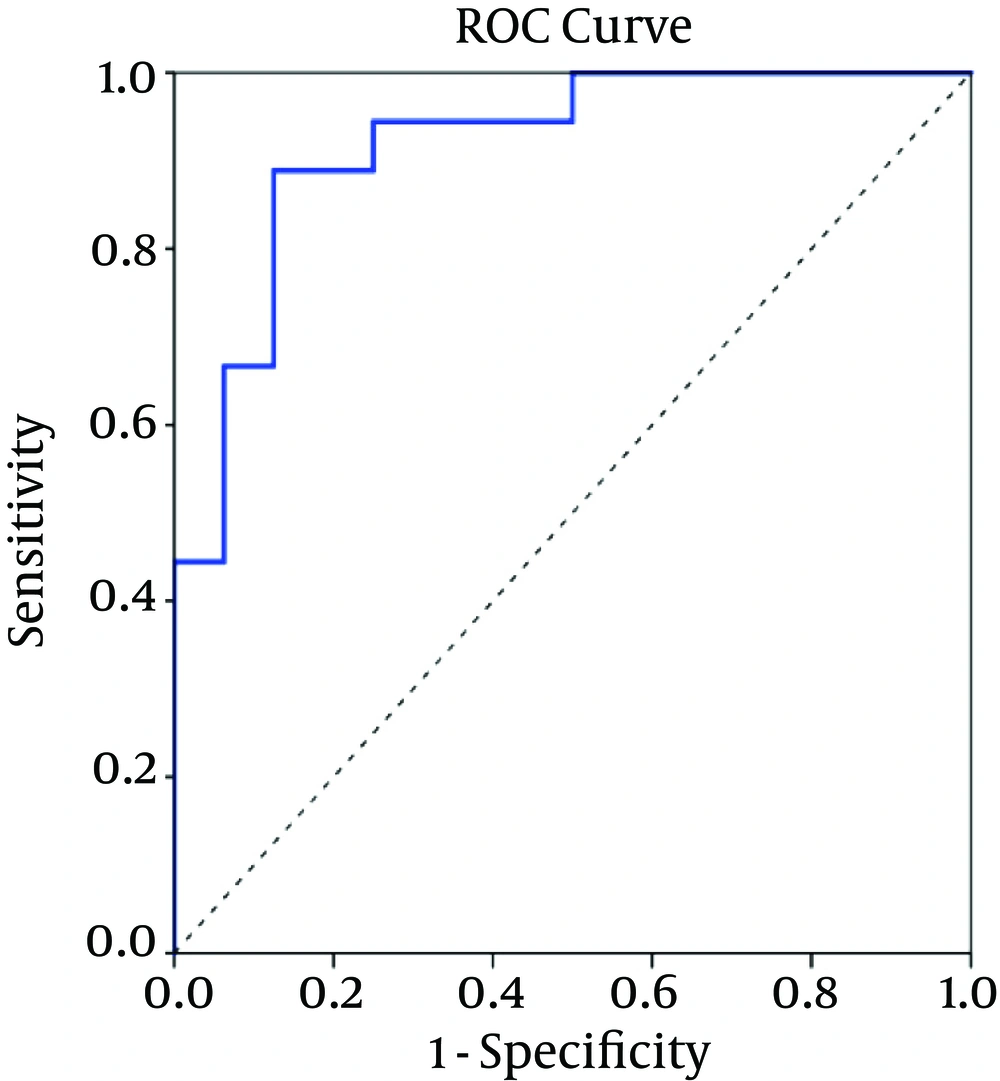
The CPMG spectrum of the serum sample from decompensated HCV-cirrhosis identified 16 different metabolites based on their chemical shifts through an online database (http://hmdb.ca) and previous literatures. At first, the serum metabolic profiles were analyzed using unsupervised PCA. According to the established PCA models, 4 serum samples were obtained from decompensated HCV-cirrhosis and found to be outliers and were removed (In In the obtained result, one serum sample from the mentioned group was determined to be an outlier and consequently removed for further investigation (data not shown). Figure 1A displays the PCA score plots of decompensated HCV-cirrhotic patients and healthy controls, with an R2X = 0.801 and a Q2 = 0.575. The PCA was followed by OPLS-DA, which focused more on discriminatory variations. Then, to better understand the different metabolic patterns and to detect potential biomarkers between the 2 groups, we conducted OPLS-DA. The OPLS-DA score plots revealed that the decompensated HCV-cirrhosis were statistically distinguishable from healthy controls (R2X = 0.78, R2Y = 0.52 and Q2 = 0.5) (Figure 1B). Furthermore, a permutation test was used to validate this model. The values of R2 and Q2 values derived from the permutation test were lower than the original ones, indicating the validation of the OPLS-DA model Figure 1C. Moreover, ROC curve was plotted based on the predicted response values and its corresponding AUC was 0.91 (Figure 2). The area under the curve (AUC) represented the discriminatory ability of this metabolite as a potential biomarker, with values close to 1 implying a better classification.
A, PCA score plot with all variable unit variance scaled (healthy has been shown with triangle shape and circle with decompensated HCV-cirrhosis.); B, OPLS-DA Score plot of dcompensated HCV-cirrhosis group versus healthy control; (blue circle, patient, green circle, healthy); C, A 200 permutation test for OPLS-DA model healthy controls.
Compared with healthy controls, a number of metabolites showed increased concentration in serum of decompensated HCV-cirrhosis such as succinic acid, isovaleraldehyde, propanal, cinnamaldehyde, and citrulline, while several others were observed in decreased levels in the decompensated HCV-cirrhosis such as valine, glutamine, trimethylamine, lactate, proline, aspartate, lipid, VLDL, isoleucine, fucose, and glutamate (Table 2).
| No. | Metabolites | Direction of Variationa | δ1H, p.p.m.b | Fold Change |
|---|---|---|---|---|
| 1 | Valine | ↓ | 0.99, 3.6 | 1.5 |
| 2 | Gutamine | ↓ | 2.09 | 1.5 |
| 3 | Trimethylamine | ↓ | 2.83 | 1.5 |
| 4 | Lactate | ↓ | 1.33 | 1.6 |
| 5 | Proline | ↓ | 2.05, 3.33 | 1.7 |
| 6 | Aspartate | ↓ | 2.81 | 1.8 |
| 7 | Citrulline | ↑ | 1.57 | 2.3 |
| 8 | Lipid | ↓ | 2.23, 0.93 | 2.1 |
| 9 | VLDL | ↓ | 1.57, 1.29 | 2.3 |
| 10 | Isoleucine | ↓ | 0.93 | 2.4 |
| 11 | Fucose | ↓ | 1.31 | 2.5 |
| 12 | Glutamate | ↓ | 2.03 | 1.5 |
| 13 | Iso- Valeraldehyde | ↑ | 0.95, 2.39, 9.65 | 2.2 |
| 14 | Propanal | ↑ | 2.55, 9.69 | 1.8 |
| 15 | Cinnamaldehyde | ↑ | 9.66, 9.67 | 1.9 |
| 16 | Succinic acid | ↑ | 2.39 | 1.9 |
aIncrease or decrease in decompensated HCV-cirrhosis compared to healthy controls.
bChemical shift of signal used for quantification.
3.2. Pathway Analyses
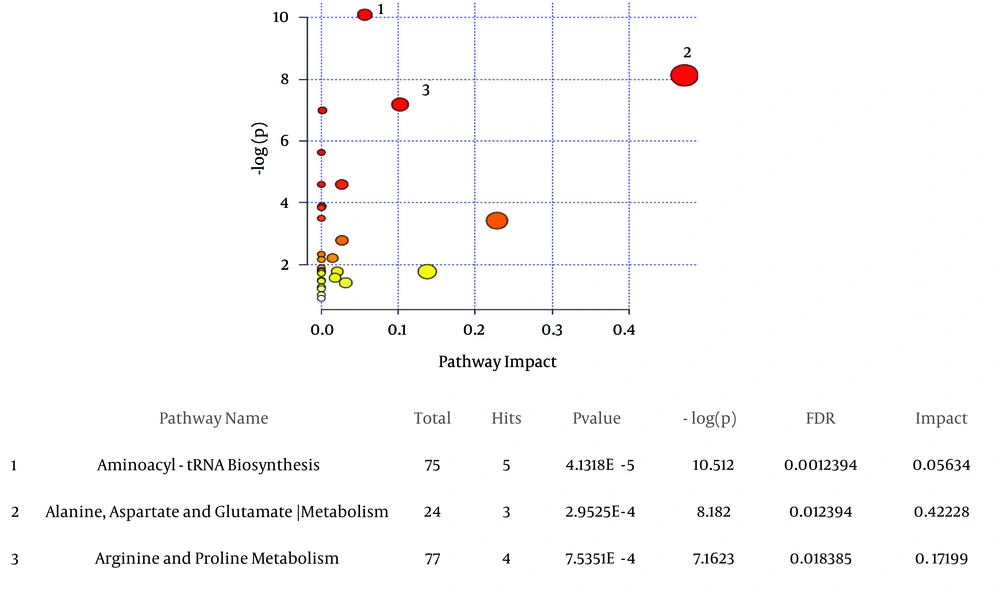
The most significant altered metabolic processes between decompensated HCV-cirrhosis and healthy controls, based on metaboanalyte 3.0, were Aminoacyl-tRNA biosynthesis, Arginine and proline metabolism, alanine, and aspartate and glutamate metabolism (Figure 3).
A, the metabolic pathways are represented as circles according to their scores from enrichment (vertical axis, shade of red) and topology analyses (Pathway impact, horizontal axis, and circle diameter). MetaboAnalyst 3.0 showed Aminoacyl-tRNA biosynthesis, alanine, aspartate and glutamate metabolism, arginine and proline metabolism as significant related pathways; B, statistics for pathways with major changes based on the P value and FDR (P value < 0.05 and FDR < 0.05).
4. Discussion
4.1. Determining Metabolic Changes According to 1H NMR Spectra
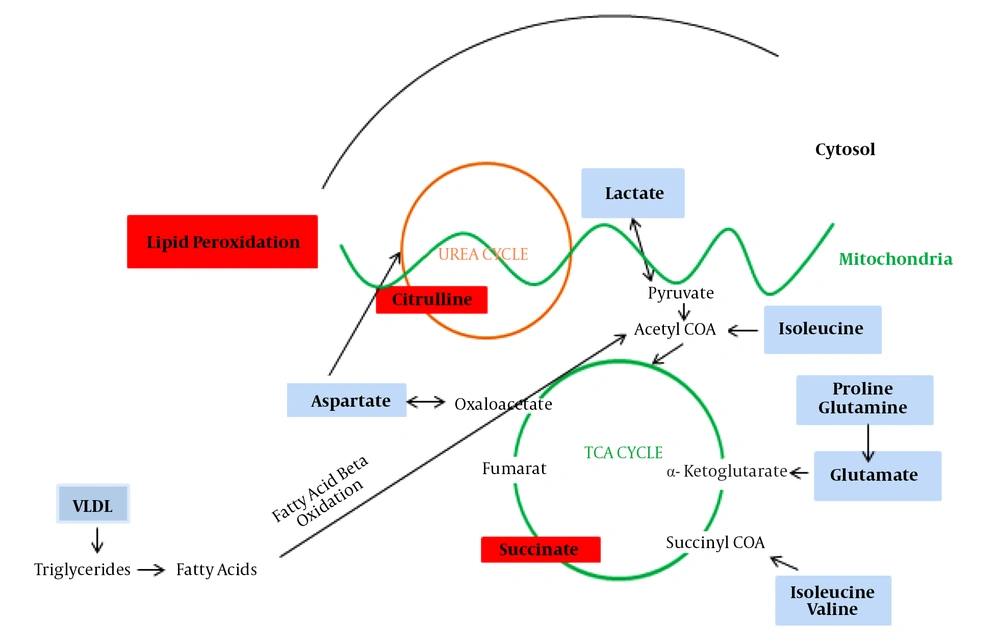
The present data allowed us to draw several conclusions. First, it evaluated whether a metabolomics approach by 1H NMR can discriminate between healthy and advanced cirrhosis patients suffering from HCV. Second, it seems that changes in serum metabolomics profiles reflect activation or impairment in several biologic pathways, mainly energetic metabolism. The alteration metabolites are lipid, branched-chain amino acids (Valine, Isoleucine), acidic amino acids (Glutamate, Aspartate), aliphatic amino acids (Proline), aldehydes (valeraldehyde, propanal, cinnamaldehyde), dicarboxylic acid (succinic acid), choline-associated metabolites (trimethylamine (TMA)), sugar (fucose), lipoproteins (VLDL), and alpha-hydroxy acid (lactate). Figure 4 illustrates the significant changed metabolites in decompensated HCV-cirrhosis sera versus healthy controls and their association with other molecules in the cell.
4.2. Mitochondrial Pathways
Disorder of amino acid metabolism are found in some liver diseases at the metabolomics level (23-25). We defined decreased amounts of valine and isoleucine, glutamine, and glutamate in sera of decompensated HCV-cirrhosis compared to healthy controls. These amino acids are related to intermediate components of TCA cycle, an essential pathway for the amino acids metabolism (26, 27). Our results are consistent with those of the previous studies on cirrhosis and liver diseases (28, 29). The results of amino acid imbalance on TCA cycle in the serum of patients with advanced cirrhosis can prove the hypothesis of impairment of TCA cycle (30). In addition, decreased levels of glutamine may reflect elevation of hepatic dysfunction and destruction of hepatocytes because glutamine is metabolically linked to the ammonium detoxification in the body by the hepatocytes (31). Succinate, an intermediate in the citric acid cycle, increased in decompensated HCV- cirrhosis serum versus healthy controls in our study, which may be caused by the reduced utilization of succinate into the TCA cycle due to impairment of this important cycle.
Moreover, we found energy abnormalities including elevated mitochondrial lipid peroxidation in decompensated HCV-cirrhosis. The increase in serum aldehydes (isovaleraldehyde and propanal) and the decrease in serum lipid demonstrated more activation of lipid peroxidation. The intermediate products of lipid peroxidation are reactive aldehydes beside the free radicals (32). The present study demonstrated that lipid peroxidation may increase in decompensated HCV-cirrhosis and suggested that oxidant stress might contribute to the deterioration of liver in advanced liver diseases, which is compatible with Pratico D et al. results (32). The previous study, which reported an increase in isovaleraldehyde in hepatic encephalopathy (33), could confirm the above hypothesis.
4.3. Cytosolic - Mitochondria Pathway
An increased level of citrulline was shown in decompensated HCV-cirrhosis. Citrulline is a non-essential amino acid, produced from carbamoyl phosphate and ornithine by ornithine transcarbamoylase, and has a main role in the urea cycle. Our hypothesis was that the destruction of urea cycle and reduction of aspartate level are responsible for the increased level of citrulline in decompensated HCV-cirrhosis. Accumulation of ammonia in the cirrhotic patients can be another reason for confirming our hypostasis in impairment of the urea cycle. Urea cycle is a metabolic pathway that removes ammonia by converting it to the neutral substance urea (34, 35), and its disorder function can lead to liver encephalopathy (35). Impairment of urea cycle and increase in citrulline level emphasize the previous results that showed significant reductions in activation of most of the urea cycle enzymes in patients with cirrhosis (36).
4.4. Cytosolic Pathway
Lactate level was lower in the sera of patients with advanced HCV-cirrhosis versus healthy controls. Consumption of alternate fuels in cirrhosis patients has been attributed to reduced availability of hepatic glycogen (37). In neo-gluconeogenesis, transformation of lactate into glucose occurs to meet the body's energy needs. Decreased level of lactate in the sera in our study seems to confirm the more activity of this important energetic pathway in patients with advanced cirrhotic, which was previously stated by Bugianesi et al. (37). It can be hypothesized that the ratio of gluconeogenesis to glycolysis may elevate in HCV-decompensated cirrhosis, which causes reduction in serum lactate. In the present study, proline decreased in advanced HCV-cirrhosis sera compared with healthy controls. Proline is one of the most consumed amino acids to form the collagen molecule (38). The collagen content at the liver cirrhosis was more than five-fold higher than the normal state (39) due to elevation of Type I collagen gene transcription (40). The decrease in proline level in patients’ sera can be explained by the high consumption of proline in more collagen biosynthesis in liver cirrhosis. Results in HCC by Chan W (41) and evaluations of patients with liver cirrhotic ascites by Yang T showed decreased in proline (42). Our study showed that the levels of VLDL were reduced in the decompensated LC group compared to healthy controls. Thus, it can be hypothesized that the blood lipid level decreases in the serum of decompensated LC patients because the liver tissue loses some degree of its lipid synthesizing ability in the later stage of cirrhosis (43).
The present study has focused on metabolomics profile of advanced cirrhosis based on HCV to introduce biomarker(s) for better treatment of patients. In future studies, metabolomics can be used to compare the compensated and decompensated cirrhosis based on HCV to achieve the best opportunity for therapy.
4.5. Conclusions
Metabolomic profiling through NMR can identify the metabolic disturbances in advanced HCV-cirrhosis. Aberrant amino acid biosynthesis may be a hallmark with an increase in the severity of cirrhosis as well as alterations in energetic metabolism. Moreover, differently changed metabolites may serve as biomarkers that can be used to monitor the changes in patients with decompensated HCV- cirrhosis.


