


1. Background
Nonalcoholic fatty liver disease (NAFLD), now referred to as metabolic dysfunction-associated steatotic liver disease (MASLD), is a prevalent chronic liver condition that is not linked to alcohol abuse or viral infections (1). A recent systematic review revealed that approximately 30% of the global population is affected by NAFLD, with its prevalence on the rise (2). The progression of NAFLD to nonalcoholic steatohepatitis (NASH) is associated with a poor long-term prognosis, as the annual incidence of hepatocellular carcinoma is about 12 times higher in patients with NASH compared to those with simple fatty liver (3). Importantly, there are currently no clinically approved medications specifically designed for the treatment of NAFLD (4). Nevertheless, certain phytochemicals exhibit promising therapeutic effects on various signaling pathways related to lipid metabolism, oxidative stress, and inflammatory responses (5, 6).
Inflammation serves as a crucial initial step that can lead to severe liver damage in NAFLD. While hepatitis occurs in the context of metabolic changes, it is characterized by pronounced immune-inflammatory properties (7). The regulation of chronic inflammation is significantly influenced by adaptive immunity, particularly mechanisms involving CD4+ T cells (8). Rau et al. reported that the progression from simple steatosis to NASH is marked by an increased frequency of IL-17⁺ cells among intrahepatic CD4⁺ T cells, along with elevated Th17/Treg ratios in peripheral blood (9). Th17 cells, recognized for their proinflammatory effects, primarily secrete interleukin (IL)-17, while Treg cells help modulate IL-17 levels by secreting the anti-inflammatory factor IL-10 (10). The dynamic balance between Th17 and Treg cells is crucial for maintaining immune homeostasis. Any disruption in this balance can lead to pro-inflammatory immune responses, particularly in chronic inflammatory diseases (11).
In the study conducted by Duan et al. on Dahuang Zhechong pills, it was found that the immune function in NAFLD patients can be modulated by preserving the balance between Th17 and Treg cells, which in turn influences the levels of inflammatory cytokines and adipocytokines (12). Therefore, investigating the balance of Th17 and Treg cells as a marker of inflammation in NAFLD may provide critical insights for preventing the progression from simple fatty liver disease to NASH. The nucleotide-binding oligomerization domain-like receptor protein 3 (NLRP3) inflammasome also plays a critical role in the progression of NASH, as demonstrated by various studies (13). Upon activation, NLRP3 triggers the activation of caspase-1 and cleaves gasdermin D (GSDMD), resulting in the secretion of IL-1β and IL-18, ultimately inducing pyroptosis and initiating an inflammatory cascade (14). Furthermore, the activation of the NLRP3 inflammasome may inhibit the expression of Foxp3, a critical marker of Treg cells, thereby disrupting the balance between Th17 and Treg cells (15). Inhibition of NLRP3 using its specific inhibitor, MCC950, has been demonstrated to reduce the Th17/Treg cell ratio, resulting in an improved inflammatory response (16).
Silymarin, a flavonoid mixture derived from the seeds of Silybum marianum, contains silibinin as its primary hepatoprotective compound. Numerous studies have demonstrated the efficacy of silibinin in reducing inflammation and improving NASH (17, 18). Additionally, several traditional Chinese medicines (TCMs) are recognized for their potential to help control the progression of NAFLD. Kudzu root, the dried root of P. lobata, contains puerarin, which may inhibit liver lipid accumulation and regulate inflammatory factors to protect the liver (19). Salvia miltiorrhiza, a plant belonging to the Labiatae family, is commonly utilized in TCM. Its active components, known as tanshinones, exhibit anti-inflammatory, antinecrotic, and antifibrotic properties, and can promote hepatocyte regeneration (20). Schisandra chinensis, the dried mature fruit of the Magnoliaceae, is rich in lignans and polysaccharides that may improve liver fibrosis by inhibiting the inflammatory response (21).
2. Objectives
Currently, there are few reports on the combined use of silymarin with P. lobata, S. miltiorrhiza, and S. chinensis for improving dyslipidemia, liver damage, and immunoregulatory and inflammatory responses in NAFLD patients. We recruited patients with NAFLD for a randomized controlled clinical trial, focusing on the effects of silymarin combined with TCM, as well as silymarin alone, on liver aminotransferases, lipid profiles, the Th17/Treg cell ratio, and the expression of NLRP3 inflammasome-related genes in peripheral blood mononuclear cells (PBMCs) from these patients.
3. Methods
3.1. Trial Design
This study was designed as a single-center, randomized, double-blind, placebo-controlled, parallel-group trial. Approval for the study protocol was obtained from the Ethics Committee of the First Dongguan Affiliated Hospital of Guangdong Medical University and was conducted in accordance with the guidelines established by the 1975 Declaration of Helsinki. The study has been registered with ClinicalTrials.gov (NCT05497765) as well as the National Medical Research Management System (MR-44-22-016865). Statisticians performed randomization using computer-generated lists. Patients with NAFLD recruited by outpatient physicians were randomized in a 1:1:1 ratio and assigned to receive either silymarin + TCM, silymarin alone, or a placebo for 12 weeks, administered in the form of tablets. The tablets were indistinguishable in appearance and were differentiated by a code marked on bottles, which had the same appearance. A baseline assessment was conducted, followed by a follow-up assessment after 12 weeks. Both participants and researchers were blinded to the group assignments.
3.2. Participants
The study was performed at the First Dongguan Affiliated Hospital of Guangdong Medical University (Guangdong province, China). Participants were recruited based on the following inclusion criteria: Adults (aged 18 - 65, 22 kg/m2 ≤ Body Mass Index (BMI) ≤ 33 kg/m2) diagnosed with NAFLD based on the Chinese guidelines, utilizing clinical examinations, laboratory tests, and ultrasound evaluations (22). The exclusion criteria were as follows: Alcohol abuse (≥ 30 grams of alcohol/day for males and ≥ 20 grams of alcohol/day for females); patients with certain hepatic diseases such as hepatitis B, hepatitis C, autoimmune hepatitis, and hepatolenticular degeneration, which can lead to fatty liver disease; taking medicines or supplements that would influence liver function or lipid metabolism; patients with total parenteral nutrition, inflammatory bowel disease, celiac disease, hypothyroidism, Cushing syndrome, Mauriac syndrome, etc.; patients with hereditary diseases, coronary heart disease, mental disorder, cancer, cirrhosis, and renal disease; body weight change of more than 10% in the previous 3 months; patients who have participated in or are participating in other clinical trials within 3 months of their first administration of the study product; subjects allergic to the ingredients in the test or control samples; women who are pregnant or breastfeeding; and subjects who cannot meet the requirements of compliance in the pre-experiment period. Before the study commenced, all patients provided written informed consent prior to the initiation of any study procedures.
3.3. Interventions
The test objects were supplied by BYHEALTH Co., Ltd. (Guangdong province, China). The active ingredients in each tablet of silymarin + TCM were 20.4 mg of silibinin, a mixed powder of P. lobata, S. miltiorrhiza, and S. chinensis. Each tablet of silymarin contained 20.4 mg of silibinin, and the main composition of the placebo was corn dextrin. Over 12 weeks of the intervention period, the patients received 4 tablets of test objects or placebo twice a day. Compliance and any adverse events were assessed during the follow-up period. After providing informed consent, the patients were instructed to follow a lifestyle-change diet and a standardized mild physical training regimen, in accordance with the Chinese dietary guidelines, under the guidance of a dietitian. By recording the diet for 3 consecutive days, the average daily energy was calculated. The amount of exercise in a week was investigated via the International Physical Activity Questionnaire (IPAQ).
3.4. Data Collection
3.4.1. Demographic and Clinical Profile and Anthropometric Assessment
Data were collected at baseline and again after 12 weeks on various factors, including sex, age, weight, waist circumference, hip circumference, blood pressure, renal function, enzymatic liver markers, glucose metabolism markers, lipid profiles, medication use, and lifestyle habits (diet, physical activity, smoking, and alcohol consumption). All biomarkers were assessed at the hospital’s clinical laboratory following a 12-hour fasting period. The reference ranges for the tests are provided in Appendix 1 in the Supplementary File.
3.4.2. Blood Sampling and Cell Separation
The PBMCs were isolated from blood samples (5 mL) with heparin sodium or sodium citrate by adding Ficoll (TBD Science and Technology Co., Ltd. Tianjin, China) and centrifuging at 400 × g for 25 min. The isolated cells were subjected to flow cytometry and RNA extraction.
3.4.3. ELISA for Circulating Cytokines
Serum levels of IL-10 and IL-18 were measured using IL-10 Human Uncoated ELISA Kits (eBioscience; San Diego, CA) and Human IL-18 ELISA Kits (ExCell Bio; Shanghai, China), respectively.
3.4.4. Flow Cytometry
The quantification of Th17 and Treg cells detected by flow cytometry was performed according to the experimental protocol of Zheng et al. (23). CD4+ IL-17A+ Th17 cells were incubated with FITC-conjugated anti-human CD4 (eBioscience) following a 5-hour stimulation with a PMA/ionomycin/BFA/monensin mixture (MULTISCIENCES; Hangzhou, Zhejiang province, China). After permeabilizing the cell membrane using a Fix & Perm kit (MULTISCIENCES), the cells were stained with PE-conjugated anti-human IL-17A (eBioscience). To detect CD4+CD25+CD127low Treg cells, samples were incubated with FITC‐conjugated anti‐human CD4, APC-conjugated anti‐human CD25 (eBioscience), and PE‐conjugated anti‐human CD127 (eBioscience). The cells were then analyzed using a FACSCalibur flow cytometer and FlowJo software (Becton Dickinson, Mountain View, CA).
3.4.5. Quantitative Real-time PCR Analysis
Samples were prepared using TB Green® Premix Ex Taq™ II (Takara Biotechnology, Dalian, China), followed by quantitative real-time PCR conducted on a TIANLONG Gentier 96R instrument (TIANLONG Scientific, Xi’an, China). Gene expression was quantified by normalizing mRNA levels to GAPDH, and data analysis was conducted using the 2-△△CT method. Primer nucleotide sequences are in Appendix 2 in the Supplementary File.
3.4.6. Outcomes
The primary outcomes included liver enzyme markers, lipid profiles, and serum IL-10 and IL-18 levels assessed at baseline and the end of treatment. Secondary outcomes included the proportions of Th17 and Treg cells in peripheral blood and the expression of NLRP3 inflammasome-related genes in PBMCs.
3.4.7. Sample Size
Sample size estimation was performed using PASS 15.0 software (NCSS Inc., Kaysville, UT). The effect size was derived from the study by Solhi et al. (24), which reported a post-treatment reduction in serum ALT levels of 52.9 ± 18.5 U/L in the silymarin group, compared to 32.3 ± 27.2 U/L in the placebo group. The calculation assumed a significance level of 0.05 and a power of 90%. Additionally, accounting for a potential follow-up loss of 10%, a total of 29 patients per group were needed.
3.4.8. Statistical Analysis
The data were analyzed statistically using SPSS version 27.0 (SPSS Inc., Chicago, IL). All randomized participants were included in the intention-to-treat (ITT) set. Missing values were addressed using multiple imputation. The normality of the data was assessed using the Shapiro-Wilk test. Continuous variables are presented as the means ± standard deviations (SDs) or medians with interquartile ranges (IQRs), depending on their distributions, while categorical variables are expressed as frequencies. The change rate was calculated by taking the difference in the measured parameters from the end of the trial to baseline, relative to the baseline values. For continuous variables with a normal distribution and homogeneous variances, one-way ANOVA and Bonferroni multiple comparisons were employed for intergroup comparisons. The Kruskal-Wallis test was employed for intergroup comparisons of variables that did not follow a normal distribution. If significant differences were identified, the Bonferroni method was applied to adjust the α value for multiple comparisons. The chi-square test was utilized to compare categorical variables between groups. Statistical significance was determined at P < 0.05.
4. Results
4.1. Study Population and Baseline
Recruitment commenced on November 25, 2022, with the first participant identified on December 11, and concluded with the final visit on January 22, 2023. A total of 129 subjects were screened for eligibility, resulting in the enrollment of 94 participants (71 males and 23 females). These participants were randomly assigned to one of three groups: The silymarin + TCM group (n = 32), the silymarin group (n = 31), and the placebo group (n = 31). Throughout the study, 18 participants (19.15%) were lost to follow-up for various reasons. Only one participant in the placebo group reported experiencing diarrhea, while no adverse symptoms were reported by participants in the treatment groups. The experiment was completed by 29, 24, and 23 subjects in the three groups, respectively (Figure 1). Furthermore, the study demonstrated that participants exhibited high treatment compliance, exceeding 80%, as confirmed by the recovery of containers and tablet counts. There were no significant differences in the baseline characteristics of the 94 participants who received different interventions across the three groups, as detailed in Appendix 3 in the Supplementary File.
.")
CONSORT flow diagram of patients with NAFLD with silymarin + TCM, silymarin or placebo for 12 weeks. (Abbreviations: ITT, intention-to-treat; NAFLD, nonalcoholic fatty liver disease; TCM, traditional Chinese medicine).
4.2. Primary Outcomes
The rate of decrease in serum IL-18 concentration in the silymarin + TCM group was significantly more pronounced than that in the placebo group. Conversely, no significant differences were observed in physical measurements, liver enzyme markers, glucose and lipid metabolism markers, total bile acids, or IL-10 among the three groups (Table 1). The subjects’ physical activity and dietary energy intake (data not shown) remained consistent throughout the follow-up period.
| Variables | Silymarin + TCM (n = 32) | Silymarin (n = 31) | Placebo (n = 31) | Test Statistics | P-Value |
|---|---|---|---|---|---|
| BMI (kg/m2) | 26.50 (25.44, 28.47) | 26.40 (24.50, 29.40) | 27.14 (25.10, 28.50) | 0.24 | 0.88 b |
| Change rate (%) | -0.71 (-3.04, 1.58) | -1.09 (-3.08, 2.96) | 0.35 (-2.17, 2.60) | 0.96 | 0.62 b |
| Waist circumference (cm) | 92.50 (87.50, 95.00) | 90.60 (86.00, 97.00) | 94.24 (90.00, 100.00) | 3.31 | 0.19 b |
| Change rate (%) | -5.07 ± 7.01 | -3.08 ± 6.66 | -2.47 ± 5.29 | 1.44 | 0.24 c |
| Hip circumference (cm) | 99.50 (97.00, 102.82) | 100.00 (97.00, 102.68) | 100.78 (97.00, 102.00) | 0.38 | 0.83 b |
| Change rate (%) | -2.85 (-6.59, 1.04) | -1.01 (-4.76, 2.13) | -1.77 (-3.57, 2.06) | 2.42 | 0.30 b |
| WHR | 0.92 ± 0.07 | 0.92 ± 0.05 | 0.94 ± 0.05 | 1.13 | 0.33 c |
| Change rate (%) | -2.43 ± 6.31 | -2.18 ± 5.00 | -1.59 ± 5.12 | 0.19 | 0.83 c |
| AST (U/L) | 25.35 (19.40, 29.33) | 27.00 (21.60, 31.73) | 29.93 (22.00, 32.42) | 2.61 | 0.27 b |
| Change rate (%) | 3.23 (-15.10, 22.93) | 7.98 (-6.74, 39.31) | 13.28 (-6.38, 39.88) | 1.49 | 0.47 b |
| ALT (U/L) | 32.10 (21.15, 45.35) | 41.50 (20.60, 47.04) | 38.20 (21.60, 46.60) | 1.36 | 0.50 b |
| Change rate (%) | -3.22 (-31.22, 23.33) | 2.35 (-25.92, 53.73) | 11.83 (-13.51, 46.57) | 2.12 | 0.35 b |
| ALP (U/L) | 73.30 (54.47, 82.55) | 72.76 (61.00, 80.00) | 74.60 (70.20, 94.00) | 4.45 | 0.11 b |
| Change rate (%) | -3.70 (-15.69, 7.50) | -1.22 (-13.88, 5.17) | -0.53 (-9.72, 8.01) | 0.59 | 0.74 b |
| GGT (U/L) | 34.00 (20.00, 54.15) | 46.00 (26.00, 60.00) | 47.96 (23.00, 56.00) | 1.99 | 0.37 b |
| Change rate (%) | -3.31 (-27.27, 17.56) | -5.22 (-21.17, 34.48) | 0.00 (-12.39, 28.57) | 3.01 | 0.22 b |
| AST/ALT | 0.80 (0.63, 1.04) | 0.69 (0.59, 1.06) | 0.81 (0.66, 0.97) | 0.52 | 0.77 b |
| Change rate (%) | 12.22 (-6.27, 35.55) | 5.20 (-9.49, 19.71) | 5.24 (-20.00, 30.96) | 3.01 | 0.22 b |
| Fasting insulin (pmol/L) | 122.15 (76.46, 146.35) | 118.47 (74.18, 139.80) | 119.00 (79.56, 126.90) | 0.52 | 0.77 b |
| Change rate (%) | 5.98 (-26.67, 44.35) | 22.16 (-12.87, 97.99) | 11.56 (-28.52, 35.98) | 2.48 | 0.29 b |
| Fasting blood glucose (mmol/L) | 5.48 (5.32, 6.41) | 5.55 (5.09, 6.06) | 5.65 (5.37, 5.88) | 1.08 | 0.58 b |
| Change rate (%) | 4.36 (-2.57, 12.68) | 2.7 (-1.56, 8.73) | 4.32 (-0.98, 9.92) | 0.79 | 0.67 b |
| HOMA2 IR | 2.34 (1.44, 2.74) | 2.28 (1.37, 2.68) | 2.27 (1.52, 2.43) | 0.76 | 0.68 b |
| Change rate (%) | 4.51 (-26.71, 42.41) | 22.48 (-20.40, 99.47) | 11.21 (-27.08, 36.38) | 2.32 | 0.31 b |
| Total bile acid (μmol/L) | 4.61 (2.50, 6.90) | 3.63 (2.60, 4.93) | 4.15 (2.10, 4.80) | 1.64 | 0.44 b |
| Change rate (%) | 10.46 (-11.78, 69.82) | 35.65 (-25.00, 105.00) | 22.51 (-27.36, 84.43) | 0.69 | 0.71 b |
| TG (mmol/L) | 1.76 (1.29, 2.77) | 2.09 (1.43, 3.34) | 2.11 (1.17, 2.96) | 0.78 | 0.68 b |
| Change rate (%) | -11.94 (-35.75, 11.03) | -10.06 (-25.61, 19.42) | 1.39 (-25.24, 37.40) | 2.43 | 0.30 b |
| TC (mmol/L) | 5.01 ± 0.82 | 5.19 ± 0.77 | 5.06 ± 0.95 | 0.36 | 0.70 c |
| Change rate (%) | 0.11 ± 14.69 | -0.14 ± 13.55 | 1.11 ± 17.81 | 0.06 | 0.94 c |
| HDL-C (mmol/L) | 1.12 (0.97, 1.34) | 1.14 (1.05, 1.34) | 1.22 (1.06, 1.32) | 0.29 | 0.87 b |
| Change rate (%) | 4.53 (-10.84, 15.42) | -4.07 (-12.40, 10.87) | -2.20 (-10.90, 9.92) | 0.91 | 0.64 b |
| LDL-C (mmol/L) | 3.26 ± 0.82 | 3.41 ± 0.76 | 3.09 ± 0.78 | 1.23 | 0.30 b |
| Change rate (%) | 2.04 (-11.49, 15.07) | 4.38 (-10.06, 17.56) | -0.65 (-8.51, 9.55) | 0.63 | 0.73 b |
| IL-10 (pg/mL) | 4.61 (2.00, 5.78) | 4.44 (3.59, 5.21) | 4.34 (2.12, 4.94) | 1.16 | 0.56 b |
| Change rate (%) | -15.74 (-52.68, 27.45) | -11.96 (-29.87, 27.94) | -5.60 (-40.62, 9.31) | 0.64 | 0.72 b |
| IL-18 (pg/mL) | 98.14 (59.23, 142.06) | 133.62 (75.62, 139.71) | 128.48 (60.83, 137.75) | 1.54 | 0.46 b |
| Change rate (%) | -48.00 (-81.71, -25.67) d | -45.33 (-76.79, 26.89) | -24.57 (-52.44, 41.30) | 6.17 | 0.04 b |
Abbreviations: TCM, traditional Chinese medicine; BMI, Body Mass Index; WHR, waist-to-hip ratio; AST, aspartate transaminase; ALT, alanine aminotransferase; ALP, alkaline phosphatase; GGT, γ-glutamyl transferase; HOMA2 IR, homeostasis model assessment 2 of insulin resistance; TG, triglyceride; TC, total cholesterol; HDL-C, high density lipoprotein cholesterol; LDL-C, low density lipoprotein cholesterol; IL, interleukin.
a Values are expressed as means ± SD or median (IQR).
b Kruskal-Wallis test.
c One-way ANOVA.
d P < 0.05 vs the placebo group.
4.3. Secondary Outcomes
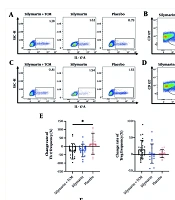
4.3.1. Silymarin + Traditional Chinese Medicine Reduces the Th17/Treg Cell Ratio in the Peripheral Blood of Participants
To analyze the impact of the intervention on the composition of peripheral blood T lymphocytes, flow cytometry was employed to quantify CD4+IL-17A+ Th17 cells and CD4+CD25+CD127low Treg cells in PBMCs obtained from the subjects. Post-intervention, the Th17/Treg cell ratio in the silymarin + TCM group was approximately half that of the placebo group (Table 2). Figure 2A - D illustrates the proportions of Th17 and Treg cells in the peripheral blood of the three groups. Compared to the placebo group, the silymarin + TCM group exhibited more pronounced reductions in Th17 cell counts and the Th17/Treg ratio. In contrast, the changes in Treg cell numbers did not significantly differ among the groups (Figure 2E). Figure 2F illustrates the measurement of mRNA expression in PBMCs via qRT-PCR at the conclusion of the experiment. IL17A and FOXP3 are genes that serve as indicators of Th17 and Treg cells, respectively. The relative mRNA expression of IL17A in the silymarin + TCM group was significantly lower than that in the placebo group, while the relative mRNA expression of FOXP3 in the silymarin + TCM group was markedly higher than that in the placebo group.
| Variables | Baseline | End of the Trial | ||||||||
|---|---|---|---|---|---|---|---|---|---|---|
| Silymarin + TCM (n = 26) | Silymarin (n = 18) | Placebo (n = 15) | H- Value | P-Value | Silymarin + TCM (n = 26) | Silymarin (n = 18) | Placebo (n = 15) | H- Value | P-Value | |
| Th17 frequency (%) | 1.40 (0.67, 2.26) | 1.36 (1.13, 1.71) | 1.21 (0.81, 2.53) | 0.14 | 0.93 | 0.74 (0.46, 1.27) | 0.94 (0.43, 1.51) | 1.42 (1.05, 1.64) | 5.88 | 0.05 |
| Treg frequency (%) | 6.53 (5.16, 8.24) | 6.26 (5.09, 8.55) | 6.35 (5.31, 11.00) | 0.24 | 0.88 | 6.99 (5.32, 9.38) | 7.10 (4.83, 9.25) | 6.53 (5.18, 11.80) | 0.28 | 0.87 |
| Th17/Treg ratio | 0.17 (0.11, 0.29) | 0.20 (0.13, 0.26) | 0.20 (0.11, 0.31) | 0.43 | 0.81 | 0.11 (0.05, 0.18) b | 0.11 (0.08, 0.22) | 0.23 (0.14, 0.31) | 6.26 | 0.04 |
Abbreviations: TCM, traditional Chinese medicine; Th, T helper; Treg, T regulatory.
a Values are expressed as median (IQR).
b P < 0.05 vs the placebo group.
.")
Distribution of Treg and Th17 cells in peripheral blood. A - B, the frequency of Th17 and Treg cells among three groups at baseline; C - D, the frequency of Th17 and Treg cells among three groups at the end of trial; E, the change rate of Th17, Treg cells and Th17/Treg ratio; F, mRNA levels of IL17A and FOXP3. *P < 0.05, **P < 0.01. (Abbreviations: IL, interleukin; TCM, traditional Chinese medicine; Th, T helper; Treg, T regulatory).
4.3.2. Reduced Nucleotide-Binding Oligomerization Domain-Like Receptor Protein 3 Inflammasome-Related Genes in Peripheral Blood Mononuclear Cells in Subjects Receiving Silymarin + Traditional Chinese Medicine or Silymarin Alone
As shown in Figure 3, the expression of mRNAs associated with the NLRP3 inflammasome in PBMCs was analyzed via qRT-PCR. The results indicated no significant difference in the mRNA expression of GSDMD among the three groups (Figure 3C). In contrast, the mRNA expression of NLRP3, CASP1, and IL1B was significantly lower in both the silymarin + TCM and silymarin groups than that in the placebo group (Figure 3A, B, and D). Furthermore, the mRNA expression of IL18 in the silymarin + TCM group was lower than that in the placebo group (Figure 3E).
.")
Expression of NLRP3 inflammasome related genes in peripheral blood mononuclear cells of subjects at the end of the trial. A - E, mRNA levels of nucleotide-binding oligomerization domain-like receptor protein 3, CASP1, GSDMD, IL1B and IL18. *P < 0.05, **P < 0.01, ***P < 0.001. (Abbreviations: CASP1, caspase-1; FOXP3, forkhead box p3; GSDMD, gasdermin D; IL, interleukin; NLRP3, nucleotide binding oligomerization domain-like receptor protein 3; TCM, traditional Chinese medicine).
5. Discussion
This study demonstrated that the combination of silymarin with TCMs (P. lobata, S. miltiorrhiza, and S. chinensis) significantly reduced serum IL-18 concentrations, the proportion of Th17 cells, and the Th17/Treg cell ratio in patients with NAFLD. Additionally, the expression of NLRP3-related genes was significantly lower in both the silymarin + TCM and the silymarin groups compared to the placebo group. Recent studies have indicated that specific CD4+ T lymphocyte subsets play crucial roles in the inflammatory progression of NAFLD (10). Of particular interest are Th17 and Treg cells, which have been identified as important subsets. The Th17/Treg cell ratio in both the peripheral blood and liver tissue of NASH patients is notably higher than that in patients with simple fatty liver (25). Furthermore, recent research has highlighted the immunomodulatory and anti-inflammatory properties of silymarin (26). In a study investigating the efficacy of silymarin in treating multiple sclerosis, patients who took 420 mg of silymarin daily for six months experienced a decrease in Th17 cells and serum IL-17 levels in peripheral blood, along with an increase in Treg cells and serum IL-10 levels (27). In our study, NAFLD patients in the silymarin group consumed tablets containing 163.2 mg of silymarin daily for three months, resulting in no significant changes in the proportions of Th17 and Treg cells in peripheral blood. This lack of significant change may be attributed to the lower dosage of silymarin and the shorter duration of the intervention.
Although no significant differences in the percentages of Treg cells or serum IL-10 levels were observed among the three groups in our study, the silymarin + TCM group exhibited a reduced percentage of Th17 cells and a significant increase in the mRNA expression of IL17A and FOXP3 compared to the placebo group. This phenomenon may be attributed to the effective inhibition of IL-17 levels associated with Th17 cells by P. lobata and S. miltiorrhiza (28, 29). Schisandra chinensis interferes with the differentiation of CD4+ T lymphocytes into Th17 cells while facilitating their transformation into Treg cells (30). Our study suggests that the combination of silymarin with the aforementioned TCMs may significantly reduce the number of Th17 cells, thereby balancing the Th17/Treg cell ratio in the peripheral blood of NAFLD patients.
Matias et al. reported that silymarin can inhibit the NLRP3 inflammasome in the PBMCs of pregnant women with preeclampsia, thereby ameliorating sterile inflammation (31). Furthermore, P. lobata, S. miltiorrhiza, and S. chinensis have also demonstrated potential in inhibiting the activation of the NLRP3 inflammasome (32-34). One study has indicated that blocking the activation of the NLRP3 inflammasome can reverse the imbalance between Th17 and Treg cells (35). Therefore, the enhanced efficacy in suppressing the activation of the NLRP3 inflammasome and regulating the Th17/Treg cell equilibrium observed in this study may result from the synergistic actions of silymarin and TCM components.
A meta-analysis that combined TCM with silymarin demonstrated improvements in liver transaminase levels and dyslipidemia among patients with NAFLD (36). However, our findings did not indicate a significant improvement in liver transaminase levels or dyslipidemia in NAFLD patients treated with either silymarin + TCM or silymarin alone. The limited improvements observed may be attributed to the relatively lower baseline levels of liver transaminases and blood lipids in the recruited patients compared to those in other studies (37, 38), resulting in a less pronounced clinical intervention effect.
In China, the current clinical management of NAFLD primarily emphasizes lifestyle interventions and the treatment of associated metabolic comorbidities (39). The latest Chinese guidelines (2024 edition) do not currently recommend silymarin for the treatment of NAFLD, citing insufficient evidence regarding its efficacy in improving liver histology (39). In contrast, the Russian guidelines endorse the use of silymarin in the management of NAFLD (40). Furthermore, the adjunctive use of traditional Chinese medicine may provide potential synergistic effects. Therefore, further clinical studies are warranted to evaluate the therapeutic benefits of these approaches across different stages of NAFLD and to establish standardized dosing protocols for clinical application.
A potential limitation of this study is the small number of patients willing to undergo peripheral blood T lymphocyte count and genetic testing, which may have introduced statistical bias. Additionally, the study exclusively included patients with mild NAFLD at baseline, thereby omitting the effects of treatment on individuals with more advanced stages of the disease. The capacity to investigate the causal relationship between NLRP3 inflammasome activation and the balance of Th17 and Treg cells in PBMCs from patients with NAFLD through clinical trials is currently limited.
5.1. Conclusions
In summary, the combination of silymarin with Pueraria, S. miltiorrhiza, and S. chinensis can mitigate the inflammatory response by inhibiting the activation of the NLRP3 inflammasome and modulating the balance of peripheral blood Th17 and Treg cells in patients with NAFLD. This cost-effective and nontoxic therapy provides novel insights into the potential application of silymarin in conjunction with TCMs for the treatment of NAFLD.
