


1. Background
Chronic hepatitis C (CHC) can lead to cirrhosis, liver failure, hepatocellular carcinoma (HCC), and mortality (1). Predictive factors of HCC and mortality in CHC patients include older age, low albumin level, disease stage, obesity, portal hypertension, hemorrhage because of esophageal varices, alcohol misuse, as well as co-infection with human immunodeficiency virus (HIV) or hepatitis B virus (HBV) (2-6). The most dangerous factor is advanced liver fibrosis or cirrhosis, especially decompensated cirrhosis (7, 8). Evaluation of liver fibrosis is essential to identify the progression of liver disease.
Liver biopsy is the traditional gold standard for staging fibrosis, however, it is influenced by many factors, including invasiveness, risk of complications, sampling error and pathologists’ expertise. Therefore, it is not suitable for repetitive testing (9-11). Child-Pugh score and model of end-stage liver disease (MELD) are scoring systems correlated with liver disease prognosis in cirrhosis patients (12, 13). Elastography is an accurate method for the diagnosis of fibrosis using FibroScan (Echosens, Paris, France) (14). FibroTest, aspartate aminotransferase-to-platelet ratio (APRI), and fibrosis-4 (FIB-4) are blood fibrosis tests, among which, APRI and FIB-4 are based on readily available, simple serum and haematology tests and have been shown to predict both significant fibrosis and cirrhosis (15-17). Due to elastography and FibroTest require more resources, it is suggested that APRI and FIB-4 are used for the assessment of fibrosis in settings with limited resource according to the guidelines of world health organization (WHO) (1).
Baseline noninvasive fibrosis methods have been fully identified to predict clinical outcomes in CHC patients (18-21). Clinical disease evolves over time. Jain MK et al. and Bambha K et al. reported that increases in FIB-4 and APRI were correlated with outcomes in patients co-infected with HIV and viral hepatitis (22, 23). Vergniol J et al. reported that 3-year changes of noninvasive fibrosis methods have strong prognostic value in CHC patients (20). Whether changes in these noninvasive tests over a shorter time interval still have a prognostic value in CHC remains to be determined; although, if yes, this can be potentially beneficial for timely monitoring of disease progression.
Most of the above studies are from European countries, such as the United States or France. Multiple viral and host factors that affect HCV natural history and therapeutic response are different between China and European countries, for example, cirrhosis was present in a somewhat higher proportion of patients with IL28B genotype CT or TT (13.8%) compared with genotype CC (9.4%), which was reported to be predominant in China (24, 25).
2. Objectives
In this study, we assess the prognostic value of changes in APRI and FIB-4 in consecutive years for liver disease progression in Chinese CHC patients.
3. Methods
3.1. Patients
Patients with CHC in the Hepatology Departments of 2 tertiary hospitals (Taizhou People’s Hospital, Jiangsu, China; Liaocheng People’s Hospital, Shandong, China), between January 2008 and December 2016, were enrolled in this retrospective study. All patients were aged 18 and above. The inclusion criteria included: 1. persisting detectable HCV RNA for more than 6 months, 2. the follow-up time of more than 1 year, and 3. at least 2 follow-up data with an interval of 12 ± 2 months. The exclusion criteria included: 1. positive hepatitis B surface-antigen, 2. positive anti-HIV antibody, 3. patients presenting with other chronic liver disease (alcohol consumption more than 40g/day and a duration of alcohol misuse exceeding 5 years (26), autoimmune hepatitis, and primary biliary cirrhosis), 4. presence of malignancies at enrollment or less than 1 year after enrollment, including HCC, and 5. no follow-up data more than 15 months between the baseline and the last follow-up. The study was approved by the ethics committees of Taizhou People’s hospital, China. Due to the fact that this study is a retrospective analysis, informed consent was waived.
3.2. Clinical Monitoring
All patients were examined every 3-12 months with liver function test, platelet count (PLT), alpha fetal protein (AFP), HCV RNA, and abdominal imaging examination. Patients with liver-related complications or cirrhosis had a shorter follow-up interval. Antiviral therapy with interferon (IFN) or pegylated interferon (PEG-IFN), plus ribavirin and the definition of sustained virologic response (SVR), was according to the APASL guidelines (27). Liver disease progression refers to development of cirrhosis and liver decompensation as well as occurrence of HCC and liver-related death during follow-up. Diagnosis of HCC was according to AASLD guidelines (28). For cases before 2015, diagnosis of liver cirrhosis was based on physical findings, laboratory, imaging and endoscopic evidence; for cases after 2015, in addition to the above method, the liver elastography was also used and liver biopsy was performed in the patients who were unable to confirm cirrhosis by the above method (1). Definition of liver failure was based on published literature (29). Liver-related death was defined as the primary cause of death due to complication of liver cirrhosis (such as variceal bleeding), liver failure, or HCC.
3.3. Calculation of APRI and FIB-4
3.4. Calculation of Annual Change of APRI and FIB-4
APRI and FIB-4 were calculated every 12 ± 2 months. The second calculation subtracts the baseline calculation, the third calculation subtracts the second calculation, and so on. The average of above results was defined as annual changes (AC) of APRI and FIB-4.
3.5. Statistical Analysis
Continuous variables were expressed as medians (1st and 3rd quartiles). Categorical variables were expressed as percentages. Chi-square test or Fisher’s test was used for categorical variables. Continuous variables were analyzed by the Mann-Whitney U test. Univariate analysis was performed by the Kaplan-Meier method with the log-rank test for categorical variables and univariate Cox Model for continuous variables. Significant variables were tested for collinearity by tolerance and variance inflation factor (VIF). Interactions between the significant variables were tested by multiplitive model. The Cox proportional regression models were determined based on the collinearity and interaction tests to identify the independent risk factors for liver disease progression. All levels of significance were set as P < 0.05 for all tests. Statistical analyses were performed using SPSS version 19.0 (SPSS Inc., Chicago, IL). The Cox Regression Power Analysis of NCSS PASS 11.0 software was used to estimate the sample size of each Cox model.
4. Results
4.1. Baseline Characteristics of Patients
A total of 173 patients were enrolled, including 144 patients without disease progression and 29 patients with liver disease progression. The screening process is depicted in Figure 1. The mean age was 48.0 (41.0 - 59.0) years and the mean follow-up time was 47.0 (29.5 - 72.0) months. HCV genotype was detected in 168 patients, 89.3% of which were genotype 1. A total of 131 patients received IFN or peg-IFN plus ribavirin therapy, 64.9% of whom achieved SVR. The baseline characteristics are summarized in Table 1.
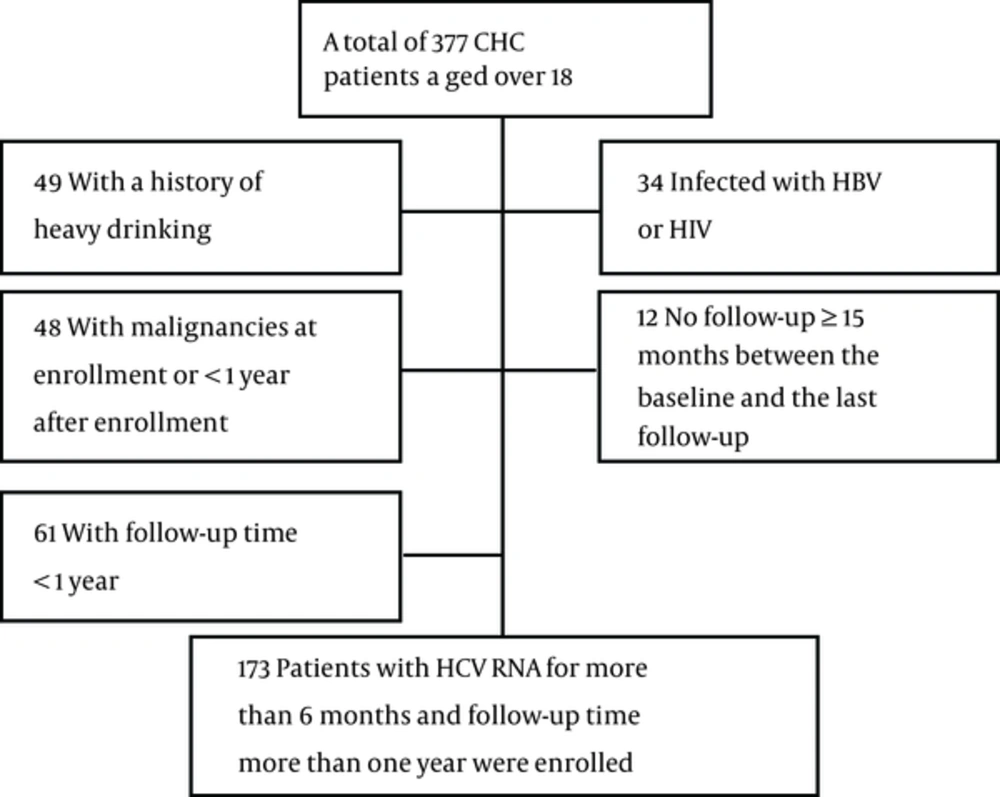
Figure 1.
CHC: chronic hepatitis C, HBV: hepatitis B virus, HIV: human immunodeficiency virus.
Table 1.Baseline Characteristics of Patients
| Total (n = 173) | Non Progression (n = 144) | Disease Progression (n = 29) | P Value | |
|---|---|---|---|---|
| Follow-up time, mo | 47.0 (29.5 - 72.0) | 44.5 (29.0 - 72.0) | 54.0 (34.0 - 68.5) | 0.232 |
| Age, y | 48.0 (41.0 - 59.0) | 46.5 (39.25 - 56.75) | 59.0 (48.5 -66.5) | < 0.001 |
| Male gender, % | 48.6 | 47.9 | 51.7 | 0.839 |
| Total bilirubin, μmol/L | 17.20 (12.10 - 23.10) | 15.65 (11.92 - 22.20) | 20.0 (16.70 - 27.65) | 0.007 |
| Albumin, g/L | 42.2 (37.9 - 45.3) | 42.75 (39.53 - 45.48) | 36.30 (29.0 - 41.40) | < 0.001 |
| ALT, U/L | 61.0 (36.0 - 109.5) | 61.0 (36.0 - 99.75) | 86.0 (31.5 - 130.5) | 0.426 |
| AST, U/L | 48.0 (30.5 - 80.0) | 44.0 (29.25 - 73.0) | 63.0 (42.0 - 131.5) | 0.006 |
| ALP, U/L | 85.0 (64.0 - 110.0) | 81.5 (62.0 - 105.0) | 94.0 (79.0 - 152.5) | 0.006 |
| GGT, U/L | 49.0 (27.0 - 85.0) | 42.0 (26.0 - 73.75) | 91.0 (51.0 - 160.5) | 0.001 |
| PLT, × 109/L | 116.0 (74.5 - 171.0) | 124.0 (84.0 - 175.0) | 61.0 (49.0 - 87.5) | < 0.001 |
| Log 10 HCV RNA, IU/mL | 6.02 (4.99 - 6.80) | 6.07 (5.06 - 6.86) | 5.78 (4.56 - 6.59) | 0.159 |
| AFP, ng/mL | 5.10 (3.30 - 7.55) | 4.60 (3.10 - 6.80) | 8.1 (5.75 - 11.4) | < 0.001 |
| Virus genotype, % (n = 168) | 0.627 | |||
| 1 | 89.3 | 90.2 | 87.5 | |
| 2 | 8.3 | 8.4 | 8.3 | |
| 3 | 1.8 | 0.7 | 4.2 | |
| 6 | 0.6 | 0.7 | 0.0 | |
| Antiviral therapy, % | <0.001 | |||
| SVR | 49.1 | 56.3 | 13.8 | |
| Non SVR | 26.6 | 22.9 | 44.8 | |
| Without treatment | 24.3 | 20.8 | 41.4 | |
| Child Pugh class, % | < 0.001 | |||
| A | 87.3 | 93.1 | 58.6 | |
| B | 10.4 | 6.9 | 27.6 | |
| C | 2.3 | 0.0 | 13.8 | |
| Baseline FIB-4 | 2.75 (1.45 - 6.06) | 2.10 (1.31 - 4.34) | 7.15 (5.44 - 9.93) | < 0.001 |
| Baseline FIB-4, % | < 0.001 | |||
| ≤ 3.25 | 54.9 | 64.6 | 6.9 | |
| > 3.25 | 45.1 | 35.4 | 93.1 | |
| AC of FIB-4 | 0.22 (-0.16 - 0.65) | 0.10 (-0.23 - 0.43) | 1.98 (1.01 - 3.70) | < 0.001 |
| Baseline APRI | 1.06 (0.52 - 2.43) | 0.88 (0.48 - 1.98) | 2.68 (1.76 - 4.59) | < 0.001 |
| Baseline APRI, % | < 0.001 | |||
| ≤ 2 | 68.2 | 76.4 | 27.6 | |
| > 2 | 31.8 | 23.6 | 72.4 | |
| AC of APRI | -0.09 (-0.42 - 0.14) | -0.10 (-0.41 - 0.07) | 0.44 (-0.44 - 1.06) | 0.001 |
Abbreviations: ALP, alkaline phosphatase; ALT, alanine transaminase; AST, aspartate aminotransferase; GGT, gamma-glutamyltranspeptidase.
4.2. Risk Factors of Liver Disease Progression by Univariate Analysis
During the follow-up, 29 patients showed liver disease progression: 7 patients with development of cirrhosis, 8 patients progressed from compensated cirrhosis to decompensated cirrhosis, 5 patients were presented with HCC, and 9 patients died of liver-related causes (1 patient died of variceal bleeding, 4 liver failure and 4 HCC). Univariate analysis demonstrated that age, albumin, ALP, PLT, non-SVR and without antiviral treatment, Child-Pugh B and C, baseline FIB-4 > 3.25, baseline APRI > 2, AC of FIB-4, as well as AC of APRI were significantly associated with liver disease development. The results are presented in Table 2.
Table 2.Risk Factors of Liver Disease Progression: Univariate Analysis
| Hazard Ratio (95%CI) | P Value | |
|---|---|---|
| Age, y | 1.063 (1.034 - 1.094) | < 0.001 |
| Male gender, % | 1.391 (0.670 - 2.889) | 0.354 |
| Total bilirubin, μmol/L | 1.008 (1.000 - 1.017) | 0.059 |
| Albumin, g/L | 0.910 (0.861 - 0.962) | 0.001 |
| ALT, U/L | 1 (0.997 - 1.003) | 0.952 |
| AST, U/L | 1.001 (0.998 - 1.003) | 0.557 |
| ALP, U/L | 1.008 (1.001 - 1.015) | 0.028 |
| GGT, U/L | 1.003 (0.999 - 1.006) | 0.113 |
| PLT, × 109/L | 0.985 (0.976 - 0.994) | 0.002 |
| Log 10 HCV RNA, IU/mL | 0.833 (0.669 - 1.037) | 0.102 |
| AFP, ng/mL | 1.007 (0.991 - 1.023) | 0.372 |
| Virus genotype, % (n = 168) | 0.265 | |
| 1 | 1 | |
| 2 | 1.548 (0.493 - 4.862) | |
| 3 | 2.508 (0.586 - 10.734) | |
| 6 | 4.886 (0.645 - 37.010) | |
| Antiviral therapy, % | 0.003 | |
| SVR | 1 | |
| Non-SVR | 4.901 (1.589 - 15.113) | |
| Without treatment | 5.399 (1.727 - 16.881) | |
| Child Pugh class, % | < 0.001 | |
| A | 1 | |
| B | 2.936 (1.222 - 7.056) | |
| C | 21.074 (6.645 - 66.828) | |
| Baseline FIB-4, % | < 0.001 | |
| ≤ 3.25 | 1 | |
| > 3.25 | 13.252 (3.134 - 56.034) | |
| AC of FIB-4 | 1.902 (1.592 - 2.272) | < 0.001 |
| Baseline APRI, % | 0.001 | |
| ≤ 2 | 1 | |
| > 2 | 3.887 (1.689 - 8.946) | |
| AC of APRI | 1.736 (1.161 - 2.596) | 0.007 |
4.3. Association of AC of APRI and AC of FIB-4 with Liver Disease Progression by Multivariate Analysis
Significant variables were tested for collinearity and interaction before multivariable analysis. Age (VIF = 19.568), albumin (VIF = 21.964), baseline FIB-4 > 3.25 (VIF = 27.42), baseline APRI > 2 (VIF = 19.585), and Child-Pugh class (VIF = 11.927) presented significant collinearity. We did not introduce age, albumin, PLT into multivariate analysis for the following reasons: age and PLT are included in the formulas of FIB-4 and APRI, whereas albumin is a parameter in Child-Pugh score. Finally, antiviral therapy, ALP, Child-Pugh class, baseline FIB-4 > 3.25, baseline APRI > 2, AC of FIB-4, and AC of APRI were used for multivariate analysis. Interactions were tested between non-collinearity factors. AC of FIB-4 and AC of APRI had significant interaction (P = 0.045), whereas it was not significant between other factors (P > 0.05). Multivariate Cox models were determined based on the above collinearity and interaction tests. These models included baseline FIB-4 > 3.25, antiviral therapy, and AC of FIB-4 (Model 1); baseline APRI > 2, antiviral therapy, and AC of APRI (Model 2); AC of FIB-4, ALP, Child-Pugh class and antiviral therapy (Model 3); AC of APRI, ALP, Child-Pugh class and antiviral therapy (Model 4); AC of FIB-4 in subgroups identified according to AC of APRI (Model 5) (Table 3). Model 1 and Model 2 aimed to compare baseline fibrosis tests and ACs of fibrosis tests. The results showed that baseline FIB-4 > 3.25, baseline APRI > 2 and AC of FIB-4 had significance, while AC of APRI had no significance. Model 3 and Model 4 aimed to compare AC of FIB-4 and AC of APRI. AC of FIB-4 and Child-Pugh class C were notably associated with liver disease progression in Model 3. Non-SVR and Child-Pugh class C, not AC of APRI, were associated with liver disease progression in Model 4. AC of FIB-4 was significantly associated with liver disease progression in 3 subgroups according to AC of APRI in Model 5 (Table 4).
Table 3.The Cox Proportional Regression Models
| Model 1 | Model 2 | Model 3 | Model 4 | |||||
|---|---|---|---|---|---|---|---|---|
| HR (95%CI) | P Value | HR (95%CI) | P Value | HR (95%CI) | P Value | HR (95%CI) | P Value | |
| Antiviral therapy | 0.819 | 0.160 | 0.259 | 0.073 | ||||
| SVR | 1 | 1 | 1 | 1 | ||||
| Non-SVR | 1.382 (0.392 - 4.868) | 0.615 | 3.196 (0.960 - 10.640) | 0.058 | 2.470 (0.727 - 8.385) | 0.147 | 3.548 (1.091 - 11.541) | 0.035 |
| Without treatment | 1.118 (0.314 - 3.980) | 0.863 | 2.925 (0.834 - 10.267) | 0.094 | 1.444 (0.352 - 5.923) | 0.610 | 1.895 (0.471 - 7.630) | 0.368 |
| Baseline FIB-4 > 3.25 | 6.588 (1.369 - 31.703) | 0.019 | - | - | - | |||
| AC of FIB-4 | 1.621 (1.326 - 1.982) | < 0.001 | - | 1.687 (1.363 - 2.088) | < 0.001 | - | ||
| Baseline APRI > 2 | - | 2.900 (1.209 - 6.959) | 0.017 | - | - | |||
| AC of APRI | - | 1.292 (0.882 - 1.895) | 0.189 | - | 1.328 (0.837 - 2.105) | 0.228 | ||
| ALP | - | - | 1.001 (0.996 - 1.005) | 0.768 | 1.001 (0.997 - 1.006) | 0.524 | ||
| Child-Pugh class | - | - | 0.047 | < 0.001 | ||||
| A | - | - | 1 | 1 | ||||
| B | - | - | 1.336 (0.484 - 3.688) | 0.576 | 2.377 (0.836 - 6.760) | 0.105 | ||
| C | - | - | 6.263 (1.431 - 27.417) | 0.015 | 20.255 (5.216 - 78.646) | < 0.001 | ||
Table 4.Model 5: AC of FIB-4 in Subgroups Defined by AC of APRI
aThe 1st quartile.
bThe 3rd quartile.
4.4. Prediction of Liver Disease Progression Using Baseline FIB-4, AC of FIB-4 and SVR
Due to the fact that only a few patients were Child-Pugh class C, we divided patients into subgroups according to baseline FIB-4, AC of FIB-4 and SVR. Figure 2A showed the significant differences between the patients with AC of FIB-4 > 0.22 and the patients with AC of FIB-4 ≤ 0.22 (P < 0.001).
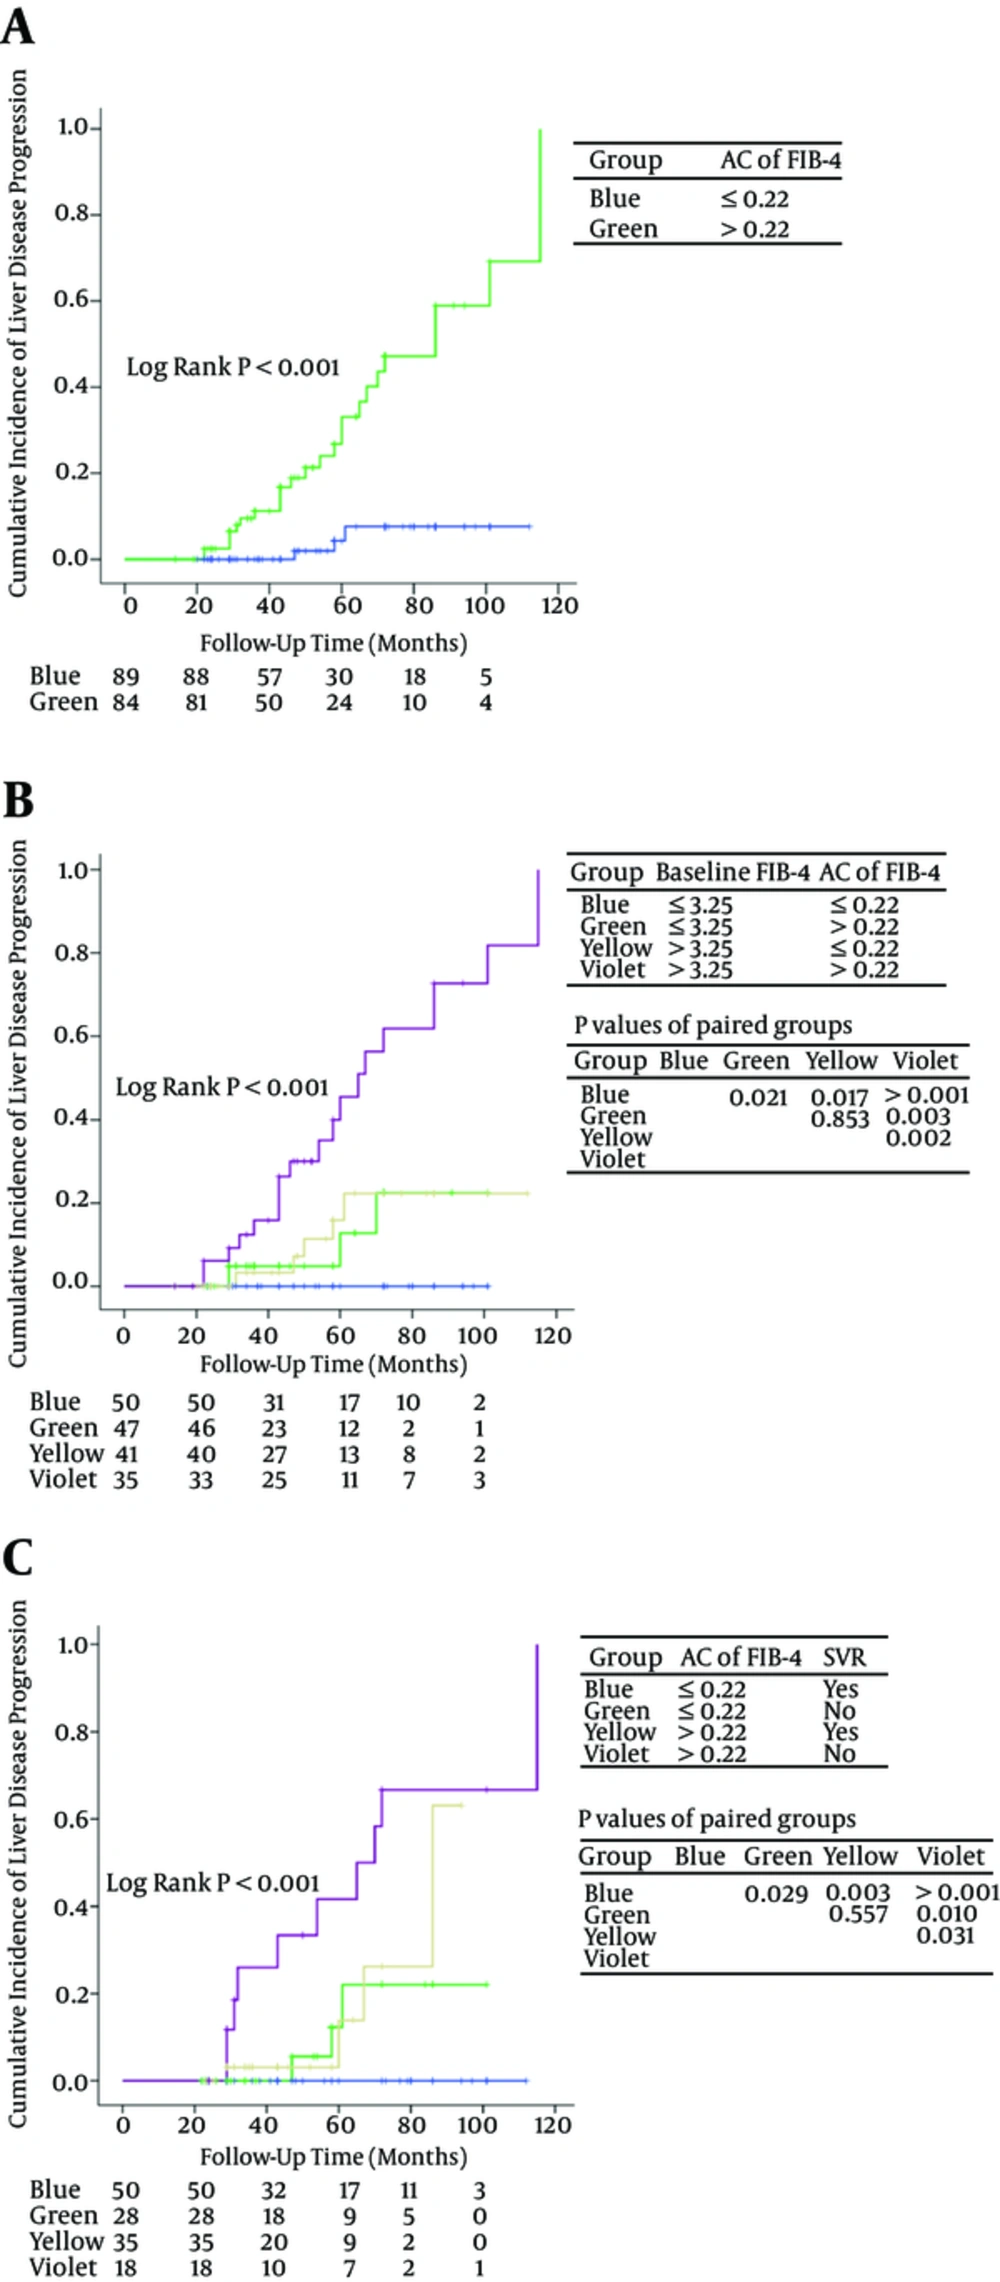
Figure 2.
Cumulative Incidence of Liver Disease Progression in Subgroups Defined by AC of A, FIB-4; B, baseline FIB-4 and AC of FIB-4; or C, AC of FIB-4 and SVR.
Patients were divided into 4 groups according to baseline FIB-4 and AC of FIB-4 (group 1: baseline FIB-4 ≤ 3.25 and AC of FIB-4 ≤ 0.22; group 2: baseline FIB-4 ≤ 3.25 and AC of FIB-4 > 0.22; group 3: baseline FIB-4 > 3.25 and AC of FIB-4 ≤ 0.22; group 4: baseline FIB-4 > 3.25 and AC of FIB-4 > 0.22) (Figure 2B). Cumulative incidence of liver disease progression in group 4 was significantly higher than that in group 1/2/3 (P < 0.001). Significant differences were observed between group 2 versus group 1 (P = 0.021) and group 3 versus group 1 (P = 0.017). There was no significant difference between group 2 and group 3 (P = 0.853).
Four subgroups were identified according to AC of FIB-4 and SVR (group 1: AC of FIB-4 ≤ 0.22 and SVR; group 2: AC of FIB-4 ≤ 0.22 and non-SVR; group 3: AC of FIB-4 > 0.22 and SVR; group 4: AC of FIB-4 > 0.22 and non-SVR) (Figure 2C). There was no statistical significance between group 2 and group 3 (P = 0.557). Patients with AC of FIB-4 > 0.22 and no SVR have the worst prognosis.
5. Discussion
Teshale E et al. reported that APRI and FIB-4 distinguished significant fibrosis F2-F4 from none to minimal fibrosis F0-F1 with good sensitivity and specificity with liver biopsy as a control in chronic hepatitis B (30). A cross-sectional study with liver biopsy as a control reported that APRI and FIB-4 had a similar and good overall performance in the diagnosis of significant fibrosis (METAVIR stage ≥ 2) in chronic hepatitis C, the positive predictive value and negative predictive value for APRI and FIB-4 were, respectively, 77% and 92% as well as 83% and 81% (31). Berenguer J et al. compared the prognostic value of baseline liver biopsy and FIB-4 in HIV/HCV coinfection, the results showed that FIB-4 outperformed liver biopsy as a predictor of overall death and liver-related events (32). In view of the above study, taking into account the small number (16 cases) of patients with liver biopsy in this study, we did not compare liver biopsy and noninvasive fibrosis methods.
To our knowledge, this study first evaluated predictive value of annual changes in FIB-4 and APRI in liver disease prognosis in Chinese CHC patients. Due to the fact that Fibroscan was not introduced into the 2 tertiary hospitals until 2015 and patients who underwent liver stiffness measurement had limited follow-up time, we did not evaluate liver stiffness measurement in the study.
Follow-up time in this retrospective study was 47.0 (29.5 - 72.0) months. Patients who received IFN or PEG-IFN plus ribavirin antiviral therapy were followed up for more than 22 months (about 96 weeks), due to the fact that it is sufficient to complete an antiviral treatment and observe the efficiency of the treatment. Our study focused on the predictive value of baseline FIB-4 and APRI, ACs of FIB-4 and APRI, antiviral therapy, and Child-Pugh scores for liver disease progression. A total of 29 patients had liver disease progression. Since only 4 patients died of non-liver-related causes, mortality unrelated to liver disease was not evaluated.
This study showed that baseline FIB-4 > 3.25 and baseline APRI > 2 were significantly associated with liver disease progression. The results are consistent with previous studies (18-21). Univariate and multivariate analysis showed that AC of FIB-4 was a strong predictor for monitoring liver disease development. Patients with AC of FIB-4 > 0.22 had a significantly worse prognosis than patients with AC of FIB-4 ≤ 0.22. Patients with baseline FIB-4 > 3.25 and AC of FIB-4 > 0.22 had the highest cumulative incidence of liver disease progression among the 4 groups defined according to baseline FIB-4 and AC of FIB-4 (Figure 2B). Patients with baseline FIB-4 > 3.25 and AC of FIB-4 ≤ 0.22 had a similar prognosis to patients with baseline FIB-4 ≤ 3.25 and AC of FIB-4 > 0.22 (P = 0.853). Patients with baseline FIB-4 ≤ 3.25 and AC of FIB-4 ≤ 0.22 had excellent prognosis. Patients with high baseline FIB-4 and rapidly increasing FIB-4 should be monitored every year or even over a shorter time interval for the purpose of identifying disease development and starting an appropriate treatment.
AC of APRI was not associated with disease progression in multivariable analysis in this study. Previous studies have also pointed to the limited value of change in APRI in predicting liver disease progression (20, 22). FIB-4 contains age (a strong predictive factor of overall survival), AST, ALT, and platelet count; thus, it is considered a more complex and better prognostic indicator than APRI for evaluating the progression of liver-related diseases. Vergniol J reported that FIB-4 was as accurate as liver stiffness measurement in predicting death (20). Berenguer et al. reported that FIB-4 outperformed liver biopsy as a predictor of overall death and liver-related events (32). The components of the FIB-4 index are based on simple serum and hematology tests, which are easily performed at all clinics. In addition, FIB-4 is cheaper and easier to calculate than Fibrotest and enhanced liver fibrosis test (ELF) (15, 33), therefore, this index can be used for identifying progression of liver disease in CHC patients in resource-limited settings.
We evaluated the prognostic value of baseline Child-Pugh class. Due to the fact that this score increased in a small number of patients (4.6%), usually in patients with high baseline FIB-4 or high AC of FIB-4, we did not assess the change in Child-Pugh class. The results showed that Child-Pugh class C was an independent risk associated with liver disease progression.
Host IL28B genotype CC (rs12979860) and HCV genotype 1b were reported to be predominant in China, which may contribute to the higher rate of SVR (61% - 82%) with peg-IFN plus ribavirin as compared with that (54% - 61%) in Caucasian patients (24, 34, 35). A total of 131 patients received IFN or PEG-IFN plus ribavirin treatment, 86 of whom achieved SVR (64.9%) in this study. SVR to IFN-based therapy has been found to be associated with HCC and all-cause mortality risk reduction (36-39). This study showed that non-SVR had a borderline significance in Cox Model 2 (therapy, baseline APRI, and AC of APRI) (P = 0.058) and significance in Cox Model 4 (ALP, therapy, Child-Pugh class, and AC of APRI) (P = 0.035). Patients with non-SVR and AC of FIB-4 > 0.22 had the highest incidence of liver disease progression among the 4 subgroups according to SVR and AC of FIB-4 (Figure 2C). Non-SVR had significance in cumulative incidence of liver disease progression in patients with AC of FIB-4 ≤ 0.22. Patients with SVR and AC of FIB-4 ≤ 0.22 had excellent prognosis. Therefore, it is recommended that physicians should provide as far as possible effective antiviral therapy for patients, especially patients with rapidly increasing liver fibrosis tests, with the commercialization of direct-acting antivirals (DAAs).
The HCV genotype 1b was identified in 89.3% patients. This is consistent with previous findings (24). It was reported that HCV genotype 1b was a risk factor of HCC (40). There was no significant association between HCV genotype and liver disease progression in this study, probably due to the fact that most of the patients in our study were genotype 1. Further studies with larger cohorts that include a larger number of non-genotype 1 infected patients are recommended.
The present study has many limitations, including it being a retrospective analysis with a limited number of cases, no liver stiffness measurements, and no consideration of the effect of hepato-protective drugs as an intervention. Since hepato-protective drugs can reduce AST and ALT concentrations (41), further studies considering the effect of hepato-protective drugs on APRI and FIB-4 are necessary.
In conclusion, an increased FIB-4, over time, is a strong predictor of liver disease progression in Chinese CHC patients. Monitoring FIB-4 annually can help physicians predict the prognosis in CHC patients, especially for patients with obvious fibrosis or cirrhosis. Further studies are needed to confirm the predictive value of repeated noninvasive fibrosis tests in other causes of chronic liver diseases, in order to improve recommendations and initiate HCC screening.


