

1. Background
Nonalcoholic fatty liver disease (NAFLD) is a clinic-pathological diagnosis defined by presence of macrovesicular steatosis in more than 5% of hepatocytes in the absence of history of significant alcohol intake (1). The histological spectrum of NAFLD comprises an expanse of disease severity ranging from simple steatosis, dubbed nonalcoholic fatty liver (NAFL), typically characterized by a harmless limited clinical course, to the more aggressive nonalcoholic steatohepatitis (NASH). Fat aggregation in hepatocytes may provoke an inflammatory and fibrotic reaction (steatohepatitis) characterized by a progressive course of steatosis with hepatocellular injury and lobular inflammation, accompanied by the arrangement of fibrosis (2). This in turn can progress to cirrhosis with complications of portal hypertension, hepatocellular carcinoma, and liver failure (3).
A strong association has been found between NASH and a cluster of manifestations commonly referred to the metabolic or insulin resistance syndrome (IRS) (4). The repeated presence of IRS in patients with NASH, as well as the increased incidence of NASH in patients with familial syndromes of IR, indicates that IR may play a central role in the pathogenesis of NASH (5). It has been recently suggested that IR and consequent hyperinsulinemia may play a major role in disease progression from simple steatosis to NASH (6), which is further supported by improvements in both metabolic and histologic parameters with use of insulin-sensitizing agents in patients with NASH (7). IR can be easily assessed by utilization of the homeostasis model assessment for insulin resistance (HOMA-IR), a widely used method for IR estimation in clinical and epidemiological research studies (4, 8).
Hepatocyte apoptosis, a genetically regulated manner of cell death, is believed to play a substantial role in evolution of disease from simple steatosis to NASH and hepatic fibrosis (9). A cardinal consequence of the apoptotic course is the incitement of effector caspases (10), with caspase 3 being identified as the main participant in apoptotic cell death (11). Cytokeratin-18 (CK-18) is an intracellular protein originating primarily as a result of necrosis and apoptosis of epithelial origin cells, including hepatocytes (12). During the apoptotic process, CK-18 is cleaved by caspases and later released into the serum after death of the cell, therefore possibly providing a means to quantify cell death activity (13). A correlation has recently been found between measured serum levels of cleaved CK-18 fractions in patients with NASH and the existence of hepatic injury, inflammation, and fibrosis (14). It has been suggested that serum CK-18 fragment concentration test is the single most consistent parameter for distinguishing NASH from simple steatosis, based on the fact that this apoptotic activity is present in NASH patients but not in those with hepatic steatosis (15). These findings advocate CK-18 as a possible biomarker in prediction of liver histological manifestations (16).
In this context, and in light of the many constraints of liver biopsy which, to date, remains the gold standard in evaluation of NAFLD (17), the present study aims to differentiate patients with simple steatosis from those with NASH using CK-18 assessment both in liver tissue and in serum, as well as quantification of insulin resistance in these patients utilizing HOMA-IR. In addition, this study group aims to incorporate common clinical, laboratory, and histopathological parameters in order to propose an uncomplicated model for the accurate diagnosis of NASH, and as a means of grading and staging of this disease.
2. Methods
2.1. Study Design
This cross-sectional observational study was designed to differentiate between simple fatty liver and progressive pathological fatty infiltration, and hence, included patients attending the outpatient clinics of the Endemic Medicine Department of Mansoura University from May 2014 until March 2016.
All patients were subjected to combined evaluations of clinical, laboratory, and pathological assessment. Inclusion criteria comprised patients with any degree of persistent elevation of serum alanine aminotransferase (ALT) and serum aspartate aminotransferase (AST) levels for more than 3 months duration in absence of known etiology with ultrasound proof of fatty liver appearance. Serum aminotransferases were considered elevated when levels exceeded 40 units per liter (U/L) (18). Subjects with elevations in aminotransferase levels were reanalyzed after a period of three months with persistence being defined as elevation of ALT or AST on the subsequent evaluation (19).
Exclusion criteria consisted of patients with any other liver disease of known origin, such as viral or autoimmune, in addition to history of common hepatotoxic drug intake and other etiologies could be excluded by liver biopsy. A collection of clinical, demographic, and laboratory data were collected, followed by pathological liver tissue examination performed by a team of expert hepatic pathologists. Collected data were then analyzed for the build-up of a reliable diagnostic model.
2.2. Clinical and Laboratory Work-Up
Six mL venous blood was collected after an overnight fast. One mL was delivered into sterile vacutainer containing 50 µL dipotassium EDTA solution for CBC using automated cell counter (CELLDYN1800, U.S.A). One mL was delivered into sterile vacutainer containing Na citrate for prothrombin time measurement using automated blood coagulation analyzer (Sysmex CA-560, SN A1719, Japan). Four mL were delivered into plain vacutainer tubes and serum was separated. Serum was divided into 3 aliquots for assessment of ALT, AST, GGT, fasting glucose, cholesterol, triglycerides, fasting insulin and serum CK-18.
Traditional investigations including ALT, AST, GGT, fasting glucose, cholesterol and triglycerides were assayed using COBAS Integra 400 plus (Roche Diagnostics CH-6343 Switzerland). Serum fasting insulin was measured by chemiluminescent immunometric assay using IMMULITE®1000 supplied by Siemens Healthcare Diagnostics, USA catalog number: LKIN1 (Reeves, 1983). Insulin resistance was calculated according to the HOMA formula, i.e. HOMA-IR = Fasting insulin (mIU/L) × Fasting glucose (mg/dL) / 405 (20).
Serum CK-18 was estimated using a double antibody sandwich enzyme linked immunosorbent assay (ELISA) to assay the level of human Apoptosense M30 (Glory Science Co., Ltd TX 78840 USA). The assay range is (5 - 1500) U/L. The absorbance measurement was done by a microtiter plate reader at 450 nm.
2.3. Histopathological Assessment
Consecutive adults with biopsy-proven NAFLD were included and blood samples were collected at the time of the biopsy. Histological features were scored and the diagnosis of NASH was made based on Brunt’s criteria (21).
Liver biopsy specimens were reviewed by two separate pathologists who were blind to the patients’ clinical information. For each liver biopsy specimen, hematoxylin and eosin as well as Masson’s trichrome stain were done. The histopathological diagnosis of NAFLD was determined by the presence of steatosis which was graded according to the modified Brunt grading and staging system, based on percentage of hepatocytes involved (21), with specification of the type of steatosis as either macrovesicular, microvesicular, or mixed pattern. The score of other components of the NASH (NAFLD activity score) (22) were also assessed, these including lobular inflammation, ballooning, and fibrosis. The length of each core and number of portal areas were determined to assess the adequacy of the specimen.
2.4. Immunohistochemistry of Caspase-3 Expression (IHC)
Paraffin blocks were sectioned with a microtome to obtain sections of 4 µm thickness. Deparaffinized sections were incubated for 30 minutes with 0.3 % hydrogen peroxide in methanol and microwave-heated for 30 minutes in EDTA buffer solution at pH 8.0. Subsequently, an indirect immunoperoxidase technique was applied using antibodies against polyclonal rabbit anti-human Caspase 3 Antibody (NB100-56112) www.novusbio.com/NB100-56112. Primary antibody was left to react for 30 minutes at room temperature, using diaminobenzidine as chromogen. IHC was evaluated with caspase 3 expressions being semi-quantitatively assessed for each case. Both intensity and percentage of positive cells were considered. Cytoplasmic staining was considered positive with 0 as absent, 1 as weak, 2 as moderate, and 3 as strong (23). Immunoreactivity was evaluated independently by two of the authors (Figures 1, 2).
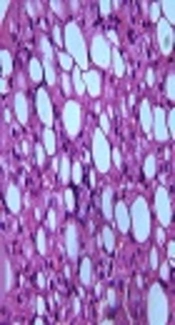
. B, Liver biopsy showing macrovesicular steatosis with lobular inflammatory cells related to the steatotic cells (H and E 400 ×). C, Liver biopsy showing moderate macrovesicular steatosis with focal ballooning of the hepatocytes (H and E 200 ×). D, Liver biopsy showing diffuse ballooning of steatotic hepatocytes (H and E 400 ×).")
A, Liver biopsy showing mild macrovesicular steatosis and mild portal inflammation (H and E 100 ×). B, Liver biopsy showing macrovesicular steatosis with lobular inflammatory cells related to the steatotic cells (H and E 400 ×). C, Liver biopsy showing moderate macrovesicular steatosis with focal ballooning of the hepatocytes (H and E 200 ×). D, Liver biopsy showing diffuse ballooning of steatotic hepatocytes (H and E 400 ×).
.")
Caspase 3 IHC: A, negative staining; B, mild cytoplasmic staining; C, moderate cytoplasmic staining; D, marked cytoplasmic staining (× 400).
2.5. Sample Size and Power of the Study
Sample size was calculated by Medcalc program www.medcalc.be, using a confidence level of 95%, with a power of 80. The assumed level of cytokeratin-18 accuracy to differentiate between fatty and non-fatty livers was 65%. The null hypothetical value was 50%. The estimated sample size was 114. The research team decided to increase the sample size by 30%, hence increasing the power of the study.
2.6. Statistical Analysis
Data were analyzed using SPSS (Statistical Package for Social Science) version 20. Qualitative data were expressed as number and percentage, with use of Chi-square test. Quantitative data were expressed as mean and standard deviation, using student t test. Receiver operating curve was used. Logistic regression was done. Significance was at P value < 0.05.
2.7. Ethical Approval
This proposal received acceptance from the institutional reviewer’s board with code number (R/17.03.27) and informed consent taken from all included subjects.
3. Results
3.1. Patient Characteristics
The study included 150 patients with ultrasound diagnosis of fatty liver that were then classified into two categories according to the results of liver biopsy (NAFLD score) into 44 patients with simple fatty liver and 106 cases with steatohepatitis fatty liver (Table 1).
| Demographic Characteristics | Simple Fatty Liver | Steatohepatitis | Significance |
|---|---|---|---|
| No. of cases | 44 (29.3) | 106 (70.7) | |
| Age, y | 38.44 ± 8.93 | 45.41 ± 7.70 | P < 0.001*** |
| Gender | P < 0.001*** | ||
| Male | 12 (27.3) | 82 (77.4) | |
| Female | 32 (72.7) | 24 (22.6) | |
| Body mass index, kg/m2 | 36 ± 6.96 | 37.17 ± 5.77 | P = 0.35 |
| Diabetes mellitus | P = 0.105 | ||
| No | 32 (72.7) | 54 (60) | |
| Yes | 12 (27.3) | 36 (40) | |
| Years of DM | 1.25 ± 0.26 | 3.84 ± 2.59 | P = 0.002** |
| Hypertension | P = 0.57 | ||
| No | 33 (86.4) | 78 (86.7) | |
| Yes | 6 (13.6) | 12 (13.3) | |
| Laboratory Data | |||
| Alanine aminotransferase, U/L | 45.68 ± 16.08 | 87.28 ± 15.37 | P < 0.001*** |
| Aspartate aminotransferase, U/L | 44.64 ± 21. 84 | 57.51 ± 23.51 | P < 0.002** |
| Gamma glutamyl transferase, U/L | 115.51 ± 25.4 | 128.93 ± 152.31 | P=0.023* |
| Cholesterol, mg/dL | 225.14 ± 25.03 | 235.96 ± 28. 26 | P = 0.02* |
| Triglyceride, mg/dL | 206.95 ± 58.31 | 255.53 ± 69.61 | P < 0.001*** |
| Heamoglobin, gm/dl | 12.59 ± 0.89 | 12.42 ± 0.904 | P = 0.27 |
| White blood cells, 109/L | 6.73 ± 1.02 | 7.90 ± 1.25 | P < 0.001* |
| Platelet, 109/L | 237.09 ± 44.48 | 206.45 ± 45.54 | P < 0.001*** |
| Uric acid, mg/dL | 5.2±0.91 | 6.17±1.36 | P= 0.01* |
| Fasting glucose, mg/dL | 101.14 ± 83.43 | 126.59 ± 34.29 | P= 0.152 |
| Fasting insulin, mIU/L | 17.64 ± 11.04 | 17.26 ± 0.94 | P = 0.152 |
| HOMA-IR index | 4.95 ± 2.48 | 5 ± 2.47 | P= 0.95 |
| Serum CK-18, U/L | 249.25 ± 68.87 | 320.85 ± 87.69 | P < 0.001* |
| Caspase-3 expression level in tissue | P = 0.008* | ||
| No | 6 (13.6) | 11 (10.4) | |
| Mild | 37 (84.1) | 67 (63.2) | |
| Moderate | 0 (0) | 12 (11.3) | |
| Severe | 1 (2.3) | 16 (15.1) |
Abbreviations: CK-18, Cytokeratin-18; HOMA-IR, Homeostasis Model Assessment for Insulin Resistance; mg/dL, Milligrams per Deciliter; mIU/L, Milli-International Unit per Liter; U/L, Units per Liter.
aValues are expressed as No. (%) or mean ± SD.
bStudent t test was used for quantitative data (mean and standard deviation). Chi-square test was used for qualitative data (number and percentage).
3.2. Serum CK-18 and Caspase Expression Assessment
Comparison of serum CK-18 levels between simple and advanced fatty liver patients showed significantly higher concentrations in patients with steatohepatitis than in patients with simple steatosis (Table 1). This increased CK-18 level was statistically significantly correlated with NAFLD Activity Score (NAS), hepatocyte ballooning, caspase-3 expression and inflammation, in addition to correlating positively with steatosis (Table 2).
| Variables | Serum CK-18 | Caspase -3 Expression Level | ||
|---|---|---|---|---|
| R | P Value | R | P Value | |
| Caspase-3 Expression | 0.34 | < 0.001 | ||
| Steatosis | 0.19 | 0.014 | 0.291 | < 0.001 |
| Hepatocyte Ballooning | 0.54 | < 0.001 | 0.54 | < 0.001 |
| Inflammation | 0.47 | < 0.001 | 0.56 | < 0.001 |
| NAFLD score | 0.49 | < 0.001 | 0.51 | < 0.001 |
| CK 18, U/L | 0.40 | < 0.001 | ||
3.3. Serum Concentration of CK-18 in Relation to Pathological Parameters with ROC Curve for Steatohepatitis
Serum level of CK-18 demonstrated a satisfactory relationship with all pathological variables that allowed differentiation between both entities of nonalcoholic fatty liver disease (Table 3 and Figure 3).
| Cut-Off Level | AUC (95% Confidence Interval), % | Sensitivity, % | Specificity, % | PPV, % | NPV, % | Significance | |
|---|---|---|---|---|---|---|---|
| Ck-18 | 260, U/L | 73.3 | 76.4 | 82.1 | 77 | 82 | < 0.001*** |

Receiver operating curve of CK-18 for prediction of steatohepatitis
3.4. The Regression Model (Table 4)
| Variables | B Coefficient | Significance | Exp (B) | 95% Confidence Interval |
|---|---|---|---|---|
| Age, y | -0.194 | 0.026 | 0.82 | (0.34 - 0.769) |
| Platelet, 109/L | 0.032 | 0.009 | 1.03 | (1.51 - 1.05) |
| Uric acid, mg/dL | 1.817 | 0.007 | 6.27 | (3.9 - 130.12) |
| Serum CK-18, U/L | 0.06 | 0.013 | 1.01 | (1.003 - 1.017) |
| ALT, IU/L | 0.061 | 0.085 | 1.01 | (1.02 - 20.1) |
| Constant | -13.23 | 0.003 |
The research team selected the highest significant predictors to build a logistic model for prediction of steatosis. Enter method was chosen to incorporate all highly significant predictors into the model, with the following equation being concluded: (Age) + (Platelets) + (Uric acid) + (CK-18) + (ALT) + (-13.23). Values closer to 0.5 were considered simple cases while those nearer to 1 were considered steatohepatitis. The overall predictability of the model with regards to NASH was 84%. The accuracy of model was 74.7%.
4. Discussion
NAFLD comprises a wide spectrum ranging from a benign course of simple steatosis, or NAFL, to the more aggressive NASH, accompanied by cirrhosis complicated by portal hypertension, hepatocellular carcinoma, and liver failure (3). While the gold standard for differentiation between simple steatosis and NASH lies in histological examination by liver biopsy (24), the many limitations of this invasive technique provide compelling justification for the development and validation of a simple noninvasive test to correctly distinguish between the two entities of NAFLD while concurrently determining the stage of the disease (9).
The apoptotic process is suggested to be a prime factor involved in NAFLD-associated liver injury. Caspase-3, an effector caspase activated during apoptosis, is known to cleave many cellular substances, including the protein CK-18, with resultant discharge of the degradation product, M30 (14, 25). Unchecked apoptosis of hepatocytes has been established as an important determinant of liver fibrogenesis (26), due to activation of hepatic stellate cells either directly by apoptotic body formation, or indirectly as a consequence of Kupffer cell engulfment of these bodies (27). Activation of hepatic stellate cells to hepatic myofibroblasts promotes deposition of extracellular matrix and scar formation in the liver (28). Based on this knowledge, it would be reasonable to explore the use of caspase-3 and CK-18 as noninvasive biomarkers of hepatocyte apoptosis for differentiation between simple steatosis and steatohepatitis.
The current study indicates that expression of caspase-3 as detected by immunohistochemical staining was significantly higher in NASH patients in comparison to patients with simple steatosis, demonstrating a powerful correlation between caspase-3 expression and degree of fatty liver. In addition, serum CK-18 levels were also found to be significantly higher in patients with steatohepatitis, with this increase being related to NAFLD activity score (NAS).
In accordance with our study, Chakraborty et al. reported that both caspase-3 and CK-18 have been well described in NAFLD and NASH, providing important insight into disease severity, and with proven sensitivity, particularly with regard to CK-18, enough to allow adequate distinction between cases of simple steatosis and more advanced steatohepatitis (29). Several studies have demonstrated significantly increased serum levels of CK-18 fragment in NASH versus non-NASH patients (9, 14). CK-18 was also found to correspond with disease severity as assessed by NAS scoring system, with positive correlation reported between CK-18 and NAS score, ballooning, Mallory bodies formation, steatosis, and fibrosis (30), as well fibrosis score (31). Moreover, the apoptotic marker, M30 antigen, was also shown to distinguish steatohepatitis from simple hepatic steatosis as well as being substantially correlated with the degree of hepatic fibrosis in patients with NAFLD (32).
Plotting of serum CK-18 levels against different pathological variables on ROC curve demonstrated a satisfactory relationship that allowed appropriate distinction between both entities of NAFLD with a cut off level of 260 U/L offering 76.4% sensitivity and 82.1% specificity with area under curve (AUC) 73.3% for differentiation between simple and steatohepatitis. Hence, measurement of CK-18 levels appears to be a useful and promising screening, diagnostic and staging biomarker in patients with NASH.
Several noninvasive methods have been proposed as a means of prediction or diagnosis NASH. One such approach involved calculating the sum of the risk factors to form a composite index (33), while another established a scoring system for NASH based on clinical parameters, such hypertension and diabetes, AST and ALT levels above 27 IU/L each, obstructive sleep apnea, and non-black race (34). In addition, the combination of markers of liver injury (AST, ALT) with markers of hyperglycemia (glycosylated hemoglobin, diabetes) has also been used to accurately indicate presence of NASH and fibrosis (35), while a new formula for prediction of NASH using ALT levels, fasting levels of C-peptide, and steatosis scores based on ultrasonographic findings has also been established (36). In an attempt to aid in the search for a precise tool to adequately elucidate the difference between the two described entities of NAFLD, this study group sought to propose a model using a number of simple readily available parameters to competently discriminate between simple steatosis and NASH. These parameters of highest significance in this study to be included in this logistic regression model were (age + platelet count + uric acid level + CK-18 + ALT level), with values in the range of 0.5 considered to be simple steatosis while those within the vicinity of 1 were more indicative of NASH. This model offered an overall predictability of 84% and an accuracy of 74.7%.
In conclusion, the detected higher serum level of CK-18 in NASH patients was correlated positively with NAS score, prompting the proposal of a model to predict presence of NASH in NAFLD patients utilizing several factors such as age, platelet count, uric acid, CK-18 and ALT levels, which offered an overall predictability of 84% and an accuracy 74.7%.
