1. Background
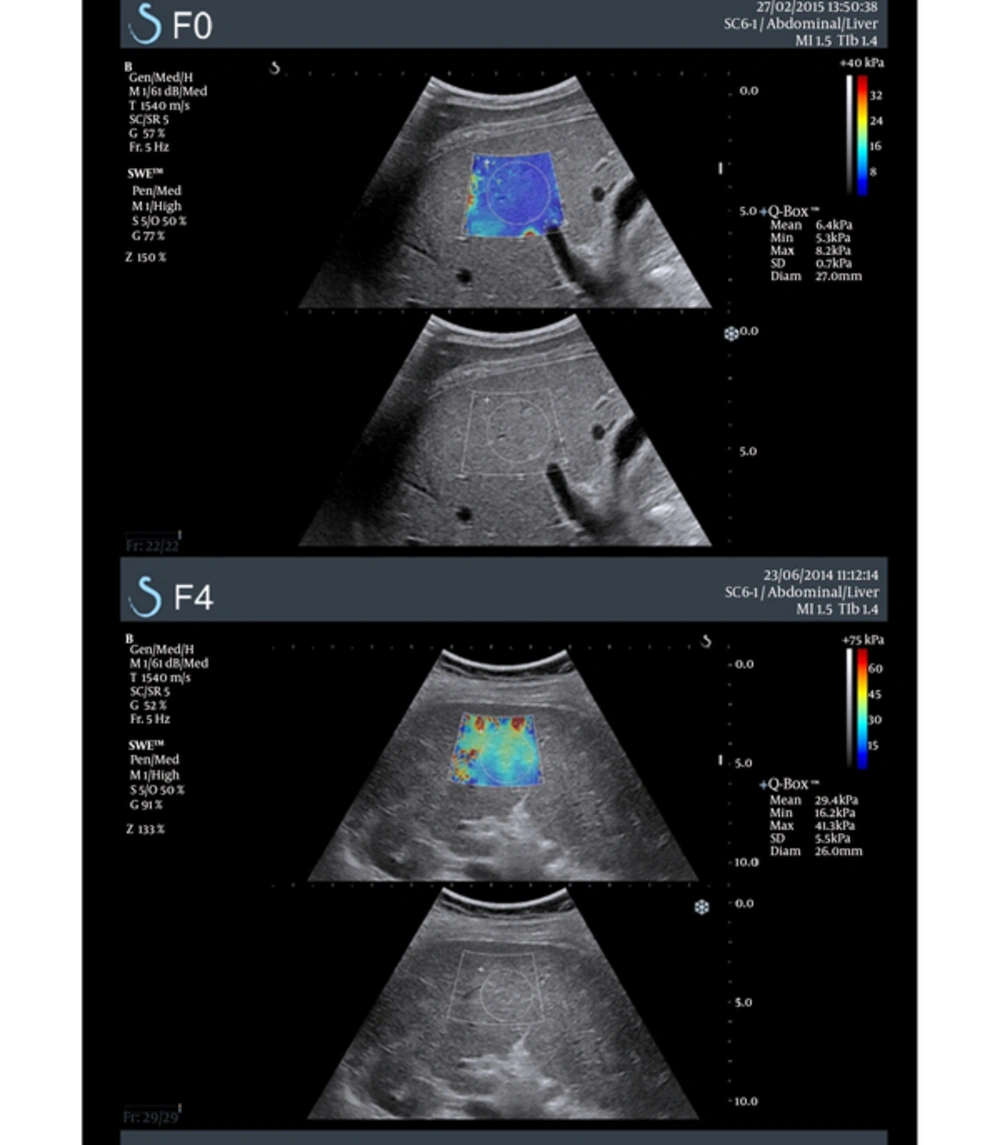
Hepatic fibrosis is part of chronic liver disorders such as chronic hepatitis, cirrhosis, or metabolic disorders. Evaluation of the advancement of liver stiffness can be provided using invasive or non-invasive methods. Liver biopsy (LB) has been the “golden standard” for many years. Because of its invasive character and limitations, other markers of hepatic fibrosis are taken into consideration (1, 2). The advancement in ultrasonic non-invasive techniques enables quick, repeatable, and reliable measurements (3-5). There are several ultrasound techniques. Transient Elastography (TE) is the first, popular ultrasound method used in the assessment of liver fibrosis without direct image guidance (3, 6). The Acoustic Radiation Force Impulse (ARFI) is the first two-dimensional technique that uses high-intensity acoustic pulses to estimate tissue stiffness (6, 7). Two dimensional shear wave elastography (2D SWE) is one of the newest elastography techniques (8). It allows estimating tissue elasticity quantitatively in kilopascals (kPa) or in meters per second. However, in the majority of the scientific publications, the tissue stiffness is expressed in kPa (Young modulus) (6, 9). The possibility of tissue stiffness real-time evaluation, as well as the information about morphology and elastic homogeneity within the region of interest (ROI), made 2D SWE as one of the most important techniques used in the non-invasive, non-traumatic assessment of the level of liver fibrosis (Figure 1) (5, 9).
Despite the research suggesting that there is no ideal operator-independence of 2D SWE, there are many studies confirming high repeatability, reproducibility, reliability, and applicability of 2D SWE in the liver fibrosis assessment (2, 10-12). In 2015, The Society of Radiologists in Ultrasound recommended the 2D SWE technique for the assessment of the liver in patients with HCV. The median of 10 valid measurements with the IQR/median value < 0.3 was approved as the most reliable technique in the assessment of liver fibrosis (6). In this study, the authors suggest investigating whether less than 10 measurements can be sufficient to assess stiffness of the liver properly. The newest EFSUMB guidelines and recommendations on the clinical Use of liver ultrasound elastography (2017) advise the use of at least three 2D SWE measurements and presentation of the results of liver stiffness as median with the interquartile range (13). The number of measurements of liver stiffness has been analyzed in numerous studies. The study by Sporea et al. on a population of 449 patients with and without liver disease revealed that 3 consecutive measurements of liver were sufficient to obtain an adequate average value in comparison with 5 measurements (14). There are several studies concerning the average 2D SWE value of the liver in healthy subjects (1, 4, 15-17). The study conducted by Feraioli and Leung revealed that there are different cut-off values in patients with hepatitis C and B that allows assigning them to different liver fibrosis stages according to the METAVIR Scoring System (4, 10, 12).
The main aim of this retrospective study was to determine whether the number of 2D SWE measurements could affect the evaluation of the stage of liver fibrosis in a healthy population and patients with chronic hepatitis B and C. We analyzed the difference between the results of the first measurement and the median value of the first three and all five measurements. Moreover, we considered the liver fibrosis stages according to the METAVIR scoring system (as it is of extreme clinical importance) and evaluated it against the statistical difference in assigning patients to those stages based on different numbers of measurements (4, 10, 13).
2. Methods
The study was approved by the local research ethics committee and the informed consent was waived because of the retrospective character of the study.
2.1. Patients’ Population
In this single retrospective hospital study, we analyzed the retrospective data of 642 patients who underwent a complex ultrasonic abdomen examination and liver 2D SWE examination between March 2011 and July 2015.
There were 347 patients with HCV, 158 with HBV, and 137 healthy subjects. The control group was composed of healthy patients: without any diagnosed liver diseases, with normal laboratory test findings, without liver enlargement, dilatation of vena portae, or without focal lesions in the liver. We did not exclude patients with mild liver steatosis observable in the ultrasound examination as we recognized them as an example of an ordinary population sample. Patients with known co-infection were not included in the research. Detailed information about the patients is presented in Table 1.
Patients with known HIV or with both hepatitis B and C viruses were not included in the study.
2.2. 2D SWE Acquisition
Shear wave elastography measurements were preceded by a complex ultrasonic abdominal examination. All of these examinations were performed using the Aixplorer system (Supersonic Imagine, Aix en Provence, France) with a C6-1 curvilinear probe. Liver 2D SWE examinations were performed over intercostal spaces with the patients’ arms behind their head. The patients were asked to hold breathing in a neutral position during each measurement. 2D SWE acquisitions were obtained under conditions as follows: from the right lobe of the liver, at least 1.5 cm below the liver capsule, from the area of the highest homogeneity of its elasticity (according to the color map of elasticity and standard deviation), and without large vessels. Each patient was provided with five subsequent measurements. Examinations were performed by two experienced abdominal radiologists with at least three years of experience in ultrasound elastography.
2.3. Statistical Analysis
The statistical analysis was performed using GraphPad Prism v. 6.0 (GraphPad Software, California, USA) and the MedCalc Software v. 17.6 (MedCalc program, Belgium). The Kolmogorov-Smirnov test was used to verify the normal distribution.
The analysis of the differences between median values of a particular number of measurements was performed using the Wilcoxon test. The median value of all five 2D SWE measurements was considered as most reliable. In addition, the comparison of the first measurement, the median values of the first three ones and the median values of the first five measurements were taken into consideration. The patients were divided into three groups: the control group (healthy subjects), patients with HBV (the second group), and patients with HCV infection (the third group). The interclass coefficient (ICC) was used to assess the consistency between different numbers of measurements. Good reproducibility was indicated by an ICC higher than 0.75. To analyze the impact of different numbers of measurements on the assignment to the stages of liver fibrosis according to the METAVIR scoring system, the chi-square test was used. The stages assessed based on all five measurements were considered as most reliable. For comparison, the stages of liver fibrosis assessed based on the first measurement and the median values of the first three measurements were applied. Patients with hepatitis B and C were analyzed separately. The cut-off values from the studies of Ferraioli et al. were applied (Table 2) (4, 12).
3. Results
3.1. Healthy Controls
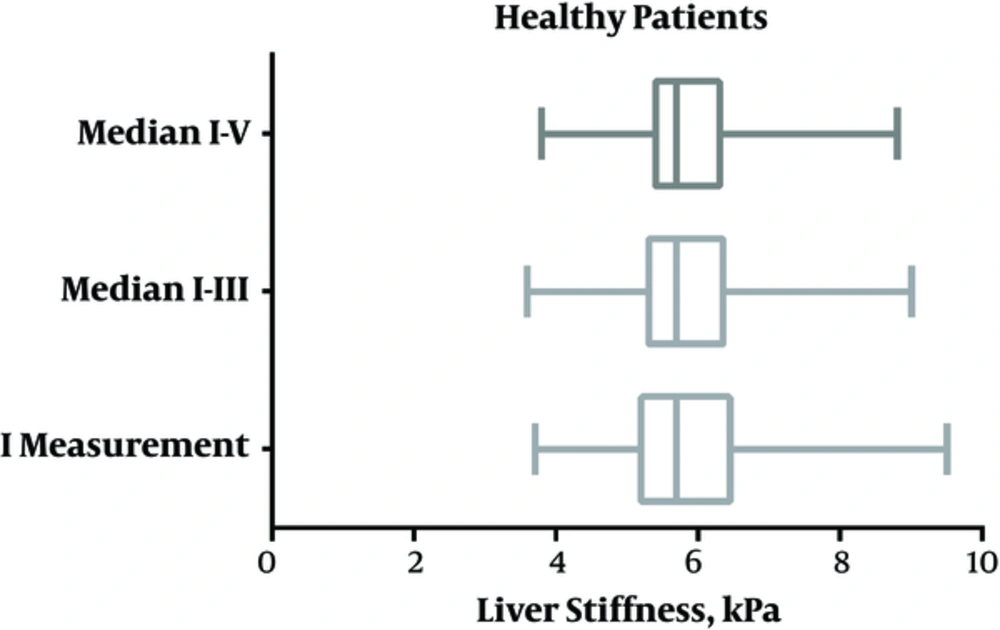
For the healthy controls (N = 137), the median value of the liver stiffness was 5.7 kPa (IQR = 0.9) and the mean value was 5.8 (SD = 0.75). It was 5.9 kPa (IQR = 0.97) for men (N = 92) and 5.5 kPa (IQR = 0.95) for women (N = 45). The liver stiffness in men was significantly higher than in women (P = 0.0062). There was a statistically significant correlation with age (P = 0.0268, R = 0.19) implying that older controls manifested higher values of liver stiffness. The comparison of the median values and IQR of the first measurement, the median of the first three measurements and the median of the first five measurements is shown in Figure 2. There was no statistical difference between the 2D SWE value of the first measurement and the median value of the first three and the first five measurements (P = 0.1692 (ICC = 0.87) and P = 0.1917 (ICC = 0.83), respectively) (Table 3).
| Parameter | First Measurement | Median of the First Three Measurements | Median of the First Five Measurements |
|---|---|---|---|
| Median | 5.70 | 5.70 | 5.70 |
| IQR | 5.20 - 6.45 | 5.30 - 6.35 | 5.40 - 6.30 |
| Min - Max | 3.70 - 9.50 | 3.60 - 9.00 | 3.80 - 8.80 |
| Mean | 5.77 | 5.81 | 5.81 |
| SD | 0.75 | 0.75 | 0.75 |
| P Value | 0.1692* | 0.7873*** | 0.1917** |
| ICC | 0.8703* | 0.9577*** | 0.8343** |
aP values refer to differences between the results of the first 2D SWE measurement and the first three* and the first five measurements**, and between the median value of the first three and all five measurements ***.
3.2. HBV Positive Patients
There was no statistical difference in liver stiffness between the 2D SWE value of the first measurement and the median value of the first three measurements (P = 0.1761, ICC = 0.9931), whereas the median value of the first five measurements was significantly higher than the value of the first measurement (P = 0.0401, ICC = 0.9884). There was no statistical difference in liver stiffness between the median value of the first three measurements and the median value of all five measurements (Table 4). Interestingly, the Interclass Correlation Coefficient revealed high repeatability between all the analyzed values (ICCI-III = 0.9931, ICCI-V = 0.9884, and ICCIII-V = 0.9967).
| Parameter | First Measurement | Median of the First Three Measurements | Median of the First Five Measurements |
|---|---|---|---|
| Median | 6.65 | 6.70 | 6.75 |
| IQR | 5.60 - 8.10 | 5.88 - 7.80 | 5.88 - 7.83 |
| Min - Max | 3.50 - 31.90 | 4.00 - 31.90 | 4.20 - 31.90 |
| Mean | 7.33 | 7.36 | 7.41 |
| SD | 3.24 | 3.10 | 3.09 |
| P Value* | 0.1761* | 0.0633*** | 0.0401** |
| ICC | 0.9931* | 0.9967*** | 0.9884** |
aP values refer to differences between the results of the first 2D SWE measurement and the first three * and the first five measurements**, and between the median value of the first three and all five measurements ***.
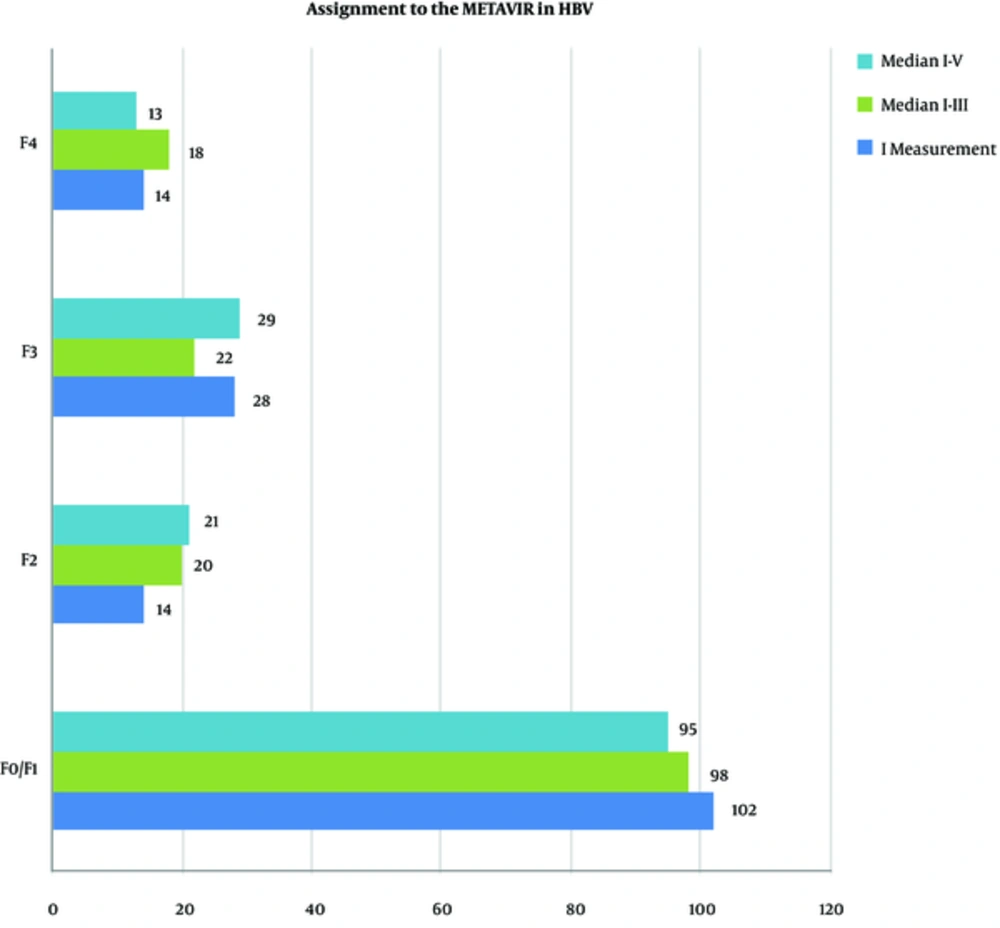
The analysis of the assignment to the METAVIR groups in patients with hepatitis B based on the value of the first 2D SWE measurement of the liver and the median value of the first three 2D SWE measurements revealed no statistical difference when compared to the assignment based on all five 2D SWE measurements of the liver (Figure 3).
3.3. HCV Positive Patients
There was no statistical difference between the 2D SWE value of the first measurement and the median value of all five liver measurements (P = 0.0837, ICC = 0.98). Interestingly, the Wilcoxon test showed a significant difference between the 2D SWE value of the first measurement and the median value of the first three measurements (P = 0.019); the median of the first measurement was higher with high ICC = 0.98. There was no statistical difference in liver stiffness between the median value of the first three measurements and the median value of all five measurements (Table 5).
| Parameter | First Measurement | Median of the First Three Measurements | Median of the First Five Measurements |
|---|---|---|---|
| Median | 7.70 | 7.60 | 7.60 |
| IQR | 6.40 - 10.20 | 6.50 - 10.10 | 6.50 - 10.00 |
| Min - Max | 3.90 - 44.10 | 4.60 - 41.30 | 4.60 - 37.70 |
| Mean | 9.04 | 9.19 | 9.14 |
| SD | 4.56 | 4.68 | 4.53 |
| P Value* | 0.0199* | 0.5619*** | 0.0837** |
| ICC | 0.9860* | 0.9959*** | 0.9879** |
aP values refer to differences between the results of the first 2D SWE measurement and the first three * and the first five measurements**, and between the median value of the first three and all five measurements ***.
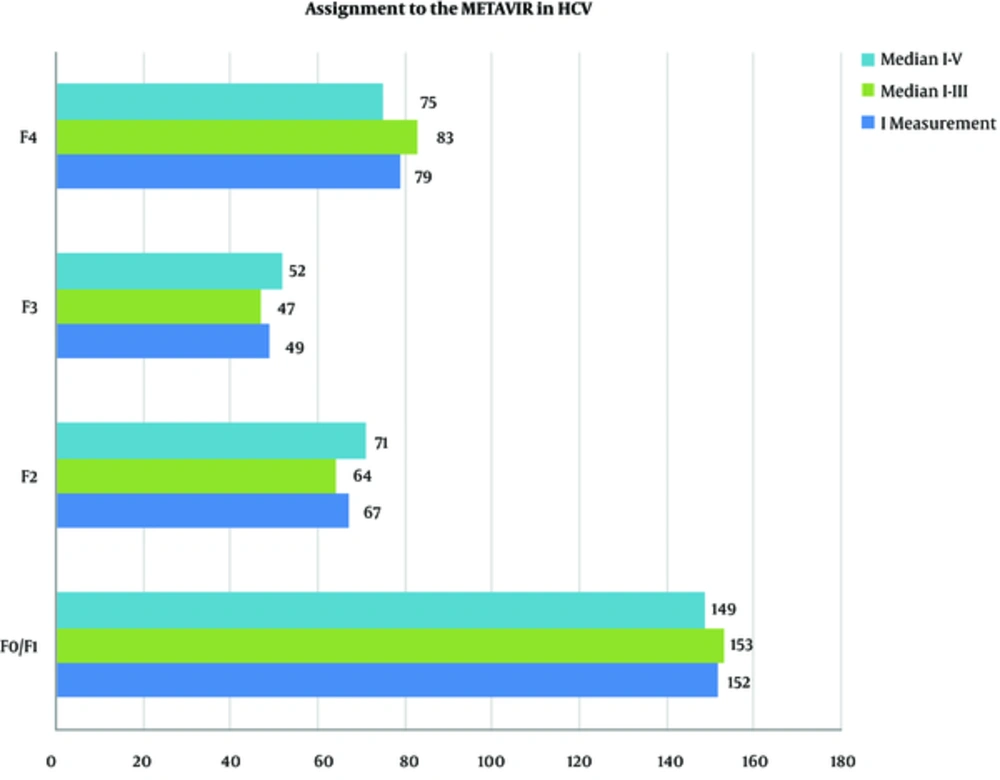
The analysis of the assignment to the METAVIR groups in patients with hepatitis C with respect to the value of the first 2D SWE measurement of the liver and the mean value of the first three 2D SWE measurements revealed no statistical difference in comparison with the assignment of patients with respect to all five 2D SWE measurements of the liver (Figure 4).
4. Discussion
The median and mean values of liver stiffness reported in our study are higher than in other studies (Tables 3 to 5). In the healthy population, the median value of the liver stiffness was 5.7 kPa (IQR = 0.9) and the mean value was 5.8 (SD = 0.75), whereas Arda et al. reported the mean value of liver stiffness in healthy volunteers at the level of 4.0 kPa +/-2.2, Cha et al. reported the level of 5.4 kPa +/-1.2, Huang et al. at the level of 5.1 kPa +/-1, and Leung et al. at the level of 5.5 kPa +/-0.7 (1,4,15,17). Arda et al. and Cha et al. reported no statistically significant difference between gender or age and liver stiffness (1, 15). Moreover, Huang et al. noticed statistically higher values in men than in women with no difference concerning age, whereas Leung et al. reported higher values of liver stiffness in men than in women but without information about age. In our study, there was a statistically significant difference in 2D SWE values of liver stiffness associated with gender and age (4, 17). Men exhibited the stiffer liver than women (N = 5.9 kPa vs. N = 5.5 kPa) and liver stiffness increased with age (P = 0.0268, R = 0.19). However, the part of our study concerning healthy subjects presented some limitations. First, inclusion in the control group was mainly based on anamnesis. Furthermore, we did not exclude patients with slight steatosis of the liver. It may be claimed that this is the main reason for slightly higher median values in our study as compared to the other studies. However, we do believe that the positive correlation of liver stiffness with age accompanied by the observation that men had the stiffer liver than women was not influenced by those limitations. These correlations may be connected with a longer or more intensified exposure to hepatotoxic substances (e.g. alcohol, solvents) in older patients and men (e.g. due to occupation). Nevertheless, these differences in average values regarding healthy subjects may not represent an important clinical impact. It is necessary to evaluate the 2D SWE values of the liver in conjunction with clinical information. Different cut-off values are observed in patients with HCV and HBV (1, 5). Furthermore, there are discrepancies in studies that attempt to evaluate the cut-off values for patients with HCV (5, 10).
The results of the analysis of differences in 2D SWE values and METAVIR assignment based on the number of measurements may be claimed as surprising. We observed no statistical difference between the median value of all five measurements and the 2D SWE value of the first measurement as well as in comparison with the median 2D SWE value of the first three and five measurements. We are far from suggesting that only one measurement is reliable and we agree with the statement that at least three 2D SWE measurements should be performed (13, 14). Only one measurement probably could be sufficient as the screening tool for liver stiffness in the routine ultrasound abdominal examination in the general population. However, our results prove that 2D SWE is a respectfully accurate and reliable method. Moreover, our analysis takes into consideration different types of patients, not only healthy volunteers with relatively low 2D SWE values but also patients with liver fibrosis and liver cirrhosis. Therefore, the results seem to be helpful when taking a series of successful measurements may be difficult to accomplish (e.g. due to obesity or ascites).
4.1. Conclusions
Different numbers of 2D SWE measurements did not influence the assessment of the liver elasticity in healthy patients. Although the number of 2D SWE measurements has a statistically significant impact on the eventual SWE value (using median value), it does not affect the final METAVIR assignment, which is of the highest clinical importance. According to the EFSUMB Guidelines, at least three 2D SWE measurements presented as the median value should be used to assess liver stiffness properly in patients with chronic liver diseases. What is more, our study revealed that 2D SWE is sufficiently robust in terms of assigning to the METAVIR scale even when only one measurement is taken.


