1. Background
Liver cancer is a lethal disease and major health threat in all communities. Patients with liver cancer survive for less than 1 year (1, 2). Further, it is the fourth major cause of cancer-related mortality in the world (3).
According to the 2015 global burden of diseases (GBD) study, liver cancer mortality rate doubled from 1990 to 2015 worldwide (4). This increasing trend of liver cancer mortality is even more remarkable in developing countries, which have inadequate diagnostic tools and inefficient treatment policies (5). People in developing countries, largely in Asian continent, are at a higher risk for liver cancer than people in western countries. Moreover, liver cancer is more prevalent (five to 10 times) in these regions (2, 4, 6). Recent increases in the incidence and mortality of liver cancer can be attributed to alcoholism (7), viral hepatitis infections (2, 8), and non-alcoholic fatty liver disease (NAFLD) (9), which is a consequence of lifestyle changes over time. These changes have resulted in a significant increase in the incidence of liver cancer worldwide.
Although the steps to reduce liver cancer have been discussed previously (10), to the best of our knowledge, comprehensive population-based studies or precise published evidence on the mortality rate in liver cancer by cause are lacking at the national and provincial levels in Iran.
2. Objectives
To estimate liver cancer mortality rate, this study aimed to demonstrate the epidemiologic trend of liver cancer mortality rate by sex, age, and geographical distribution from 1990 to 2015.
3. Methods
3.1. Sources of Data
We used the data from the Iranian death registration system (DRS) collected through the national and subnational burden of diseases (NASBOD) project (11), after addressing DRS incompleteness and misclassification and using demographic and statistical methods, to estimate the liver cancer mortality rates. In addition, the data on the age and sex distribution of the Iranian population and urbanization ratio were extracted from the national censuses, which were conducted by the statistical centre of Iran (12). Moreover, covariates such as years of schooling and wealth index were calculated from the household expenditure and Income Surveys from 1990 to 2010, which were conducted by the statistical center of Iran (12). Finally, we evaluated the annual liver cancer mortality rates, as well as its patterns, and temporal trends, between 1990 and 2015. For the first time, we collected detailed data on hepatitis B and C and alcohol consumption at the national and provincial levels in Iran.
3.2. Definition
We used the 10th version of international classification of diseases (ICD10) codes for defining the underlying causes of death (13). These codes were based on the diagnoses by physicians who completed the death certificates, and there were no criteria applied to evaluate the ability of physicians. Data from the ICD 10 codes were transformed to GBD by a physician and verified by a senior physician. A percentage of deaths in the subgroups C22-24 (malignant neoplasm of liver and intrahepatic bile ducts) were proportionally redistributed into liver cancer due to hepatitis B, C, alcohol use, and other causes. These proportions were calculated based on the data from the GBD 2010 study (14). The data collected from the 2015 population in Iran were used as the standard population in a direct age-standardized approach to facilitate the statistical comparisons between the provinces.
3.3. Demographic Modeling
A demographical model was used to solve the problem of the incompleteness of data in the Iranian death registration system. To estimate child mortality, the complete birth history (CBH) and summary of birth history (SBH) were used. To analyze SBH, the maternal age cohort (MAC) and maternal age period (MAP) methods were applied. The generalized growth balance (GGB), synthetic extinct generation (SEG), and a mixture of the two methods (GGB-SEG) were used for estimating the incompleteness of the data on adult mortality. More detailed information on this model has been reported previously (15, 16).
3.4. Statistical Modeling
Concisely, a two-stage model, incorporating the spatiotemporal and Gaussian process regression models (GPR), was used to estimate mortality rates. The age-spatio temporal model solves the problem of misalignment in the age and space and time of data, then GPR is employed to extrapolate all-cause (age- and sex-specific) mortality rates with a more reliable uncertainty during the mentioned time span (17, 18). Then, the fraction of each cause of death was exerted in the all-cause mortality and extrapolated using the spatiotemporal model. In addition, a simulation was conducted to estimate the uncertainty of predicted values. This combined algorithm is a valid statistical method that has been described previously (19).
Addressing misclassification: to estimate the mortality rates by cause, all-cause mortality rates were initially computed via the mentioned statistical method, and then, divided into cause-specific rates in proportion to the cause fractions extracted from the original data. More detailed information is available elsewhere (20). All graphs and plots were set using R statistical software, version 3.1.2 (21). In addition, the direct age-standardized approach was applied using the Epitools package in R (22).
4. Results
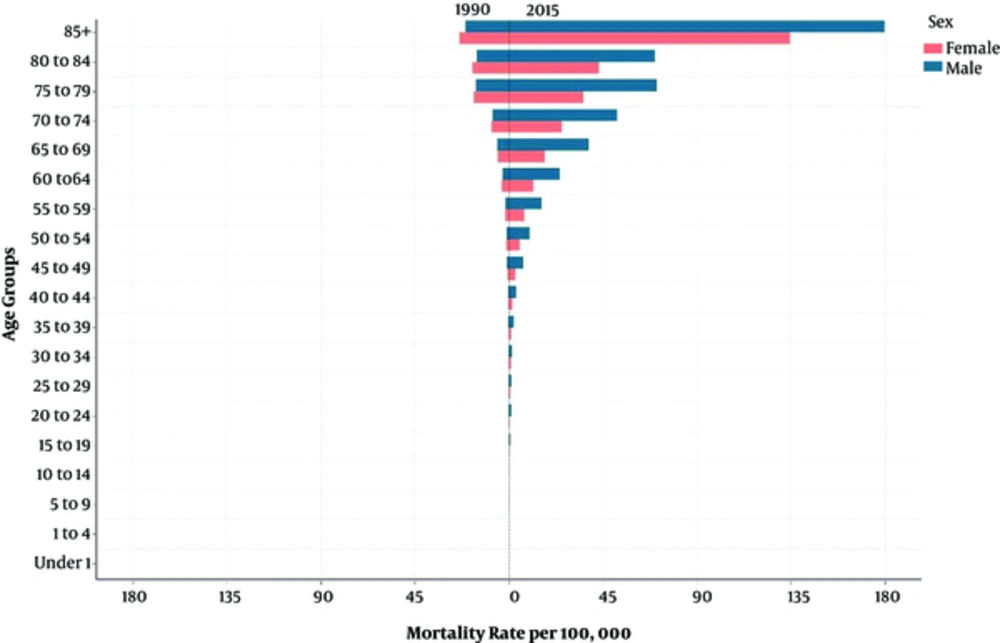
Generally, the age-standardized liver cancer mortality rate in Iran increased more than four times from 1.18 (95% uncertainty interval: 0.86 to 1.61) deaths per 100,000 persons in 1990 to 5.66 (4.20 to 7.63) deaths per 100,000 persons in 2015 (Table 1). Similarly, the number of deaths from liver cancer also had an increasing pattern (supplementary file Appendix 1, 2). From 1990 to 2015, the male to female sex, age-standardized mortality ratio changed from 0.87 to 1.82. With increasing age, the liver cancer mortality rate increased in both sexes. In 1990, the maximum liver cancer mortality rate was observed among people older than 85 years of age, and it was 22.41 (95% uncertainty interval: 16.48 to 30.49) per 100,000 persons, which increased to 158.15 per 100,000 persons (95% uncertainty interval: 118.3 to 211.31) in 2015 (Figure 1). In addition, the percentage change in the liver cancer mortality rates from 1990 to 2015 increased in all age groups. The percentage change was 515.07% in patients 30 to 35 years of age and 605.83% in patients older than 85 years of age (Table 2).
| National/Sub-National | 1990 | 2010 | 2015 | % Δ 1990 to 2015 |
|---|---|---|---|---|
| Iran | 1.18 (0.86-1.61) | 5.97 (4.52 - 7.9) | 5.66 (4.2 - 7.63) | 381.79 |
| Markazi | 1.45 (1.07 - 1.95) | 8.79 (6.82 - 11.32) | 8.79 (6.82 - 11.32) | 506.06 |
| Gilan | 1.45 (1.08 - 1.95) | 6.94 (5.3 - 9.09) | 6.92 (5.2 - 9.2) | 377.48 |
| Mazandaran | 1.27 (0.93 - 1.74) | 6.57 (4.82 - 8.93) | 6.4 (4.57 - 8.92) | 403.05 |
| Azarbaijan East | 1.68 (1.26 - 2.23) | 7.68 (5.99 - 9.85) | 6.95 (5.34 - 9.03) | 313.58 |
| Azarbaijan West | 2.01 (1.48 - 2.73) | 6.03 (4.78 - 7.6) | 5.24 (4.08 - 6.72) | 160.88 |
| Kermanshah | 1.17 (0.89 - 1.55) | 7 (5.51 - 8.92) | 6.83 (5.28 - 8.84) | 481.92 |
| Khuzestan | 0.63 (0.47 - 0.83) | 4.47 (3.48 - 5.73) | 4.7 (3.6 - 6.13) | 646.99 |
| Fars | 0.95 (0.71 - 1.26) | 4.89 (3.78 - 6.34) | 5.1 (3.84 - 6.75) | 438.06 |
| Kerman | 1.39 (1.06 - 1.83) | 4.72 (3.7 - 6) | 4.36 (3.35 - 5.69) | 213.60 |
| Khorasan, Razavi | 1.25 (0.94 - 1.67) | 7.08 (5.4 - 9.26) | 6.22 (4.66 - 8.29) | 396.41 |
| Isfahan | 1.01 (0.74 - 1.4) | 6.37 (4.78 - 8.5) | 6.6 (4.86 - 8.94) | 551.35 |
| Sistan and Baluchestan | 0.65 (0.44 - 0.95) | 3.13 (2.29 - 4.27) | 2.96 (2.15 - 4.08) | 358.74 |
| Kordestan | 1.8 (1.29 - 2.51) | 7.4 (5.9 - 9.28) | 6.3 (4.91 - 8.08) | 251.02 |
| Hamedan | 1.29 (0.99 - 1.68) | 7.79 (6.23 - 9.75) | 7.88 (6.16 - 10.07) | 508.98 |
| Chahar Mahal and Bakhtiari | 1.2 (0.9 - 1.6) | 5.78 (4.53 - 7.36) | 5.9 (4.55 - 7.64) | 390.29 |
| Lorestan | 1.45 (1.06 - 1.97) | 6.12 (4.89 - 7.64) | 5.07 (3.96 - 6.48) | 250.30 |
| Ilam | 1.31 (0.95 - 1.79) | 6.43 (4.91 - 8.41) | 6.38 (4.8 - 8.46) | 387.38 |
| Kohgiluyeh and Boyer - Ahmad | 1.26 (0.89 - 1.78) | 5.41 (4.07 - 7.2) | 4.76 (3.53 - 6.4) | 278.26 |
| Bushehr | 0.76 (0.55 - 1.05) | 4.67 (3.57 - 6.08) | 4.73 (3.52 - 6.35) | 522.59 |
| Zanjan | 2.1 (1.48 - 2.98) | 4.73 (3.41-6.56) | 3.52 (2.36-5.23) | 67.58 |
| Semnan | 1.22 (0.86 - 1.73) | 7.79 (5.85-10.34) | 7.87 (5.82-10.62) | 545.98 |
| Yazd | 1.44 (1.08 - 1.93) | 6.45 (4.96-8.37) | 6.34 (4.78-8.4) | 339.84 |
| Hormozgan | 0.52 (0.37 - 0.73) | 3.51 (2.64-4.67) | 4.15 (3.01-5.71) | 698.24 |
| Tehran | 0.91 (0.6 - 1.39) | 5.34 (3.62-7.86) | 4.71 (3.15-7.02) | 415.88 |
| Ardebil | 1.42 (1.05 -1.91) | 6.08 (4.84-7.63) | 5.72 (4.46-7.32) | 303.54 |
| Qom | 1.06 (0.72 - 1.54) | 4.95 (3.53-6.91) | 4.66 (3.3-6.57) | 341.14 |
| Qazvin | 1.31 (0.98 - 1.75) | 7.58 (6.02 - 9.54) | 6.94 (5.4 - 8.91) | 431.25 |
| Golestan | 0.99 (0.75 - 1.31) | 6.7 (5.24 - 8.55) | 7.12 (5.44 - 9.29) | 619.37 |
| Khorasan, North | 1.87 (1.36 - 2.57) | 7.07 (5.43 - 9.21) | 6.27 (4.7 - 8.34) | 234.98 |
| Khorasan, South | 1.78 (1.3 - 2.44) | 8.54 (6.48 - 11.24) | 7.96 (5.93 - 10.65) | 348.64 |
| Alborz | 0.61 (0.43 - 0.87) | 5.47 (4.07 - 7.34) | 5.81 (4.25 - 7.93) | 846.72 |
Global and Iran Province-Level Age Standardized Mortality Rate (per 100,000) for Both Sexes and Percent Change (Δ)
| Age Group | Mortality Rate 1990 | Mortality Rate 2015 | Percent Change |
|---|---|---|---|
| 5 to 9 | 0.05 (0.03 - 0.08) | 0.18 (0.12 - 0.28) | 270.1 |
| 10 to 14 | 0.06 (0.04 - 0.09) | 0.23 (0.15 - 0.35) | 293.31 |
| 15 to 19 | 0.08 (0.05 - 0.11) | 0.46 (0.32 - 0.67) | 511.28 |
| 20 to 24 | 0.12(0.08 - 0.18) | 0.77 (0.55 - 1.08) | 538.07 |
| 25 to 29 | 0.15(0.1 - 0.22) | 0.92 (0.65 - 1.3) | 527.15 |
| 30 to 34 | 0.19(0.13 - 0.27) | 1.14(0.82 - 1.6) | 515.07 |
| 35 to 39 | 0.28 (0.19 - 0.39) | 1.75 (1.27 - 2.39) | 530.27 |
| 40 to 44 | 0.43 (0.31 - 0.6) | 2.48 (1.82 - 3.36) | 477.37 |
| 45 to 49 | 0.79 (0.57 - 1.1) | 4.89 (3.61 - 6.6) | 516.49 |
| 50 to 54 | 1.22 (0.89 - 1.68) | 7.47 (5.53 - 10.12) | 511.7 |
| 55 to 59 | 1.7 (1.23 - 2.36) | 11.53 (8.48 - 15.65) | 576.98 |
| 60 to 64 | 3.19 (2.32 - 4.4) | 17.45 (13 - 23.47) | 446.29 |
| 65 to 69 | 5.48 (4.01 - 7.5) | 26.46 (19.87 - 35.25) | 382.67 |
| 70 to 74 | 8.18 (6.04 - 11.09) | 37.61 (28.43 - 49.87) | 359.82 |
| 75 to 79 | 16.31 (12 - 22.18) | 53.34 (39.87 - 71.33) | 227.1 |
| 80 to 84 | 16.51 (12.26 - 22.23) | 55.71 (41.59 - 74.59) | 237.48 |
| 85 and more | 22.41 (16.48 - 30.49) | 158.15 (118.3 - 211.31) | 605.73 |
Percent Change Mortality Rate From 1990 to 2015 in National Level By Age Group
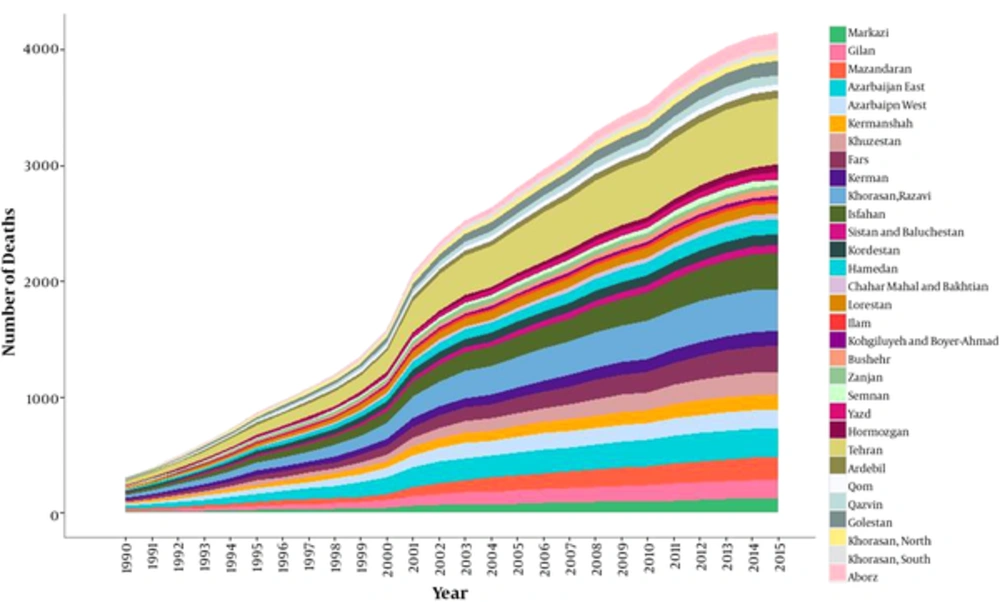
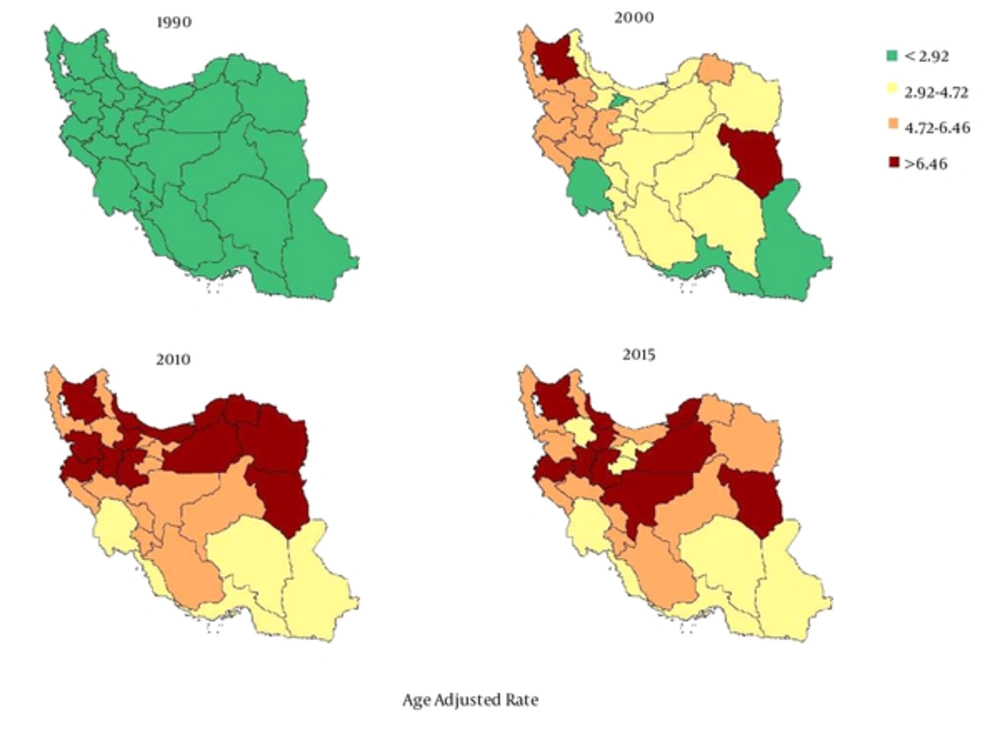
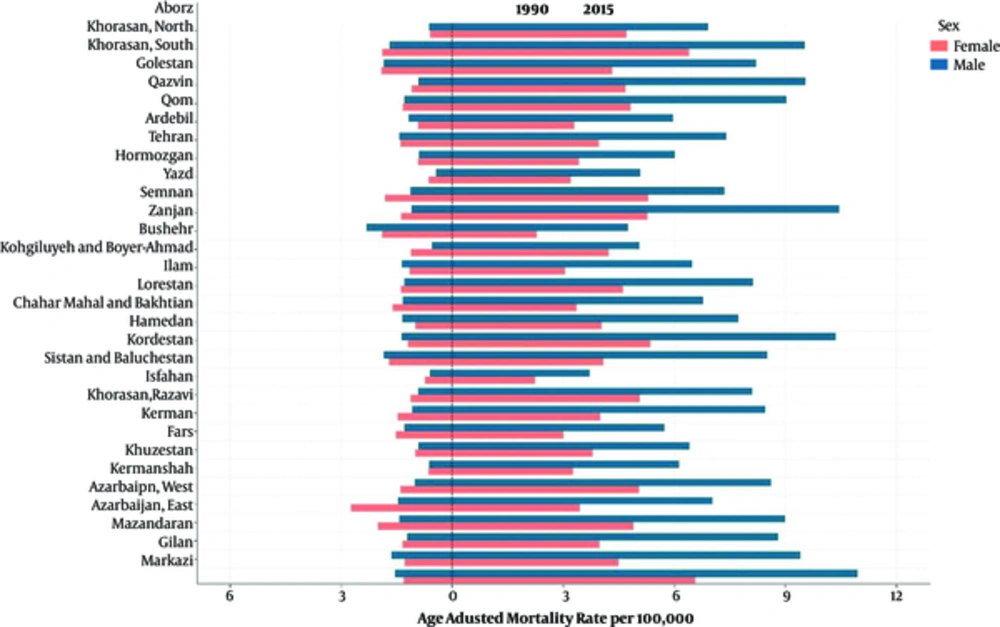
At the provincial level, the highest and lowest age-standardized mortality rates for liver cancer in 2015 was 8.79 (95% uncertainty interval: 6.82 to 11.32) and 2.96 (95% uncertainty interval: 2.15 to 4.08), respectively. These rates represent a 2.96 times greater rate in 2015 than in 1990. The trend for the liver cancer mortality rate has obviously been increasing in all provinces during the 26 years of the study (Figure 2). The percentage change in the age-standardized mortality rate at the provincial level varied between 846.72% and 67.58%. In addition, the average mortality rate slope has a diversion of 5.16 times in some provinces during the 26-year study period. (Table 1 and Figure 3). The age-adjusted liver cancer mortality rate at the provincial level was higher in men than in women in 2015. The ratio nearly doubled in most provinces (Figure 4).
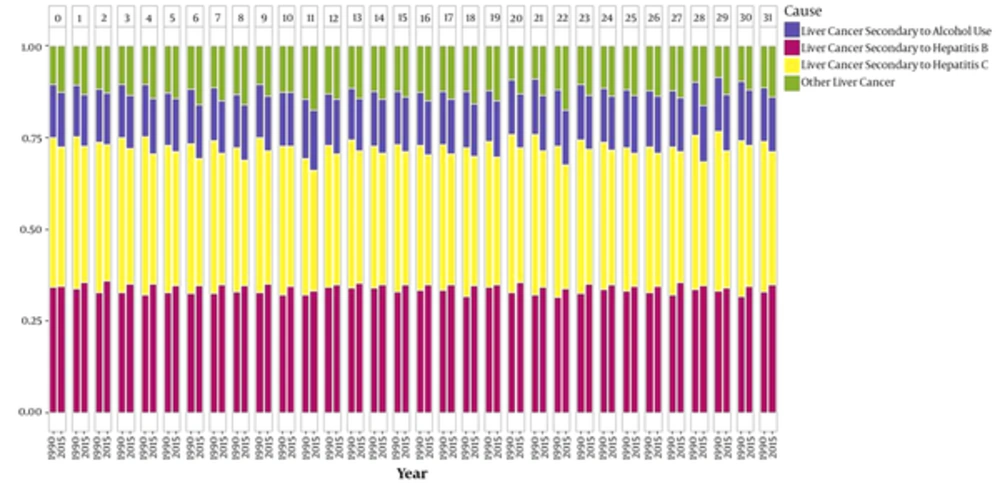
Generally, about 71% of liver cancer mortality cases at the national level are due to hepatitis B and C infections. On average, the liver cancer mortality rate due to hepatitis B was approximately equal to that of hepatitis C (Figure 5). The liver cancer mortality trend due to hepatitis B increased from 0.39 per 100,000 persons in 1990 (95% uncertainty interval: 0.28 to 0.54) to 2.02 (95% uncertainty interval: 1.49 to 2.72) per 100,000 persons in 2015. It had an increasing trend in all age group and both sexes. The male-to-female sex ratio of liver cancer mortality rate due to hepatitis B changed from 1.24 to 2.53 during the 26-year study period. (Figure 5, supplementary file Appendix 1). The trend of liver cancer mortality due to hepatitis C increased from 0.49 (95% uncertainty interval: 0.35 to 0.67) per 100,000 persons in 1990 to 2.10 (95% uncertainty interval: 1.56 to 2.82) per 100,000 persons in 2015. It had an increasing trend in all age groups and both sexes. We could detect a higher liver cancer rate in provinces such as Golestan that have a high prevalence of HBV, but there were exceptions noted in the provinces of Sistan and Baluchestan. The male-to-female sex ratio of age-standardized liver cancer mortality rate due to alcohol consumption and hepatitis C, respectively, increased from 0.91 and 0.68 to 1.71 and 1.46 during the 26-year study period.
0-Markazi, 1-Gilan, 2-Mazandaran 3-Azarbaijan East, 4-Azarbaijan West, 5- Kermanshah, 6-Khuzestan, 7-Fars, 8-Kerman, 9-Khorasan, Razavi, 10-Isfahan, 11-Sistan and Baluchestan, 12-Kordestan, 13-Hamedan, 14-Chahar Mahal and Bakhtiari, 15-Lorestan, 16-Ilam, 17-Kohgiluyeh and Boyer-Ahmad, 18-Bushehr, 19-Zanjan, 20-Semnan, 21-Yazd, 22-Hormozgan, 23-Tehran, 24-Ardebil 25-Qom, 26-Qazvin, 27-Golestan, 28-Khorasan, North, 29-Khorasan, South, 30-Alborz, 31-Iran.
4. Discussion
This study showed that the trend of age-standardized liver cancer mortality rate at the national level increased more than four times from 1990 to 2015 in Iran. An increasing trend in almost all the provinces was observed. In addition, liver cancer due to hepatitis B, hepatitis C, alcohol consumption, and other causes, similarly, had an increasing trend during the 26-year study period. Majority of liver cancer mortality rate at the national level is due to hepatitis B and C infection. The increase in liver cancer mortality was observed in all ages and both sexes. In recent years, the mortality rate has been higher in male patients than in female patients at the national and provincial levels.
To validate the results, we used the most up-to-date demographic and statistical modeling to address the incompleteness (15), misclassification, and cause-distribution of the mortality data (19, 20, 23). The results of this study are in line with the findings of previous national and international studies and reports in Iran and the world (4, 24-26). An increasing trend of liver cancer mortality has been reported in the United States, Japan, Australia, Scotland, France, and Italy, while a decreasing trend has been observed in the United Kingdom in both sexes (24, 27). An upward trend in all-cause liver cancer mortality, particularly in older age groups, has been reported in the mentioned countries (28). The results of our study at the national level are consistent with the findings of a previous study in Iran, which reported an increase in the pattern of liver cancer mortality among people aged 70 years and older. The mortality rate was 3.7 per 100,000 persons. The trends were higher in men than in women, as the male-to-female sex mortality ratio was 1.5, which is compatible with our results for this province. However, the mentioned study did not assess the risk factors and incompleteness of the mortality data (24). In 2009, the estimated national cancer mortality rate was 4.7 per 100,000 persons (29). The age-standardized liver cancer incidence rate per 100,000 persons was 2.3 (95% uncertainty interval: 1.9 to 2.6) in men and 1.6 (95% uncertainty interval: 1.2 to 1.9) in women in Fars province in 2002. According to the mentioned report, the rate of liver cancer incidence had an increasing trend, but it did not report the mortality rate (30). As the survival of liver cancer is shorter than a year, we expect to have the same trends of incidence and mortality. Studies showed that globally the incidence of liver cancer is two times higher in men than in women (31). The differences between liver cancer mortality patterns in the two sexes, which were observed in this study, are in line with our expectations (male-to-female sex ratio = 1.82). In addition, according to a previous study in Iran, the trend of hepatitis C as the main risk factor for liver cancer has increased more in men than in women (32), which is parallel to our findings. Apparently, the differences between the two sexes in terms of the liver cancer mortality pattern are similar in Iran and European countries (28). Similar to our study, reports from Asia have shown that the liver cancer mortality rate is 14.5 and 6.1 per 100,000 in men and women, respectively (33). The rate of liver cancer demonstrates an increasing trend until 50 years of age, and it may peak or plateau after that in high risk regions like Southeast Asia or West Africa. The trend of increasing liver cancer incidence and mortality with increasing age is seen in Italy, United Kingdom, and white Hispanic ethnic group, parallel to this study. However, there was no explanation for the increased rate in older age groups. Globally, the sex ratios of liver cancer incidence, range from 1.4 to 3.34. The highest sex ratio was observed, in particular, among those aged 60 to 70 years (27).
A study on the mortality of patients with liver cancer was conducted in Iran in 2004, and its results were was consistent with this study’s findings on the sex ratio and increasing pattern of liver cancer mortality with increasing age. This study indicated that even though Iran is in a low-risk region for liver cancer, 40% of the liver cancer cases might be under-reported. However, it did not address the cause of upward trend of liver cancer in the elderly age groups (34). In addition, a similar pattern was reported in the Khuzestan province, which was similar to this study (35). However, there were no reports on the other provinces in Iran. It is recommended for future studies to assess the policies of the provinces that have both a high liver cancer mortality rate and a lower prevalence of hepatitis B and C infections such as the provinces of Sistan and Baluchestan for better national policy making.
The main etiology of primary liver cancer is hepatitis B and C, alcohol consumption, and other risk factors, including obesity. The attributed effects of risk factors vary across different regions, depending on the epidemiologic distribution and prevalence of the risk factors in each region (25, 27, 30, 36-38). In the United States, Europe, and Japan, 22% of the cases of primary liver cancer are attributed to hepatitis B, while 60% are attributed to hepatitis C, and 43% are attributed to alcohol consumption. In contrast, in Asia and Africa, this pattern is completely different which is due to a high prevalence of chronic viral infections. The attributed shares of hepatitis B, hepatitis C, and alcohol consumption in the incidence of liver cancer are 60%, 20%, and 20%, respectively. This pattern is almost in line with the results of this study in Iran (27). The main cause of liver cancer in Saudi Arabia, according to different studies, was hepatitis C. Hepatitis B was the main cause of liver cancer in Yemen and Lebanon. Other Arabic countries, such as Iraq, have no qualified studies on this issue. In neighboring countries of Turkey, Pakistan, and Afghanistan, the main etiology of liver cancer is different. In Pakistan, before 1998, the main cause was hepatitis B. After that time, a transition to hepatitis C as the main cause was observed. In Turkey, similar to Iran, the main cause of liver cancer was initially hepatitis B, and then, it was hepatitis C. Unfortunately, Afghanistan, similar to Iraq, had no validated studies on this issue. In Iran, we could not find a comprehensive study on the risk factors of liver cancer. However, there was a study in one of the southern provinces of Iran in 2005, which indicated that the main cause of liver cancer was hepatitis B, and the other risk factor were predominantly seronegative. In North African countries the main cause was predominantly hepatitis C, especially in Egypt, which is the leading country in the world for the rate of hepatitis C-seropositivity. The only exception was Sudan; the main causes in this country were the seronegativity rate of HBV or HCV and number of patients with hepatitis B (39, 40). As the hepatitis B vaccination program has been operating in Iran for more than two decades, there is a very low risk of incidence of liver cancer due to hepatitis B infection during childhood. The majority of chronic cases of hepatitis infection occurring during early adulthood and older ages are due to unsafe sexual contacts and blood transfusion or other invasive procedures performed under unsterile conditions (41, 42).
Liver cancer mortality is a function of long-term alcohol consumption. Alcohol consumption is expected to have an impact on people of older ages because of the cumulative effect of alcohol on liver cancer (31). This cumulative effect depends on the development of alcohol consumption epidemiology, and in Iran, this epidemiology has not been developed due to Islamic laws, so alcohol is not a major concern (43). Chronic hepatitis B and C infections are still among the predominant causes of liver cancer in Iran. As liver cancer mortality is increasing in most of the provinces of Iran, particularly, in men and older age groups, it is important to adopt screening measures earlier (10) and to establish more effective preventive or treatment policies, especially for high-risk groups. As an effective strategy for controlling the upward trend of liver cancer mortality is the early screening of high-risk population groups. Effective screening of patients with hepatitis B and C or alcoholic cirrhosis could result in the detection of liver cancer during the early stages. Another strategy is antiviral therapy, which has been shown to have a significant effect on reducing liver cancer by full remission of hepatitis C (44). However, this treatment method is expensive for the public, and cost reduction should be considered by policy makers. Hepatitis treatment plays a major role in our country. It is estimated that over 15% - 40% of hepatitis B-infected patients in Iran are at risk for the development of cirrhosis and liver cancer (24, 45). The third strategy is hepatitis B vaccination. It reduced liver cancer incidence rate by 80% among the younger generation in Taiwan (46). However, the impact of this intervention is not reported in other Asian countries. It is probably because the program has been recently introduced (47). However, it has been suggested that the policies in Saudi Arabia for controlling hepatitis B may be causing a shift to hepatitis C as the main cause of liver cancer (39). The vaccination program against hepatitis B in Iran has reached a coverage level of 94% (25, 48), but its main effects on liver cancer mortality are expected to emerge in the future. The utilization of treatment protocols could be more effective in this situation and may reduce liver cancer mortality (24). In Iran, alcohol consumption is forbidden, so we do not have a reliable report on alcohol consumption, and most drinkers use handmade, low-quality alcohol. Programs to limit or stop alcohol consumption need to be established for the public to increase the awareness about this risk factor, apart from the national laws. Increasing knowledge may also be applied for dealing with low-fat diet intake. At last, promoting a healthy lifestyle is another preventive measure (43, 49). The epidemiologic changes of obesity and NAFLD, especially in developing countries, must be considered for future policy making in controlling liver cancer due to seronegativity, especially in the developing countries of the Middle East, like Turkey (50). However, the metabolic risk factors associated with liver cancer were not assessed in Iran. It is suggested to develop future studies to assess these factors as well.
This study had some limitations. First, incompleteness and misclassifications are commonly observed in mortality data, especially in low-quality registries; however, using the proper registration methods and appropriate diagnostic tools and treatments, misclassification and incompleteness can be minimized. A low incidence of liver cancer is found in both metastatic and primary cancers (27, 51). Further, given the low incidence of liver cancer in Iran (31), this problem is trivial. However, the main strength of our study is the use of the most up-to-date statistical modeling for minimizing misclassification and incompleteness, determining cause distribution, and finding garbage and null codes in mortality data. Second, primary liver cancer mainly occurs concurrently with cirrhosis. This, may also be present in the main causes and complications of cirrhosis and liver cancer in more than 90% of patients. It is a critical issue when estimating mortality time trends to compare them at provincial levels (29). We should train clinicians to properly distinguish the mentioned diseases in registering the cause of death certification. Third, we could not discriminate liver cancer mortality causes by more detailed factors such as obesity and amount of alcohol consumption. Therefore, the reports on alcohol consumption could have some residual confounding. The details on the amount of alcohol consumption pattern were not available. It is recommended to conduct future studies on this issue. Finally, the variations in liver cancer and potential uncertainty (primary or secondary) make long-term interpretation of the mortality trends difficult. However, the other strength of our study is calculating the uncertainty of the mortality rates at the national and provincial levels, using appropriate statistical methods. Moreover, the pattern of age-standardized liver cancer mortality rate in Iran is consistent with mortality pattern reported by the GBD (25). As the major strength of our study, we collected the data on every available registered number of liver cancer deaths, and it enabled us to conduct a more detailed exploration of the attributed causes of liver cancer mortality in line with the GBD classification and models. The results could be used in the national and provincial estimates and illustrate a clear picture for improving preventive and therapeutic policies and programs in this field.
4.1. Conclusions
Because of the high distribution of liver cancer risk factors, increasing incidence of and mortality from liver cancer, increasing level of life expectancy, and increasing number of the elderly in Iran, policy makers are expected to focus more on this issue. The American Cancer Society has not issued recommendations for liver cancer screening. Therefore, to reduce and stop the increasing trend of liver cancer mortality, the main risk factors for it must be screened and controlled. It is better to adopt measures and policies for better and effective treatment of the disease and utilize palliative strategies to reduce its mortality and morbidity. Reducing hepatitis B and C infections, as the main causes of mortality from liver cancer, must be the main concern in Iran. In addition to the continuation of hepatitis B vaccination program, it is necessary to re-evaluate the vaccination program and safety of blood sources and to improve measures for controlling blood quality, to implement training and education programs on high-risk behavior and alcohol consumption especially for young adults, and to utilize early and effective hepatitis C treatment measures.
