1. Context
Non-alcoholic fatty liver disease (NAFLD) is a worldwide disease affecting up to 45% of adults and 10% of children in western countries (1, 2). Several studies also showed an increase occurred in eastern Asia owing to the shift in lifestyle and dietary patterns (3, 4). The NAFLD represents a scope of clinical and pathologic conditions featured by macro-vesicular steatosis in the absence of alcohol, which is comprised of a wide gamut of liver diseases such as non-alcoholic steatohepatitis (NASH), fibrosis, cirrhosis, and hepatocellular carcinoma.
The NASH is a progressive form of NAFLD that can progress to cirrhosis or liver failure, requiring liver transplantation (LT) (5), which is also served as a reason for the surgery in the next decades (6). Although LT has become a standard treatment for acute and chronic end-stage liver disease contributed by NASH, there is not a consensus on the outcomes of the operation. Several separate studies (7-11) have shown that LT for NASH had increased mortality in early months or years compared to those treated for other indications, while no difference could be observed regarding long-term survival. Moreover, the reason for the short-term mortality is still unclear.
Therefore, in the current meta-analysis and systematic review, first, we aimed to compare the survival between the NASH- and non-NASH patients after LT and figure out the potential factors associated with mortality at specific time point; second, to compare the causes for death after LT.
2. Evidence Acquisition
This article follows the PRISMA guidelines for reporting meta-analysis and systematic review.
2.1. Data Sources and Searches
Studies published in English before February 2018 were surveyed through online databases PubMed, EMBASE, Web of Science, Wiley Online Library, and Research Gate. Search terms consisted of the following keywords: “Non-alcoholic steatohepatitis” OR “NASH” OR “Non-alcoholic fatty liver disease” OR “NAFLD” AND “liver transplantation”. All titles and abstracts from the initial search were screened by two reviewers. If the title and abstracts did not contain enough information to include or exclude the study from the analysis, the study was reviewed in full-text. Citation lists of relevant articles and reviews were additionally scanned to identify further studies of interest.
2.2. Eligibility Criteria
Studies conforming to the following selection criteria were included in the meta-analysis: first, focus on adult patients; second, compare the outcomes after liver transplantation between NASH and non-NASH patients; and third, contain available data related to patient survival according to time spectrum and reasons for mortality. For relevant studies that did not provide necessary data for analysis, we contacted the corresponding author of the articles for information. If we did not receive the author’s response in a reasonable amount of time, the study was excluded from the meta-analysis.
2.3. Data Extraction
All retrieved records from separate studies were reviewed and extracted by using standardized forms. Discrepancies were resolved by referring to the original articles and discussing by all authors. Following details were extracted from each study: first author, year of publication, sample size, patient baseline characteristics, survival, and causes of death.
2.4. Quality Assessment and Risk of Bias
According to the Cochrane Handbook of Systematic Review of Interventions, cohort control studies were assessed by the Newcastle-Ottawa Scale (NOS) based on three perspectives: selection, comparability, and outcome of the cohort. The NOS score ranged from 0 to 9, and studies with a total score of 6 or lower were considered low quality, while studies with a total score of 7 or above were regarded as high quality and eligible for inclusion in the meta-analysis. Details are presented in Table 1.
| Study | A | B | C | D | E | F | G | H | I | Total Score |
|---|---|---|---|---|---|---|---|---|---|---|
| Agopian et al., 2012 (12) | Yes | Yes | Yes | Yes | No | No | Yes | Yes | Yes | 7 |
| Barritt et al., 2011 (9) | Yes | Yes | Yes | Yes | No | No | Yes | Yes | Yes | 7 |
| Bhagat et al., 2009 (13) | Yes | Yes | Yes | Yes | No | No | Yes | Yes | Yes | 7 |
| Houlihan, 2011 | Yes | Yes | Yes | Yes | No | No | Yes | Yes | Yes | 7 |
| Kennedy et al., 2012 (10) | Yes | Yes | Yes | Yes | No | No | Yes | Yes | Yes | 7 |
| Malik et al., 2009 (7) | Yes | Yes | Yes | Yes | No | No | Yes | Yes | Yes | 7 |
| Park, 2009 (3) | Yes | Yes | Yes | Yes | No | No | Yes | Yes | No | 6 |
| Reddy et al., 2012 (14) | Yes | Yes | Yes | Yes | No | No | No | Yes | Yes | 6 |
| Sourianarayanane et al., 2017 (11) | Yes | Yes | Yes | Yes | Yes | Yes | Yes | Yes | Yes | 9 |
| Than, 2017 | Yes | Yes | No | Yes | No | Yes | Yes | Yes | Yes | 7 |
| Unger, 2016 | Yes | Yes | No | Yes | Yes | Yes | Yes | Yes | Yes | 8 |
| Vanwagner et al., 2012 (15) | Yes | Yes | Yes | Yes | Yes | No | Yes | Yes | Yes | 8 |
| Pizza, 2016 | Yes | Yes | Yes | Yes | Yes | Yes | No | Yes | Yes | 8 |
Abbtreviations: A, representative of the exposed cohort; B, selection of the non-exposed cohort; C, ascertainment of exposure; D, demonstration that outcome of interest was not present at start of the study, E, study controls for the most important factor; F, study controls for any additional factor; G, assessment of outcome; H, follow-up long enough for outcomes to occur; I, adequacy of follow-up of cohorts.
2.5. Statistical Analysis
All statistical analyses were performed by Review Manager version 5.3. Results and effect size analysis were presented as odds ratio (OR) and numbers were presented with 95% confidence intervals (95% CI).
The I2 statistics, chi-squared test, and 95% CI were performed to assess heterogeneity. The I2 describes the percentage of the variability in effect estimates that is due to heterogeneity rather than sampling error (chance). An I2 value > 50% or P value < 0.05 was considered substantial heterogeneity, and the random effect model was selected, otherwise, the fixed effect model was employed. Sensitivity analysis was conducted to confirm the robustness of the results by omitting one study at a time. Publication bias was assessed by the use of the funnel plot.
In order to deliver a more accurate result and figure out the factors related to mortality, subgroup analysis was performed. The subgroup was categorized based on five significant factors: recipient age (≤ 58 or > 58), female patient (≤ 40% or > 40%), MELD score (≤ 20 or > 20), diabetes proportion (≤ 60% or > 60%), and hypertensive proportion (≤ 50% or > 50%).
3. Results
3.1. Search Process
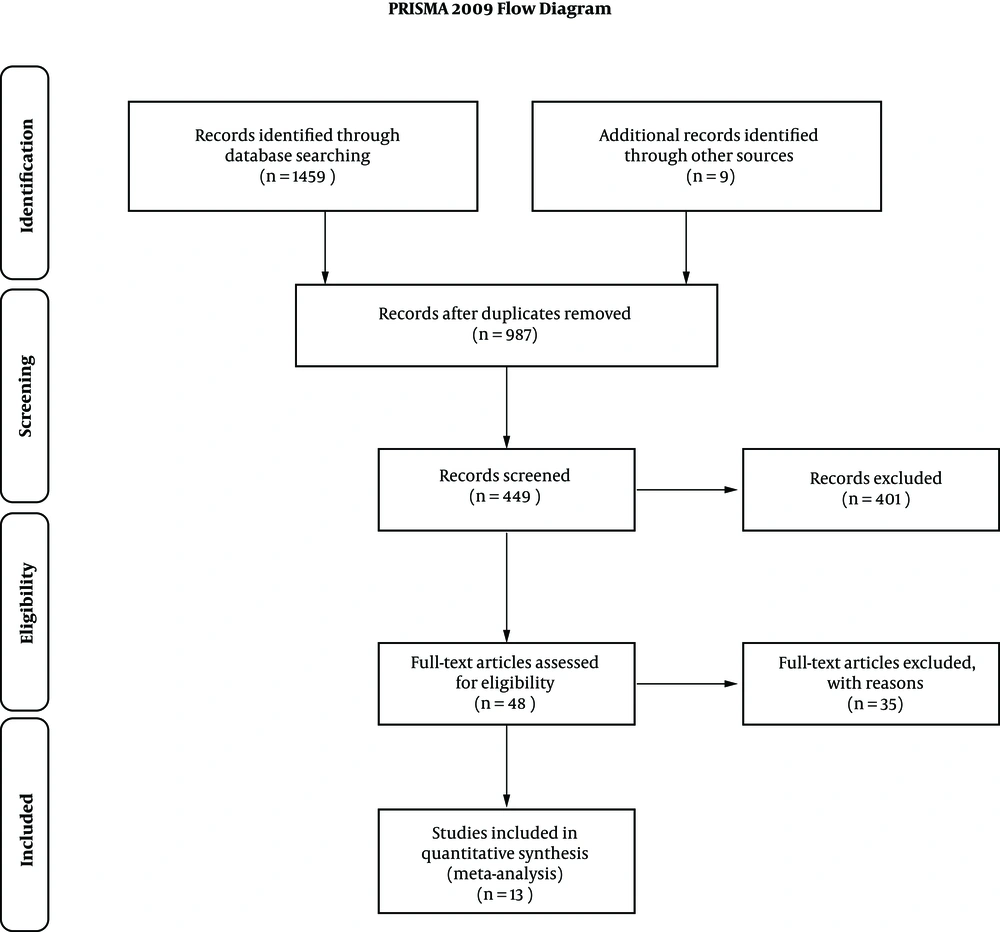
Detailed screening processes were shown in Figure 1. A total of 1459 articles were initially selected from PubMed Web of Science, Wiley Online Library, Research Gate, and EMBASE, and 9 from a manual search of citation list. Out of 987 manuscripts after removing duplicates, 538 were excluded due to inappropriate article styles such as review, case report, comment, etc. Out of 449 manuscripts following title and abstract screening, 401 were excluded due to low relativity. Out of 48 articles fully assessed, 35 were excluded due to the paucity of the detailed description on the surgery or patient characteristics or essential endpoints and finally, 13 were included for meta-analysis.
3.2. Characteristics of Enrolled Studies
Table 2 shows the basic information of the enrolled studies in this meta-analysis. The thirteen enrolled trials based on a total of 4806 participants were published in English from 2009 to 2017, which were all retrospective cohort study. The control group was composed of the patients with alcoholic liver disease, alcoholic cirrhosis, and hepatitis C virus required liver transplantation. A large number of the patients were Caucasian with age up to 50. Diabetes and hypertension were frequently mentioned in the participants except for two studies without any reference for these diseases. In terms of risk of bias, the NOS scores of all included studies are ≥ 6 points, indicating a lower risk of bias.
| Study | Type of Study | Patient No. | Age, y | Female, % | MELD Score | Diabetes, % | HTN, % |
|---|---|---|---|---|---|---|---|
| Agopian et al., 2012 (12) | Retrospective cohort study | NASH: 144 | 57 | 56 | 33 | 57 | 50 |
| Non-NASH: 1150 | 56 | 18 | 33 | 32 | 37 | ||
| Barritt et al., 2011 (9) | Retrospective cohort study | NAFLD: 21 | 57.9 ± 6.2 | 43 | 23.4 ± 6.8 | 62 | 43 |
| Non-NAFLD: 97 | 52.1 ± 8.3 | 27 | 23.6 ± 6.15 | 21 | 26 | ||
| Bhagat et al., 2009 (13) | Retrospective cohort study | NASH: 71 | 56 ± 9.5 | 35 | 49 | 59 | |
| ETOH: 83 | 54 ± 8.2 | 19 | 11 | 16 | |||
| Houlihan , 2011 | Retrospective cohort study | NASH: 48 | 40 - 73.4 | 22.9 | 6.4 - 33.1 | 72.9 | 37.5 |
| Non-NASH: 48 | 40 - 68.2 | 22.9 | 6.4 - 23.4 | 29.2 | 4.2 | ||
| Kennedy et al., 2012 (10) | Retrospective cohort study | NASH: 129 | 57 ± 9 | 53 | 6 - 40 | 59 | 75 |
| Non-NASH: 775 | 48 ± 17 | 18 | 6 - 40 | 17 | 41 | ||
| Malik et al., 2009 (7) | Retrospective cohort study | NASH: 98 | 59.8 ± 8.6 | 55.1 | 17.0 ± 7.2 | 72.4 | 50 |
| Non-NASH: 686 | 58.3 ± 7.2 | 55.1 | 17.4 ± 6.7 | 23 | 20.9 | ||
| Park, 2009 (3) | Retrospective cohort study | NASH: 71 | 58.7 | 50.7 | 13.4 | 69 | 55.2 |
| Non-NASH: 472 | 52.5 | 32.1 | 13.3 | 19.9 | 24.6 | ||
| Reddy et al., 2012 (14) | Retrospective cohort study | NASH: 53 | 57 - 70 | 48.1 | 7 - 11 | 53.8 | 59.6 |
| HCV/ALD: 162 | 53 - 67 | 16.7 | 8 - 12 | 30.9 | 51.9 | ||
| Sourianarayanane et al., 2017 (11) | Retrospective cohort study | NASH: 77 | 59.4 ± 8.5 | 49.4 | |||
| ALD: 108 | 54.8 ± 9 | 22.2 | |||||
| Than, 2017 | Retrospective cohort study | NAFLD: 21 | 58.9 ± 5.5 | 14 | 8 - 15 | 76 | |
| HCV: 80 | 54 ± 7.2 | 14 | 7-11 | 34 | |||
| Unger, 2016 | Retrospective cohort study | NASH: 15 | 59.07 ± 2.2 | 20 | 15.40 ± 4.27 | 33.3 | 33.3 |
| CC: 12 | 51.75 ± 2.9 | 25 | 15.36 ± 3.23 | 25 | 33.3 | ||
| Vanwagner et al., 2012 (15) | Retrospective cohort study | NASH: 115 | 58.4 ± 9.9 | 45 | 7 - 40 | 51 | |
| ETOH: 127 | 53.3 ± 9.3 | 18 | 9 - 40 | 52 | |||
| Pizza, 2016 | Retrospective cohort study | NASH: 78 | 57 ± 10 | 27 | 21 ± 6 | 58 | 54 |
| ALD: 65 | 53 ±10 | 49 | 19 ± 6 | 26 | 35 |
Abbreviations: ALD, alcoholic liver disease; CC, cryptogenic cirrhosis; ETOH, alcoholic cirrhosis; HCV, hepatitis C virus; HTN, hypertension; NAFLD, non-alcoholic fatty liver disease; NASH, non-alcoholic steatohepatitis.
3.3. Patient Survival
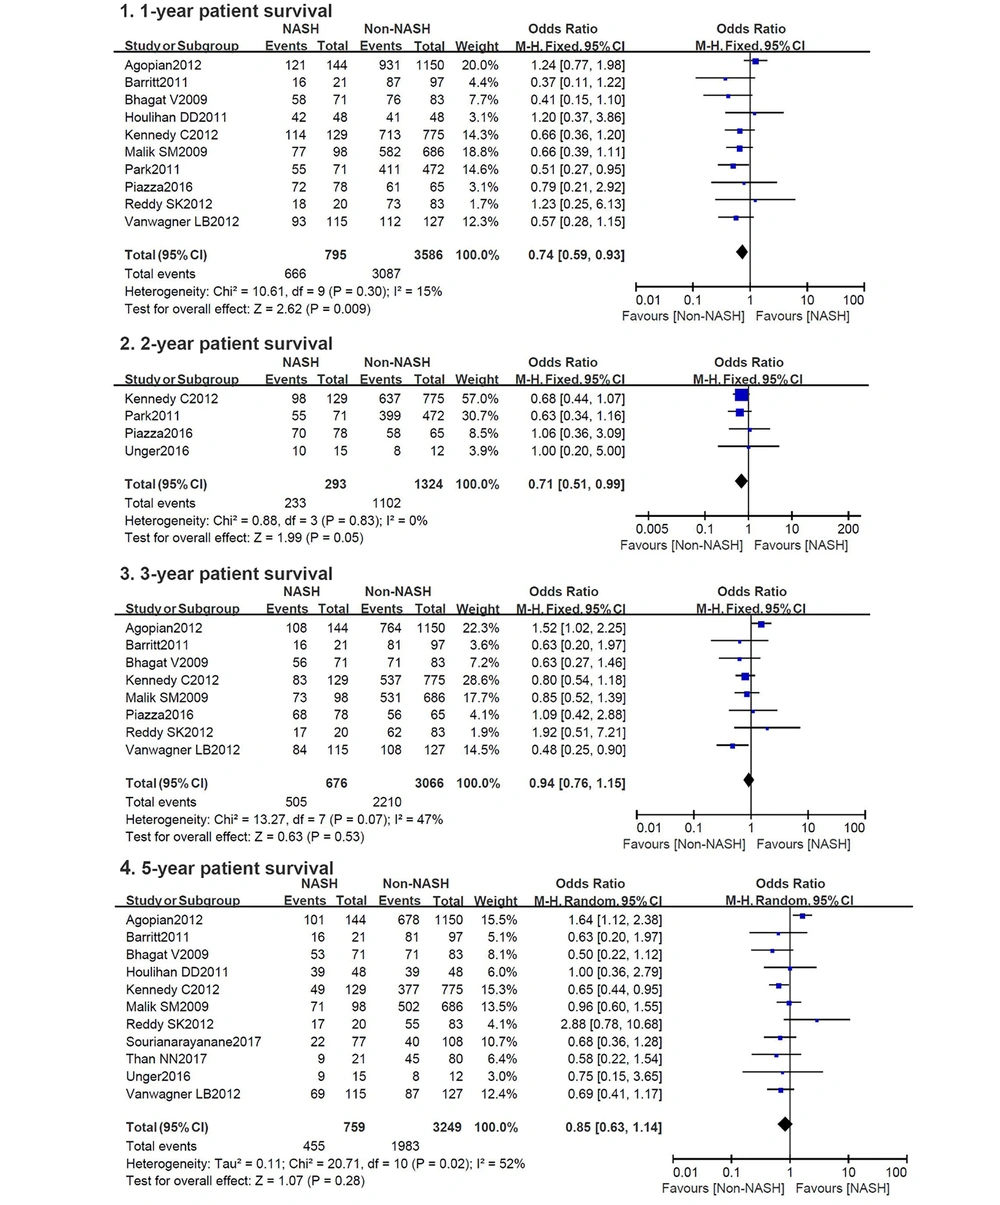
Ten studies reported 1-year survival, four reported 2-year survival, eight reported 3-year survival, and eleven reported 5-year survival. The pooled results are presented in Figure 2.
Short-term survival of 1- and 2-year favored the non-NASH group with summary ORs of 0.74 (95% CI, 0.59 - 0.93) and 0.71 (95% CI, 0.51 - 0.99), respectively. Low heterogeneity can be observed (I2 = 15%, P = 0.30; I2 = 0%, P = 0.83). However, there is no significant difference regarding long-term survival of 3- and 5- year with summary ORs of 0.94 (95% CI, 0.76 - 1.15) and 0.85 (95% CI, 0.63 - 1.14). Significant heterogeneity can be observed in 5- year survival (I2 = 52%, P = 0.02).
3.4. Causes for Death
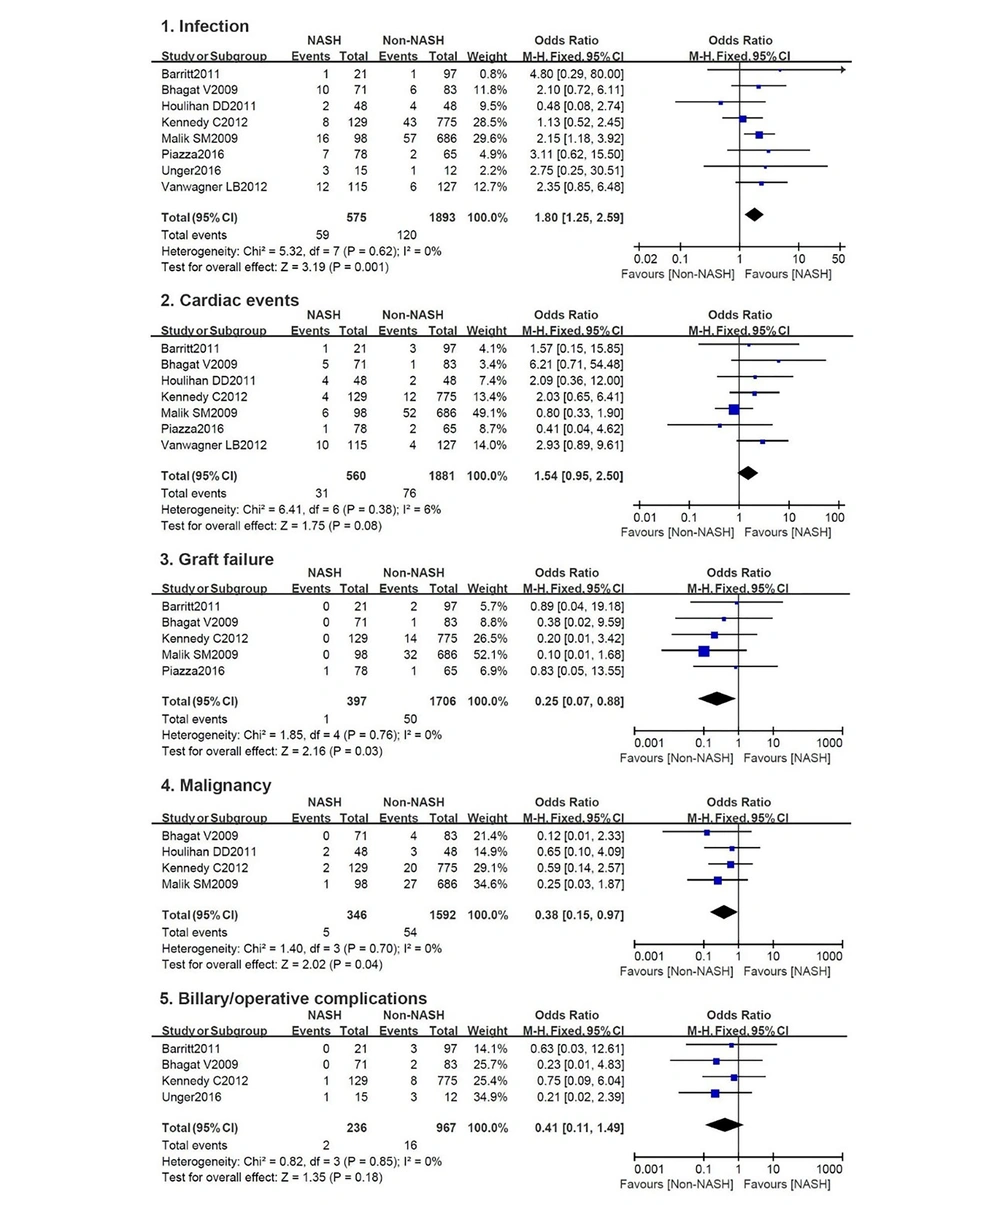
Five causes for death were frequently reported, eight studies on infection, seven on cardiac events, five on graft failure, four on malignancy, and four on biliary or operative complications. Detailed pooled results are presented in Figure 3.
More NASH patients died for infection with a summary OR of 1.80 (95% CI, 1.25 - 2.59), while the non-NASHs were susceptible to graft failure and malignancies with summary ORs of 0.25 (95% CI, 0.07 - 0.88) and 0.38 (95% CI, 0.15 - 0.97), respectively. There are no differences in terms of cardiac events and biliary/operative complications between the two groups with summary ORs of 1.54 (95% CI, 0.95 - 2.50) and 0.41 (95% CI, 0.11 - 1.49). No significant heterogeneity can be found in these five categories.
3.5. Subgroup and Sensitivity Analyses
To figure out the factors causing short-term mortality in NASH group, subgroup analysis was performed by categorizing the results into five categories: recipient age (≤ 58 or > 58), female percentage (≤ 40% or > 40%), MELD score (≤ 20 or > 20), diabetes percentage (≤ 60% or > 60%), and hypertension percentage (≤50% or > 50%).
All subgroup results were consistent with the main outcomes, except for the subgroup of recipient age > 58, female percentage > 40%, diabetes percentage > 60% and hypertension percentage > 50%, in which the 1-year survival favored non-NASH patients, with summary ORs of 0.61 (95% CI, 0.43 - 0.85), 0.75 (95% CI, 0.59 - 0.93), 0.61 (95% CI, 0.43 - 0.88) and 0.58 (95% CI, 0.39 - 0.85), respectively. Details are presented in Table 3.
| Outcomes/Subgroup | No. of Studies | Effect Estimate | Test for Overall Effect, P Value | Heterogeneity | |
|---|---|---|---|---|---|
| P Value | % | ||||
| 1- year | |||||
| Recipient age | |||||
| > 58 | 4 | 0.61 [0.43, 0.85] | 0.004 | 0.76 | 0 |
| ≤ 58 | 5 | 0.86 [0.63, 1.18] | 0.35 | 0.11 | 46 |
| Female, % | |||||
| ≤ 40 | 2 | 0.63 [0.30, 1.32] | 0.23 | 0.17 | 47 |
| > 40 | 7 | 0.75 [0.59, 0.93] | 0.02 | 0.20 | 30 |
| MELD score | |||||
| ≤ 20 | 3 | 0.68 [0.41, 1.15] | 0.15 | 0.32 | 11 |
| > 20 | 5 | 0.79 [0.60, 1.03] | 0.008 | 0.15 | 41 |
| Diabetes, % | |||||
| ≤ 60 | 5 | 0.83 [0.62, 1.11] | 0.21 | 0.16 | 40 |
| > 60 | 4 | 0.61 [0.43, 0.88] | 0.008 | 0.50 | 0 |
| HTN, % | |||||
| ≤ 50 | 4 | 0.84 [0.51, 1.38] | 0.49 | 0.14 | 46 |
| > 50 | 4 | 0.58 [0.39, 0.85] | 0.005 | 0.64 | 0 |
| Overall | 10 | 0.74 [0.59 ,0.93] | 0.009 | 0.30 | 15 |
| 3- year | |||||
| Recipient age | |||||
| > 58 | 3 | 0.75 [0.52, 1.08] | 0.12 | 0.13 | 52 |
| ≤ 58 | 5 | 1.03 [0.81, 1.32] | 0.80 | 0.12 | 45 |
| Female, % | |||||
| ≤ 40 | 1 | 0.63 [0.27, 1.46] | 0.28 | NA | NA |
| > 40 | 6 | 0.90 [0.61, 1.32] | 0.58 | 0.03 | 59 |
| MELD score | |||||
| ≤ 20 | 1 | 1.92 [0.51, 7.21] | 0.33 | NA | NA |
| > 20 | 5 | 0.85 [0.57, 1.27] | 0.42 | 0.02 | 64 |
| Diabetes, % | |||||
| ≤ 60 | 6 | 1.14 [0.64, 2.02] | 0.66 | < 0.0001 | 81 |
| > 60 | 2 | 0.81 [0.52, 1.27] | 0.37 | 0.64 | 0 |
| HTN, % | |||||
| ≤ 50 | 3 | 1.06 [0.64, 1.74] | 0.82 | 0.11 | 54 |
| > 50 | 3 | 0.97 [0.70, 1.34] | 0.24 | 0.37 | 0 |
| Overall | 8 | 0.94 [0.64, 1.21] | 0.53 | 0.07 | 47 |
| 5- year | |||||
| Recipient age | |||||
| > 58 | 6 | 0.82 [0.61, 1.10] | 0.18 | 0.39 | 5 |
| ≤ 58 | 5 | 0.84 [0.49, 1.45] | 0.53 | 0.005 | 73 |
| Female, % | |||||
| ≤ 40 | 4 | 0.64 [0.39, 1.06] | 0.08 | 0.76 | 0 |
| > 40 | 7 | 0.92 [0.64, 1.34] | 0.67 | 0.007 | 66 |
| MELD score | |||||
| ≤ 20 | 4 | 1.03 [0.59, 1.79] | 0.92 | 0.28 | 22 |
| > 20 | 5 | 0.95 [0.78, 1.17] | 0.64 | 0.008 | 71 |
| Diabetes, % | |||||
| ≤ 60 | 6 | 0.91 [0.55, 1.51] | 0.72 | 0.002 | 73 |
| > 60 | 4 | 0.86 [0.59, 1.25] | 0.43 | 0.75 | 0 |
| HTN, % | |||||
| ≤ 50 | 5 | 1.16 [0.83, 1.64] | 0.38 | 0.28 | 21 |
| > 50 | 3 | 0.80 [0.38, 1.66] | 0.55 | 0.07 | 63 |
| Overall | 11 | 0.85 [0.63, 1.14] | 0.28 | 0.02 | 52 |
Sensitivity analysis was performed on the results of 5- year survival, which presented substantial heterogeneity. When omitted the data from Agopian et al., the heterogeneity was decreased (I2 = 0%, P = 0.58) and the pooled results indicated that the non-NASH group presented significantly higher survival rate compared with the NASH group in the 5-year follow-up, which was different from the overall results.
3.6. Publication Bias
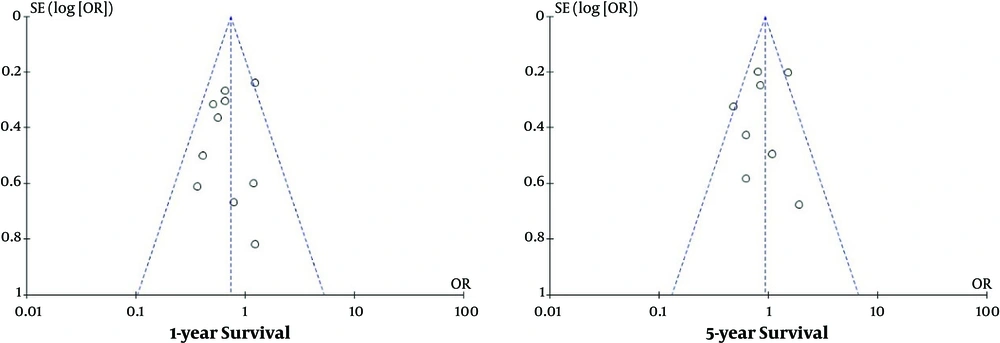
Since publication bias analysis is significant for the pooled outcomes based on ≥ 10 articles, only 1- and 5- year survival were subjected to the publication bias assessment in the current study. The results revealed low publication bias and were presented in Figure 4.
4. Discussion
In this meta-analysis, pooled statistics of 13 studies indicated that firstly, NASH patients had unfavorable survival in 1 and 2 years after LT compared with non-NASH patients, while there is no significant difference in long-term survival of 3 and 5 years; secondly, infection was the most common etiology of mortality in NASH group, whereas non-NASH was more susceptible to graft failure and malignancy; thirdly, recipient age, sex, diabetes, and hypertension were associated with the short-term morality in NASH patients.
As far as we know, there is still no consensus on the survival of NASH patients after LT in the medical community. Some studies observed that NASH patients performed worse in the first one or two years after LT, while some detected that both NASH and non-NASH patients presented similar survival. A meta-analysis (16) on studies published before 2012 concluded that the survival after LT was similar in 1, 3, and 5 years between NASH and non-NASH patients. Three studies (17-19) on the database for liver transplantation also revealed a similar survival during 5 years between the two patient groups. In the current analysis, the pooled results of survival in 3 and 5 years between groups were consistent with these studies, while the NASH patients had higher mortality in the first two years compared with the controls.
In order to figure out the reasons for the high mortality in 1 - 2 years and further confirm our results, a subgroup analysis was carried out. When the results were restricted to recipient age > 58, female percentage > 40%, diabetes percentage > 60%, and hypertension percentage > 50%, NASH group outcome was worse in 1- year survival. We found that among all enrolled studies, NASH recipients were always older than non-NASH counterparts about two to five years, which was consistent with a previous meta-analysis (16), indicating the role of age in the post-transplant outcomes. Charlton et al. also detected that NASH patients are significantly older and more likely to be female (19). However, rare studies discussed gender’s influence on patient survival after LT. In this regard, Bhagat et al. (13) declared that gender had no impact on patient survival in the NASH group. Furthermore, different proportions of male and female in each study hampered us to verify the relation between gender and patient survival in this review; therefore, further investigations are still required. Metabolic syndrome has been considered to be related to post-transplant survival in several studies. Contos et al. observed immediate and 1- year mortality after transplantation, which may possess a close relationship with metabolic syndromes such as higher BMI, serious diabetes, and hypertension (20). Barritt et al. found that patients with diabetes had worse survival from 1 to 3 years, which may be due to the adverse effects of immunosuppressive regimes on the metabolic syndrome (9, 21). Lorenz et al. reported that diabetes and hypertension were established risk factors for the patient mortality associated with cardiac events (22). Altogether, these results suggested that age, gender, diabetes, and hypertension may affect short-term survival in the current study.
Through sensitivity analysis, we observed that the heterogeneity was greatly decreased and the pooled ORs was changed in 5-year survival when excluded the article by Agopian et al. (12). In the NOS assessment, this article received 7 scores, indicating a low risk of bias and high quality for inclusion, which should not be excluded from the current meta-analysis. Moreover, this article contained a significantly large population accounted for half of the total participant for 5-year survival analysis, indicating its great influence on the overall results. Furthermore, NASH patients had 5-year survival compared with the non-NASH patients and were even significantly better than the patients with HCV who represented the largest population in the non-NASH group. However, several studies for pooling yielded a converse result that the 5-year survival more preferred non-NASH group, which might lead to the high heterogeneity. Two previous studies with much larger sample size also analyzed the survival after liver transplantation between NASH and non-NASH patients. One by Afzali et al. (18) based on a population of 53,738 revealed a much pleasant survival rate in NASH group after LT. Another one (19) with 35,781 participants from SRTR database demonstrated that there were no significant differences in post-transplant survival between the two groups. Therefore, we suggested that both NASH and non-NASH presented similar post-transplant outcome in a 5-year follow-up. Moreover, the sample size may be a factor influencing the overall outcomes, and further study based on a larger population is still required.
In the conducted studies, there are several complications accounting for patient mortality after LT such as infection, cardiac events, graft failure, malignancy, biliary or operative complication, etc. It has been reported that infectious complications, including bacterial infections, fungal infections, viral infections, and parasitic infections were responsible for the elevating mortality in the first 3 years after LT, and bloodstream infections featured by sepsis represented the second most common infection (23). Another previous study also observed a significantly higher rate of urogenital tract infection in the NASH group compared with the non-NASH. In this meta-analysis, NASH patients were more susceptible to infections compared with non-NASH patients, which was verified by the above-mentioned studies. Furthermore, several pieces of research also proved that diabetic and hypertensive patients are more inclined to die as a result of infections (13, 14, 24), and we found that the incidence of diabetes and hypertension are higher in NASH group compared with the non-NASH in this analysis.
Cardiac events have been reported to be the most common cause of mortality in 5 years after LT as well as a relevant cause of death in 10 to 15 years after LT (8). Vanwagner et al. (15) supposed it may be related to attenuated systolic contraction, diastolic relaxation, electrophysiological abnormalities, and the decreasing response of the heart to direct beta stimulation. Montori et al. believed that cardiac events are related to metabolic syndrome (21). Even though more cardiac events can be detected in NASH group, there is still no significant difference between the two groups. Compared with non-NASH group, NASH patients presented lower mortality caused by graft failure and malignancy following liver transplantation. It is reported that NASH group has a lower recurrence of steatosis, which may lead to lower graft failure (13). Also, there are more patients with liver cancer in the non-NASH group, which may explain the high prevalence of malignancy.
There are several limitations to this review should be considered. First, there is no precise definition for NASH in the medical community; therefore, some NASH patients may be ignored in the diagnosis. Second, to avoid patient duplication and low-quality research, we have excluded several studies with large population based on the national database. Third, most included studies did not report the causes for death in a specific period, hampered us to further analyze the complications, which may be responsible for short-term mortality. Fourth, we only included the studies published in English, which may lead to language bias.
In conclusion, liver transplantation is an effective approach for both the NASH and non-NASH patients for long-term benefits, and we suggest that more attention should be paid to NASH patients in the first and second year after liver transplantation, especially those with the following characteristics and symptoms: female, age > 58, diabetes, hypertension, and post-transplant infections.
