


1. Context
Hepatitis C virus (HCV) is a pathogen of global health significance. Africa and Asia are the most affected regions with the highest prevalence rates and over 15 million individuals are infected with chronic HCV in the Middle East and North Africa (MENA) region alone (1). About 80% of the acute hepatitis C cases progress to chronic infection and 10% - 20% of them develop complications characterized by chronic inflammation, liver cirrhosis, and hepatocellular carcinoma (2). The virus exhibits high replicative activity leading to high genetic diversity and can be classified into seven genotypes, and more than 67 subtypes (3). In the MENA region, country-specific genotype distribution is calculated previously by Mahmud, Al-Kanaani (1). The authors report that pooled mean proportion of genotype 1 is higher in Algeria, Morocco, Iran, Tunisia, and Bahrain, whereas genotype 3 mainly prevails in Pakistan and Afghanistan. Egypt, Saudi Arabia, Jordan, and Palestine are predominantly occupied by genotype 4.
The virus has 9.6 kb long RNA genome that encodes three structural proteins (core, E1, and E2) and seven non-structural proteins (p7, NS2, NS3, NS4A, NS4B, NS5A, and NS5B). The maximal variability is observed in genes encoding the envelope glycoproteins E1 and E2 (4). The structural envelope glycoproteins (E1 and E2) facilitate virus entry into the host cell and escape from the host immune system using different adaptive mechanisms. These glycoproteins bind surface receptors on hepatic cells and participate in endocytosis and virion formation (5). Envelope protein E2 has been extensively characterized and was initially assumed responsible for virus binding and fusion with the host cells (6). Contrary to this suggestion, recent work proposes that E1 alone or in combination with E2 may be involved in virus fusion (7). A conserved hydrophobic motif (CSALYVGDLC, residues 272-281) in E1 gene is believed to be associated with virion fusion process (8). The disulfide and covalent bonds between E1 and E2 proteins make E1/E2 heterodimer, a type I transmembrane protein that releases individual E1 and E2 from the polyprotein by signal peptidase cleavages (9). After the cleavage, E1 protein targets the endoplasmic reticulum lumen where it is modified by N-glycosylation. All HCV genotypes carry 4 to 5 potential N-glycosylation sites on E1 protein, playing important roles in protein folding, virion morphogenesis, and immune escape (10, 11).
The high glycosylation rate on E1 protein significantly limits the immunogenicity of HCV and restrict the binding of antibodies to their epitopes. Chronic infections arise through high mutation rates in the envelope proteins and formation of glycosylation-associated cellular aggregates and viral quasispecies that help virus escape from the immune system (12). Recently, the proposed HCV E1 crystal structure and in vitro analysis of N-terminal domain (192-270) revealed a conserved protein domain organization, encompassing N-glycosylation sites, antigenic sites defined by neutralizing monoclonal antibodies, and direct drug binding sites (13). Limited data are available on E1 polymorphism, mutagenesis, and immunogenicity analysis of a large population cohort using in silico bioinformatics tools. Here, we performed these analyses on 937 sequences of HCV E1 protein that originate from the MENA region. Such knowledge is important not only to elucidate ongoing evolution in HCV but also to facilitate necessary interventions for effective control of HCV through novel vaccine and antiviral drug approaches. Although countries in the MENA region have the highest HCV prevalence rate, relatively little attention has been paid on HCV genome characterization in this region. In this study, the E1 protein is chosen because of the availability of sequences from the MENA region in the Gene Bank database and also because it has been less explored at the molecular level.
2. Materials and Methods
2.1. E1 Sequences
HCV E1 gene sequences obtained from the MENA region were downloaded from GenBank database maintained by NCBI (14). A search was performed using the combination of the following search queries; “Hepatitis C Virus”, “HCV”, “envelope protein” “E1 protein”, and “country name”. The search produced 1,199 complete or partial E1 sequences for Saudi Arabia (446), Egypt (428), Tunisia (119), Iran (57), Pakistan (112), Afghanistan (29), Yemen (5), and Algeria (3). All sequences were aligned against the HCV genotype 1a reference gene H77 (coordinates 915 - 1491) using MAFFT v7.310 (15) and the alignments were clipped to codon positions 192 - 300 of E1 protein, corresponding to nucleotides 915 - 1240 on H77 reference genome. Partial sequences that had sequence length less than 300 bp or which lacked N-terminal domain were removed, resulting in 937 sequences for further analysis. A systematic analysis of these sequences was performed using different bioinformatics tools (Figure 1).

Flowchart of bioinformatics analysis performed on HCV E1 protein. Blue boxes show the work performed and green ovals show the software used.
2.2. Sequence Alignment and Phylogenetic Analysis
For phylogenetic analysis, we randomly selected only 278 sequences, which represented all genotypes, years, and country of isolation. Phylogenetic tree was constructed with MEGA® V. 7.0 software (16) using distance-based neighbor-joining (1,000 replication bootstrap values). Reference genotype sequences were obtained from https://hcv.lanl.gov database to construct phylogenetic tree. All assembled sequences were further pairwise aligned with genotype-specific reference sequences using multiple sequence aligned methods in MAFFT tool for E1 nucleotide mutations and amino acid substitution analysis. BioEdit® V. 5.0.6 (17) software was used for nucleotide mutations identification and comparative residue analysis of all the sequences.
2.3. Evolution Rate and Site-Specific Selection Pressure
HCV E1 gene evolution rate was estimated using the Bayesian Markov Chain Monte Carlo (MCMC) algorithm implemented in the BEAST V. 1.8.4 software (18). Virus isolation dates were used for calibration of the strict molecular clock in HKY substitution model. The XML file was generated in BEAUTi program using gamma parameter of site heterogeneity at 200 million chain-length, echoed every 1,000 states. The estimated effective sampling sizes (ESSs ≥ 200) were used to evaluate sampling convergence of MCMC method. Sampling prior and mean clock rate were estimated in Tracer software V. 1.7. To elucidate patterns of adaptive evolution in E1 protein, single-likelihood ancestor counting (SLAC) model in web-based suite-Datamonkey was used. Site-specific selection pressures were analyzed for synonymous (dS) to non-synonymous (dN) ratio of nucleotide substitutions per site (19). A codon position with dN/dS value more than 1 at P value 0.05 was considered positively selected sites. The nucleotide diversity was analyzed for polymorphism, and average numbers of pairwise nucleotide differences were determined using DnaSP V. 6.12.01 (20) and Tajima’s D test of neutrality.
2.4. Comparative Residue Analysis
Residue diversity and/or conservancy at each amino acid site were analyzed through online WebLogo (21) program. Pairwise analysis of the sequence identity was performed by bootstrap value 1,000 using MEGA 7 (16). Residue analysis of key motifs recognized as monoclonal antibody epitope sites was performed for all genotypes. Epitope sequences were compared with consensus references. Furthermore, residue conservancy of these motifs was assessed using epitope conservancy analysis program implemented in the immune epitope database and analysis resource (IEDB) (22). The program calculated epitope conservancy as a percentage of the number of polymorphic sites over the epitope length. The epitope immunogenicity was assessed against HLA class1- alleles using IEDB epitope analysis tool (23). Finally, a literature review was conducted to collect available information on amino acid mutations that may affect the efficacy of direct-acting antiviral drugs targeting E1 protein, which concluded following seven residue sites (T213A, W239, I262A, D263-, Q289H, M267V, F291I, Y297H) (7, 24, 25). Amino acid substitutions at these specific sites were compared between different genotypes and reported in a graph as the percentage (Figure 2).

Percentage nucleotide identity and divergence of HCV E1 protein analyzed using pairwise distance maximum composite likelihood algorithm implemented by MEGA 7. Nucleotide identity percentage are given in the below diagonal, whereas percent divergence values are presented in the above diagonal.
2.5. Prediction of Glycosylation Sites
NetNglyc online tool was used to predict N-linked glycosylation (26). The default settings were used to predict N-X-T/S sequons. Only scores crossing the default threshold of 0.5 and jury agreement 9/9 were considered positive for potential glycosylation sites.
3. Results
3.1. Phylogenetic and Evolutionary Analysis
The phylogenetic analysis of HCV E1 gene revealed a distinct and genotype-specific distribution pattern. All E1 sequences clustered together in distinct clades of their respective genotypes. Most of the retrieved sequences belonged to genotype 1, 2, 3, 4, except only one sequence was related to both 5a and 6a genotypes belonged to Algeria and Iran, respectively. Overall, 19 genotypes (subtypes) were clustered in the phylogenetic tree as presented in Figure 3. The phylogenetic analysis revealed the evolutionary dynamic of E1 protein for diverse distribution of various genotypes and subtypes of HCV in the MENA region. In this regard, 4a was the most abundant genotype followed by 3a, and 2c. The maximum diversity of genotypes and subtypes was observed in South Arabia [G-1 (1a, 1b, 1g), G-2 (2a, 2c), G-3 (3a) and G-4 (4a, 4d, 4n, 4o, 4r, 4s)] followed by Egypt [G-1 (1b, 1g) and G-4 (4a, 4l, 4n, 4m, 4u)], Iran [G-1 (1b) and G-3 (3a) G-6 (6a)], Tunisia [G-1 (1b) and G-2 (2a, 2b, 2c)], Algeria [G-1 (1i), 4(4f), Pakistan [G-1 (1a), G-3(3a, 3b)], Afghanistan [G-1 (1a), GT-3 (3a)], and 5(5a) and Yemen [G-4 (4r)].

Comparative phylogenetic analysis of 278 HCV E1 protein sequences divide the sequences into genotype-specific clusters. Each branch header contains NCBI accession number, country, genotype name, and year of sample isolation. Few branch headers do not contain genotype description because their genotype record was missing at NCBI.
The mean evolution rate of the HCV E1 gene in the MENA region was 1.601 × 10⁻³ (95% HPD interval 1.122 × 10⁻³, 2.081 × 10⁻³) substitutions/site/year and sampling mean prior rate was -2.055 × 10³. Based on the individual coding gene sequences, the average nucleotide diversity in the E1 gene was 0.268. On average, 454 (max: 956 for 4a genotype and min: 36 for 4l genotype) mutation sites were observed in different genotypes with average Tajima’s D test value = -1.067 (Table 1) (27). Taken together, HCV E1 gene is considered under positive selection since all Tajima’s D values are negative for all genotypes (P > 0.10). Datamonkey analysis of coding DNA sequence (CDS) for dN/dS is summarized in Tables 2 and 3. Most of the E1 CDS had SLAC model-based mean dN/dS ratio less than 1 (P < 0.05). The highest dN/dS ratio was observed in 4a, and 4d genotypes followed by 2a, 4u, 1b, and 2c. Furthermore, 4a genotype showed the highest positive selection site followed by 2a, 4d, and 1b genotypes.
| Genotype | Number of Mutations | Nucleotide Diversity | Standard Deviation | Tajima’s D test |
|---|---|---|---|---|
| 1a | 393 | 0.26919 | 0.06676 | -1.28820 |
| 1b | 513 | 0.16632 | 0.02228 | -1.73551 |
| 1g | 257 | 0.22298 | 0.03579 | -0.70035 |
| 2a | 804 | 0.37273 | 0.04727 | -1.26680 |
| 2c | 752 | 0.32333 | 0.03277 | -0.96337 |
| 2g | 68 | 0.09485 | 0.01732 | -0.58834 |
| 3a | 321 | 0.28047 | 0.09067 | -1.50896 |
| 4a | 956 | 0.25293 | 0.01373 | -1.13219 |
| 4d | 612 | 0.29852 | 0.03532 | -0.90753 |
| 4o | 225 | 0.29330 | 0.09484 | -0.8886b |
| 4r | 531 | 0.27851 | 0.06631 | -1.45598 |
| 4u | 645 | 0.39274 | 0.05652 | -0.36978 |
aAnalysis was not done because of less number of sequences required for Tajima’s D test.
bStatistical significance (P < 0.001)
| Genotypes | 1a | 1b | 1g | 2a | 2c | 2g | 3a | ||||||
|---|---|---|---|---|---|---|---|---|---|---|---|---|---|
| Mean dN/dS | 0.1585 | 0.2249 | 0.19876 | 0.2379 | 0.2313 | 0.2133 | 0.1466 | ||||||
| Positive selection sites | 0 | 3 | 0 | 4 | 2 | 0 | 0 | ||||||
| Codon position | 0 | 28 | 44 | 106 | 0 | 8 | 40 | 73 | 108 | 58 | 73 | 0 | 0 |
| dN-dS value | 0 | 1.8525 | 2.0785 | 1.4124 | 0 | 4.1352 | 2.8212 | 3.2354 | 3.3597 | 1.1095 | 1.3131 | 0 | 0 |
| P value | 0 | 0.0863 | 0.0447 | 0.0995 | 0 | 0.0004 | 0.0129 | 0.0007 | 0.0103 | 0.0781 | 0.0313 | 0 | 0 |
| Negative selection sites | 70 | 63 | 22 | 88 | 64 | 27 | 22 | ||||||
aSingle-Likelihood Ancestor Counting (SLAC) method implemented by Datamonekey online tool was used to identify dN (non-synonymous) and dS (synonymous) substitutions at P value 0.1. Indeed, SLAC employs a maximum-likelihood model to infer rates of substations and reports positive selection using posterior probabilities. dN/dS > indicate a positive selection, while < 1 indicate a negative selection site. Analysis was only performed on the genotypes that have ≥ 3 sequences.
| Genotypes | 4a | 4d | 4o | 4r | 4u | ||||||||
|---|---|---|---|---|---|---|---|---|---|---|---|---|---|
| Mean dN/dS | 0.1997 | 0.1669 | 0.2588 | 0.1672 | 0.1314 | ||||||||
| Positive selection sites | 5 | 4 | 0 | 0 | 2 | ||||||||
| Codon position | 12 | 41 | 44 | 57 | 65 | 12 | 41 | 44 | 86 | 0 | 0 | 58 | 60 |
| dN-dS value | 26.075 | 77.061 | 58.897 | 18.0157 | 16.8035 | 8.3964 | 16.5213 | 21.0521 | 4.4983 | 0 | 0 | 2.9202 | 3.4037 |
| P value | 0.0012 | 3.9927e-10 | 1.758e-08 | 0.00016 | 0.0243 | 0.0093 | 0.0044 | 0.0005 | 0.0833 | 0 | 0 | 0.0814 | 0.04218 |
| Negative selection sites | 111 | 79 | 3 | 23 | 41 | ||||||||
aSingle-Likelihood Ancestor Counting (SLAC) method implemented by Datamonekey online tool was used to identify dN (non-synonymous) and dS (synonymous) substitutions at P value 0.1. Indeed, SLAC employs a maximum-likelihood model to infer rates of substations and reports positive selection using posterior probabilities. dN/dS > indicate a positive selection, while < 1 indicate a negative selection site. Analysis was only performed on the genotypes that have ≥ 3 sequences.
3.2. Comparative Residue Analysis and Sequence Conservancy
Residue diversity and/or conservancy at all amino acid sites are presented in WebLogo (Figure 4). WebLogo produced a consensus output sequence from the given input sequences, wherein, a series of letter stacked over each other at each polymorphic site. The height of each letter within a stack is proportional to the relative frequency of the residue at that position in the consensus sequence. The pairwise analysis of genetic distances shows a higher degree of nucleotide identity in E1 residue between genotypes 1a and 1b, between 2c and 2g, and between 4a, 4d, and 4o (Figure 2).
. Vertical rectangles highlight the epitopes regions. Owing to software limitation, those genotypes (3b, 4l, 4m, 4n, 4g) that had less than 3 sequences were excluded.")
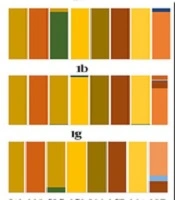
Residue analysis of HCV E1 protein. Constructing multiple sequence alignments, the diversity and/or conserveness of residues at each position were analyzed by WebLogo 3.1 (21). Vertical rectangles highlight the epitopes regions. Owing to software limitation, those genotypes (3b, 4l, 4m, 4n, 4g) that had less than 3 sequences were excluded.
The relative conservancy of the E1 protein epitope sequences is presented in Table 4. Genotypes 2a and 4m had the lowest conservancy among all the genotypes. The highest conservancy (100%) in H111 monoclonal antibody epitopes (192YQVRNSSGLYH202) was observed in 1a and 3a genotypes, while multiple substations were observed in all other genotypes (Table 5). Similarly, the other two reported epitopes of monoclonal antibodies for A4 (197SSGLYHVTNDC207) and A6 (230VREGNASRCW239) antibodies also showed relatively high sequence conservancy in 1a compared with the rest of the genotypes. A high degree of conservancy was observed for 257QLRRHIDLLV266 epitope (this epitope was predicted in the immune epitope database (28) and has never been reported in the literature before) among different genotypes. In addition to epitope motifs, a classical 266CXXC229 motif that mediates the isomerization of disulfide bonds in E1 during virus entry (29) is also highly conserved among all genotypes (Table 5). The percentage substitution of key residue sites was determined. Direct drug binding sites that trigger the resistance against direct-acting antivirals were mostly conserved across genotypes (Figure 5).
| Genotype | Epitope Sequence | Percent Conservancy | Immunogenicity | ||
|---|---|---|---|---|---|
| Median | Min Identity, % | Maxi Identity, % | |||
| 1a | 192YQVRNSSGLYH202 | 100 | 90.00 | 100.00 | 0.23502 |
| 197SSGLYHVTDC207 | 0 | 70.00 | 80.00 | 0.11232 | |
| 230VREGNASRCW239 | 92.3 | 50.00 | 100.00 | -0.04545 | |
| 257QLRRHIDLLV266 | 100 | 90.91 | 100.00 | -0.24264 | |
| 1b | 192YQVRNSSGLYH202 | 69.89 | 77.78 | 100.00 | 0.08 |
| 197SSGLYHVTDC207 | 79.48 | 72.00 | 100.00 | 0.25706 | |
| 230VREGNASRCW239 | 10.98 | 40.00 | 100.00 | -0.169 | |
| 257QLRRHVDLLV266 | 95.9 | 70.00 | 100.00 | 0.08034 | |
| 1g | 192YQVRNSSGLYH202 | 55.6 | 70.00 | 90.00 | 0.12609 |
| 197SSGLYHVTDC207 | 77.8 | 80.00 | 90.00 | -0.31315 | |
| 230 VREGNASRCW 239 | 100 | 90.91 | 100.00 | 0.25706 | |
| 257QLRRHIDLLV266 | 77.8 | 72.73 | 100.00 | 0.08034 | |
| 2a | 192VQVRNTSDSYM202 | 0 | 30.00 | 70.00 | 0.0495 |
| 197TSDSYMVTNDC207 | 0 | 27.27 | 81.82 | -0.325 | |
| 230VRTGNKSRCW239 | 3.2 | 30.00 | 90.00 | -0.31315 | |
| 257SLRRHVDLMV266 | 0 | 45.45 | 72.73 | 0.25706 | |
| 2c | 192 VEVRNTSTSYM202 | 1.8 | 40.00 | 100.00 | 0.07943 |
| 197TSTSYMATNDC207 | 42.9 | 60.00 | 100.00 | 0.19978 | |
| 230VRTGNKSRCW 239 | 76.8 | 72.73 | 100.00 | -0.246 | |
| 257SLRRHVDLMV266 | 33.9 | 63.64 | 100.00 | -0.16936 | |
| 3a | 192VEVKNNSDTYM202 | 76.2 | 54.55 | 100.00 | 0.01476 |
| 197NSDTYMVDLLV207 | 90.5 | 70.00 | 100.00 | 0.0495 | |
| 230VRTGNKSRCW 239 | 95.2 | 72.73 | 100.00 | 0.06968 | |
| 257SLRRHVDLMV266 | 0 | 40.00 | 80.00 | -0.07535 | |
| 4a | 192VHYRNVSGIYH202 | 78 | 40.00 | 100.00 | 0.0495 |
| 197VSGIYHVTNDC207 | 3.5 | 27.27 | 90.91 | 0.065 | |
| 230VRTGNKSRCW239 | 10.4 | 30.00 | 90.00 | -0.27415 | |
| 257SLRRHVDLMV266 | 54.6 | 27.27 | 100.00 | 0.25706 | |
| 4d | 192VHYRNVSGIYH202 | 98.36 | 80.00 | 100.00 | -0.02337 |
| 197VSGIYHVTNDC207 | 14.75 | 50.00 | 90.00 | -0.14895 | |
| 230VRTGNKSRCW239 | 57.38 | 72.73 | 90.91 | 0.18971 | |
| 257SLRRHVDLMV266 | 0 | 36.36 | 63.64 | -0.22298 | |
| 4l | 192VHYRNVSGIYH202 | 100 | 90.91 | 100.00 | 0.25028 |
| 197VSGIYHVTNDC207 | 100 | 90.00 | 100.00 | 0.0495 | |
| 230VRTGNKSRCW239 | 100 | 90.91 | 90.91 | -0.0248 | |
| 257SLRRHVDLMV266 | 0 | 80.00 | 80.00 | -0.19419 | |
| 4m | 192VHYRNVSGIYH202 | 75 | 81.82 | 90.91 | 0.25028 |
| 197VSGIYHVTNDC207 | 25 | 60.00 | 90.00 | 0.0495 | |
| 230VRTGNKSRCW239 | 0 | 81.82 | 81.82 | -0.0248 | |
| 257SLRRHVDLMV266 | 0 | 60.00 | 80.00 | 0.25706 | |
| 4n | 192VHYRNVSGIYH202 | 0 | 72.73 | 81.82 | -0.05824 |
| 197VSGIYHVTNDC207 | 33.3 | 81.82 | 90.91 | 0.25408 | |
| 230VRTGNKSRCW239 | 0 | 70.00 | 80.00 | -0.21958 | |
| 257SLRRHVDLMV266 | 33.3 | 50.00 | 100.00 | -0.31315 | |
| 4o | 192VHYRNVSGIYH202 | 0.5 | 81.82 | 90.91 | 0.15514 |
| 197VSGIYHVTNDC207 | 75 | 81.82 | 90.91 | 0.34646 | |
| 230VRTGNKSRCW239 | 100 | 90.00 | 100.00 | 0.0495 | |
| 257SLRRHVDLMV266 | 25 | 70.00 | 90.00 | -0.293 | |
| 4r | 192VHYRNVSGIYH202 | 100 | 90.91 | 100.00 | 0.34646 |
| 197VSGIYHVTNDC207 | 94.1 | 81.82 | 100.00 | 0.06364 | |
| 230VRTGNKSRCW239 | 100 | 90.00 | 100.00 | 0.0495 | |
| 257SLRRHVDLMV266 | 35.3 | 70.00 | 90.00 | -0.19419 | |
| 4u | 192VHYRNVSGIYH202 | 100 | 100.00 | 100.00 | -0.17642 |
| 197VSGIYHVTNDC207 | 100 | 90.91 | 100.00 | 0.00437 | |
| 230VRTGNKSRCW239 | 100 | 90.00 | 100.00 | 0.16386 | |
| 257SLRRHVDLMV266 | 25 | 70.00 | 100.00 | -0.06237 | |
| Genotype/Subtype | Year | Country | N-Terminal Domain Motifs | ||||
|---|---|---|---|---|---|---|---|
| 1 | |||||||
| Reference | 2002 | USA | 192YQVRNSSGLYH202 | 197SSGLYHVTNDC207 | 226CXXC229 | 230VREGNASRCW239 | 257QLRRHIDLLV266 |
| 1a | 2011 | KSA | ……T…. | .T…….. | …. | …..T…. | ………. |
| 2011 | IRN | ……….. | ..…….. | …. | …..S.K.. | ………. | |
| 2010 | IRN | ……….. | ..…….. | …. | …..S.K.. | ………. | |
| 2008 | IRN | ……T…. | .T…….. | …. | ………. | ………. | |
| 2007 | IRN | ……….. | ..…….. | …. | …..S.K.. | ………. | |
| 1993 | EGP | ……….. | ..…….. | …. | …..S.K.. | ………. | |
| 1b | 2011 | KSA | .EE..V..EF. | V..EF….N. | …. | ………. | TI…V…G |
| 2010 | IRN | .E…A..V.. | ..V……. | …. | ………. | TI…V…. | |
| 2008 | IRN | .E…A..V.. | A..V……. | …. | ………. | TI…V…. | |
| 2007 | IRN | FE…A..M.Q | A..M.Q….. | …. | …N.S…. | TI…V…. | |
| 2000 | TUN | .E…V..A.. | V..A……. | …. | …..Y…. | TI…V…. | |
| 2000 | KSA | .E…V..A.. | V..A……. | …. | …..T…. | TI…V…. | |
| 1993 | EGP | .E…V..A.. | V..A……. | …. | …..R.Q.. | TI…V…. | |
| 1g | 2011 | KSA | .KI..V..I.. | V..I……. | …. | …..V…. | DV…V…. |
| 2002 | EGP | .EI..V..I.. | V..I……. | …. | ………. | DV…V…. | |
| 1993 | EGP | .EI..V..I.. | V..I……. | …. | …..V…. | DV…V…. | |
| 2 | |||||||
| Reference | 2011 | CA | 192VEVKNNSDTYM202 | 197NSDTYMATNDC207 | 226CXXC229 | 230EREGNNSRCW239 | 257GLRAHIDIIV266 |
| 2a | 2011 | SA | .Q…T.NS.. | T.NS..V…. | …. | .N…T…. | …….V.. |
| 2009 | TUN | A….T.Q… | T.Q…….. | …. | .D…T…. | …T…L.. | |
| 2008 | TUN | …R.T.Q… | T.Q…….. | …. | .KDN.T... | …T…L.. | |
| 2007 | TUN | …R.T.Q… | T.Q…….. | …. | …..T…. | …T…A.. | |
| 2006 | TUN | A….T.EL.I | T.EL.I….. | …. | ..KD.E…. | …S.V…. | |
| 2005 | TUN | .Q…TTTS.. | TTTS……. | …. | .LK..S.F.. | …T…T.. | |
| 2004 | TUN | …..T.Q… | T.Q…V…. | …. | .LV..K.L.. | …T…L.. | |
| 2003 | TUN | …..T.Q… | T.Q…V…. | …. | .SVNNV…. | …T…L.. | |
| 2c | 2004 | TUN | …R.T.I… | T.I…….. | …. | ..I..V…. | …T…T.. |
| 2003 | TUN | ....T.VL.. | T.VL……. | …. | .QT..V…. | …T…T.. | |
| 2g | 2011 | KSA | ..IR.I.NS.. | I.NS……. | …. | .RI..V…. | …….V.. |
| 2009 | TUN | ….NT..S.. | NT..S……. | …. | .QI..V…. | ..….A.. | |
| 2008 | TUN | …..T.KS.. | T.KS……. | …. | .RN..V…. | …….V.. | |
| 2007 | TUN | …..T.NS.. | T.NS……. | …. | ..T..V…. | ………. | |
| 2005 | TUN | …..T.TS.. | T.TS……. | …. | .KLD.V…. | …….V.. | |
| 2004 | TUN | …..T..S.. | T..S……. | …. | EQI..I…. | …….V.. | |
| 2003 | TUN | …..T.EL.. | T.EL……. | …. | ..S..G.W.. | …….V.. | |
| 3 | |||||||
| Reference | 2012 | CA | 192LEYRNSSGLYV202 | 197SSGLYVLTNDC207 | 226CXXC229 | 230VRKGNTSQCW239 | 257SLRSHVDLMV266 |
| 3a | 2011 | KSA | ..W..T….. | T………. | …. | .Q…..M.. | .I.G….L. |
| 2016 | PAK | ..W..T….. | T........AR | …. | .QTG…K.. | .I.G….L. | |
| 2011 | IRN | ..W..T….. | T………. | …. | .QD….T.. | .V.R….L. | |
| 2008 | IRN | ..W..T….. | T………. | …. | .QD….T.. | .I……L. | |
| 3b | PAK | …..T….. | T………. | …. | .PCVT.G.K.. | .I.N….L. | |
| 4 | |||||||
| Reference | 2011 | UK | 192VHYRNVSGIYH202 | 197VSGIYHVTNDC207 | 226CXXC229 | 230VRTGNKSRCW239 | 257SLRRHVDLMV266 |
| 4a | 2011 | KSA | .N…A….. | A…..I…. | …. | …..L…. | …S…… |
| 2012 | EGP | IN……… | ……….. | …. | .K…Q…. | …S…… | |
| 2013 | EGP | IN…A..V.. | A..V……. | …. | ..V..Q.S.. | …S…… | |
| 2006 | EGP | TN…A..V.. | A..V……. | …. | ………. | …S…… | |
| 2003 | EGP | TN……… | ……….. | …. | ..S..Q…. | …S…..G | |
| 2002 | EGP | TN……… | ……I…. | …. | ..E..Q…. | …S…… | |
| 1993 | EGP | VN…I..V.. | I..V……. | …. | ..V..Q…. | …S…… | |
| 1993 | EGP | IN……… | ……….. | …. | .RE..Q…. | …S…… | |
| 4d | 2011 | KSA | YN…S..V.. | S..V..V…. | …. | ..V….T.. | ………. |
| 4l | 2011 | EGP | I….A.DV.. | A.DV..V…. | …. | .KV..R.Q.. | …K…… |
| 4m | 2002 | EGP | I.…A..V.. | A..V..V…. | …. | …..V…. | E..H…ML. |
| 1993 | EGP | A….A..V.. | A..V……. | …. | .K…V…. | A……ML. | |
| 4n | 2011 | KSA | I.H..S….. | S………. | …. | ..S..V…. | ………. |
| 4o | 2011 | KSA | I..H.T….. | T………. | …. | ..V..I…. | ………. |
| 2002 | EGP | I….T….. | T………. | …. | V.E……. | …Q…... | |
| 4r | 2011 | YEM | E….A….. | A………. | …. | .K…V…. | .F…….. |
| 2011 | KSA | E….A….. | A………. | …. | ..T..V…. | .F…….. | |
| 1994 | YEM | E….A….. | A………. | …. | .K…V…. | .F…….. | |
| 4f | 2000 | ALG | …H.T..V.. | T..V……. | …. | …..R.Q.. | .V…….. |
| 5 | |||||||
| Reference | 2011 | USA | 192VHYRNVSGIYH202 | 197VSGIYHITNDC207 | 226CXXC229 | 230VRKGNKSRCW239 | 257PLRRHVDLLA266 |
| 5a | 2009 | ALG | .P…A..V.. | A..V……. | …. | …D.V…. | ….A..Y.. |
| 6 | |||||||
| Reference | 2010 | CN | 192LTYGNSSGLYH202 | 197SSGLYHLTNDC207 | 226CXXC229 | 230VKVDNQSTCW239 | 257GFRRHVDLLA266 |
| 6a | 2011 | IRN | ……….. | ……….. | …. | ………. | ………. |
Abbreviations: ALG, Algeria; CA, Canada; CN, China; EGP, Egypt; IRN, Iran; KSA, Kingdom of Saudi Arabia; PAK, Pakistan; TUN, Tunisia; USA, United States of America; YEM, Yemen.
aSelective isolates from each genotype are presented in this table to represent genotype-specific residue mutations in all genotypes reported from the MENA region. Only genotype 1i and 4u are not presented due to unavailability of their reference genome in www.hcv.lanl.gov/ database. All motifs are positioned at the whole genome sequences of HCV. The identical amino acid is shown as “.”
. The results are stated as percentage changes on the individual residue site. *Residue mutations associated with virus entry cycle (<a href=\"#A92437REF7\">7</a>). #Residue mutations associated with drug resistance (<a href=\"#A92437REF7\">7</a>, <a href=\"#A92437REF24\">24</a>, <a href=\"#A92437REF25\">25</a>).")
Residue analysis at direct drug binding sites *T213A, *W239, #I262A, #D263-, #Q289H, #M267V, #F291I, #Y297H. Mutation on these residue sites develop resistance against direct-acting antiviral drugs (flunarizine, phenothiazines, pimozide, ferroquine, and aminoquinoline-derivative molecules). The results are stated as percentage changes on the individual residue site. *Residue mutations associated with virus entry cycle (7). #Residue mutations associated with drug resistance (7, 24, 25).
3.3. Epitope Conservancy and Immunogenicity Analysis
In silico immune responses to previously recognized E1 protein epitopes by cytotoxic T lymphocytes (CTLs) was studied. The epitope immunogenicity predicted on IEDB analysis tools using MHC class I binding tools showed a poor immunogenicity score, wherein, all values were less than 0.4 (threshold for producing strong neutralizing antibodies against HCV E1 protein). The percentage conservancy and immunogenicity, predicted in IEDB, are presented in Table 4. The percentage substitution of key residue sites was determined. Direct drug binding sites that trigger resistance against direct-acting antivirals (flunarizine, phenothiazines, pimozide, ferroquine, and aminoquinoline-derivative molecules) (7, 24, 25) showed high variability in different genotypes. Therefore, mutations within epitope sequences influence their immunogenic potential.
3.4. N-Linked Glycosylation Prediction
HCV E1 is a heavily glycosylated protein that possesses four to five conserved glycosylation sites (196, 209, 234, 305, and 325) in all genotypes. We used NetNglyc 1.0 webserver to predict N-glycosylation on the HCV E1 protein sequences originating from the MENA region. Regardless of E1 sequence origin or genotype, all sequences were heavily glycosylated. Since our sequences were 192-300 AA long, we could only analyze the first three glycosylation sites (196, 209, and 234) in all genotypes (Table 6). Owing to uneven genotype or country-specific sample size, no appropriate statistical model could be applied.
| Genotype | AA Site (Percentage per Site)b | |||||||||||||||||||||||||||||||
|---|---|---|---|---|---|---|---|---|---|---|---|---|---|---|---|---|---|---|---|---|---|---|---|---|---|---|---|---|---|---|---|---|
| Saudi Arabia | Egypt | Iran | Tunisia | Yemen | Afghanistan | Pakistan | Algeria | |||||||||||||||||||||||||
| Nc | 196 | 209 | 234 | N | 196 | 209 | 234 | N | 196 | 209 | 234 | N | 196 | 209 | 234 | N | 196 | 209 | 234 | N | 196 | 209 | 234 | N | 196 | 209 | 234 | 196 | 209 | 234 | ||
| 1a | 11 | 0 | 100 | 9 | 2 | 0 | 100 | 0 | 20 | 0 | 95 | 0 | 0 | 0 | 5 | 50 | 2 | 100 | 0 | |||||||||||||
| 1b | 40 | 78 | 78 | 5 | 1 | 100 | 100 | 0 | 5 | 40 | 60 | 0 | 30 | 97 | 90 | 30 | 0 | 0 | 0 | 0 | ||||||||||||
| 1g | 2 | 100 | 100 | 100 | 7 | 71 | 86 | 43 | 0 | 0 | 0 | 0 | 0 | 0 | ||||||||||||||||||
| 1i | 0 | 0 | 0 | 0 | 0 | 0 | 1 | 0 | ||||||||||||||||||||||||
| 3a | 7 | 14 | 57 | 0 | 0 | 12 | 0 | 33 | 8.3 | 0 | 0 | 22 | 5 | 36 | 38 | 7.8 | 18 | 7.8 | 0 | |||||||||||||
| 3b | 0 | 0 | 0 | 0 | 0 | 0 | 5 | 0 | 60 | 40 | 0 | |||||||||||||||||||||
| 4a | 272 | 36 | 86 | 4 | 250 | 67 | 80 | 12 | 0 | 0 | 0 | 0 | 0 | 0 | ||||||||||||||||||
| 4d | 61 | 4.9 | 93 | 26 | 4 | 100 | 75 | 50 | 0 | 0 | 0 | 0 | 0 | 0 | ||||||||||||||||||
| 4f | 0 | 0 | 0 | 0 | 0 | 0 | 0 | 1 | 100 | 100 | ||||||||||||||||||||||
| 4n | 3 | 0 | 0 | 67 | 0 | 0 | 0 | 0 | 0 | 0 | 0 | |||||||||||||||||||||
| 4o | 1 | 100 | 100 | 100 | 3 | 100 | 67 | 0 | 0 | 0 | 0 | 0 | 0 | 0 | ||||||||||||||||||
| 4r | 12 | 92 | 33 | 75 | 0 | 0 | 0 | 5 | 100 | 0 | 100 | 0 | 0 | 0 | ||||||||||||||||||
| 4s | 2 | 0 | 0 | 0 | 0 | 0 | 0 | 0 | ||||||||||||||||||||||||
| 2a | 3 | 0 | 100 | 0 | 0 | 0 | 19 | 16 | 6.6 | 43 | 0 | 0 | 0 | 0 | ||||||||||||||||||
| 2c | 5 | 100 | 0 | 100 | 0 | 0 | 56 | 0 | 1.7 | 52 | 0 | 0 | 0 | 0 | ||||||||||||||||||
| 4l | 0 | 3 | 0 | 100 | 33 | 0 | 0 | 0 | 0 | 0 | 0 | |||||||||||||||||||||
| 4m | 0 | 4 | 50 | 100 | 75 | 0 | 0 | 0 | 0 | 0 | 0 | |||||||||||||||||||||
| 4u | 0 | 20 | 5 | 85 | 5 | 0 | 0 | 0 | 0 | 0 | 0 | |||||||||||||||||||||
| 5a | 0 | 0 | 0 | 0 | 0 | 0 | 0 | 1 | 100 | |||||||||||||||||||||||
| 6a | 0 | 0 | 1 | 0 | 0 | 0 | 0 | 0 | ||||||||||||||||||||||||
aThe analysis is performed on NetNglyc (26) online tool to predict N-glycosylation at AA site 196, 209, and 234.
bResults are presented in percentage.
cN presents the number of sequences for each genotypes.
4. Discussion
Hepatitis C virus (HCV) is a major public health problem around the globe with more than 2.5% (177.5 million adults) of the world population infected with this disease (2). Asia (2.8%) and Africa (2.9%) are the most infected regions where disease prevalence rates are the highest (2). Globally, 170 million individuals are chronically inflicted of which 15 million people belong to the MENA region (30). Compared to the high HCV prevalence rate in the MENA region, very few complete genome sequences are available from this region. Further, the molecular characterization of circulating strains in this region is also limited. Generally, HCV genotyping is performed by sequencing 5’-untranslated region, hypervariable region in the envelope protein, or by NS5 protein (31). In the present study, we analyzed 937 HCV E1 partial sequences because of E1 functional significance and relative higher E1 sequences availability, belonging to different countries in the MENA region. This is the first of its kind study to perform polymorphism, adaptive mutations, evolution frequencies and dynamics, and their possible impact on virus immunogenicity.
Genotype 4 tends to be the most abundant circulating genotype in Saudi Arabia and Egypt, with more than half of the sequences belonging to subtype 4a. Although genotype 1a and 3a are the most abundantly present worldwide (2); however, only few E1 sequences for these genotypes are available in NCBI nucleotide repository for MENA region. Based upon available E1 protein sequences, phylogenetic analysis revealed the highest diversity in genotype 4, clustering it in several subtypes (4a, 4d, 4f, 4m, 4n, 4o, 4r, 4s, and 4u). The mean evolution rate of E1 protein was 1.601 × 10⁻³ substitutions/site/year, which is comparable to previous estimates (32, 33). Phylogenetic and evolution rates analysis of E1 protein reported previously from China indicated that E1 protein is under positive selection (32). Similarly, we observed here positive selection for E1 protein with an average nucleotide diversity of 0.268 and Tajima’s value -1.067.
The positive selection sites were randomly located on the entire N-terminal domain (NTD) of 4a, 4d, 2a, 1b, 4u, and 2c genotypes. The NTD is thought to be exposed on the protein surface and, therefore, may act as a target for host antibody responses (33). E1 protein is known to contain several monoclonal antibody epitopes on NTD with potent neutralization effect (34-36). In the present sequences, high residue divergence and poor immunogenicity score prove the concept of immune-driven evolution in these epitope sites (37). Both HCV genotypes and host genetics may determine epitope immunogenicity. Keck, Sung (35) reported that H111 antibody epitopes (192YQVRNSSGLYH202) is highly conserved in 1a, 1b, 2b, and 3a genotypes and blocks HCV virion attachment to the host cells. Contrary to these findings, we observed poor conservancy and immunogenicity of this epitope across HCV genotypes circulating in the MENA region. In fact, these epitope studies are mostly performed on genotype 1 peptide sequence that may not align with other genotypes (35). Therefore, antibodies specific for one genotype may indicate poor neutralization against other HCV genotypes and compromise the efficiency of the vaccine. Owing to the inconsistent sequence number in all genotypes, no statistical trend for epitope conservancy and immunogenicity could be observed among genotypes in this study. Surprisingly, all glycosylation sites (n = 783) predicted here fall in these antibody epitopes. These glycosylations might mask epitopes from host antibody responses, and enhance protein folding, and virion formation (38).
In conclusion, the current study analyzes HCV E1 protein for genotype distribution and polymorphism in the MENA region. The study identifies the high genetic diversity and polymorphism in HCV E1 protein, albeit very few and uneven genotype-specific sequence coverage in the region. Most of the sequences are reported from Saudi Arabia and Egypt, which belong to genotype 4. The high variability in glycosylation and residue mutation score among different genotypes correlate with the number of sequences in each genotype; for example, 4a has more than 500 sequences but 4m to 4u genotypes have only few sequences that present fewer glycosylation sequons and mutation score. However, virus pathogenicity is genotype-specific since genotype 1 shows a poor response to interferon therapy compared with the genotype 2 or 3. The development of direct-acting antiviral drugs can significantly improve responses of interferon therapy. We could not determine specific markers of pathogenicity in E1 protein due to limited data available on protein sequences in the literature. The study elucidates E1 protein polymorphism that tends to disguise host immune response and resist direct-acting antivirals. High genetic variability in E1 protein and superimposed glycosylation enhance virus polymorphism and immune escape and make it impossible to develop either effective vaccine or drug against E1 protein of studied genotypes and a multitude of subtypes. Antigenically E1 protein evolves quickly, with correspondingly high rates of positive selection, as inferred in Tajima’s D test and MCMC analysis. The genetic diversity of HCV E1 represents these observed changes; meanwhile, the functional implications of these mutations would shed light on specific roles of virus evolution and pathogenicity. Further efforts are required for comprehensive genome analysis that may support effective control of HCV infection in the region.
