


1. Background
As a metabolic disorder, nonalcoholic fatty liver disease (NAFLD) is characterized by excessive triglyceride (TG) accumulation in hepatocytes in the absence of excessive alcohol consumption (1, 2). Today, NAFLD has become a major health problem owing to its high prevalence and that it augments the chances of progression to liver cirrhosis and liver cancer, and increased the risk of cancer and cardiovascular diseases (3). Current prevalence of NAFLD is estimated to be 24% - 42% in the western countries and 5% - 40% in Asian countries (2). A systematic review estimated the prevalence of NAFLD in Iran as 33.9% (95% CI: 26.4 - 41.5) (4). Furthermore, Lankarani et al. showed that the prevalence of the disease is around 21.5% in Shiraz, southern Iran (5). Studies showed that lifestyle, environment, age, gender, body mass index (BMI), visceral adiposity, genetic predisposition and metabolic factors have crucial roles in the incidence of NAFLD (2, 6). Diabetes type 2 and smoking are also other relevant predictors of NAFLD occurrence (7). Different studies assessed the risk factors and predictors of NAFLD, and the expectation is that changing the possible risk factors would affect the progression of the disease. However, at the time of our literature review, studies evaluating regression and progression of NAFLD concurrently through a single longitudinal study are rare; and evidence about regression of NAFLD are not as high as its development or progression.
2. Objectives
This cohort study was conducted to reveal the factors influencing the regression of the NAFLD.
3. Methods
3.1. Study Population
The present cohort research was carried out in Shiraz, a major metropolitan city in southern Iran. A multistage proportional and cluster random sampling, based on homes’ postal codes was used. According to seven postal districts of Shiraz, we divided the needed sample size proportionally among these districts. Then from each of the districts, the needed sample size was selected through random sampling from listed postal codes. Each of the seven postal code districts was considered as a cluster and one person at least 18 years old was selected randomly from each house. The exclusion criteria were being non-Iranian, being pregnant, or having delivered within the previous six months. Over a 10-month period (from November 2012 to September 2013), 844 participants took part in the first phase of this study. The main aim of the cohort study was to assess non-communicable diseases in Shiraz, Iran. The cohort protocol was specifically explained in the Lankarani et al. study (5). Four years later (2017), the second phase of the study was carried out, where 554 out of the 844 subjects participated, and all steps of study were repeated for them. According to the fatty liver stages in the two phases, subjects were classified into 3 groups: (1) Unchanged group, including normal or those with mild NAFLD grade, in both phases. Those who had moderate or severe NAFLD grade in both phases, were excluded due to their limited numbers. (2) Regressed group, including those who suffered from certain stages of fatty liver in phase 1, yet their status had improved with lower fatty liver stages in the second phase. (3) Progressed group, included participants who got worse based on their fatty liver stages.
3.2. Measurements
At the baseline of the study, a questionnaire including demographic, and social characteristics was completed through a face to face interview. The information was collected based on the marital status (single/married), education (lower/higher than 12 years), job status (employed/ unemployed), and tobacco use at the baseline. Dietary intake was evaluated in both phases, using a 168-item food frequency questionnaire (FFQ) (8) which assessed food intake over the previous year and analyzed via Nutritionist-4 software modified for Persian food by National Nutrition and Food Technology Research Institute. A physically active person was defined as an individual who has an activity for at least 150 to 300 minutes a week of moderate-intensity, or 75 to 150 minutes a week of vigorous-intensity, or an equivalent combination of moderate- and vigorous-intensity (9). Height was measured through the use of a tape measure to the nearest 0.1 cm and weight was measured, with a measurement accuracy of 0.1 kg, while wearing light clothes. The BMI was calculated as weight/height2 (kg/m2). Waist circumference (WC) was measured by measuring the distance around the narrowest area of the waist between the lowest rib and iliac crest and above the umbilicus using a non-stretchable tape measure (10). Fasting blood sugar (FBS), serum levels of TG, low-density lipoprotein (LDL), and high-density lipoprotein (HDL) and systolic blood pressure (SBP) and diastolic blood pressure (DBP)-according to the WHO criteria (11)- were measured for each person in both phases. NAFLD was detected by abdominal ultrasonography which revealed an increase in the echogenicity of liver parenchyma and a decrease in the echogenicity of portal vein or diaphragm (2). For prevention of inter-observer error, abdominal ultrasonography was done by the same radiologist and the same protocol. Consultation with internal medicine specialist was conducted for participants who were not under clinical follow up or who had not been visited previously by internists. After examination, the study population were informed about their fatty liver status.
3.3. Statistical Analysis
The data were expressed as median percentage. Amount of differences between the two phases of study (delta: Δ) were calculated for quantitative variables, such as BMI (kg/m2), WC (cm), calories (Kcal), protein (gr), fat (gr) and carbohydrate (gr) intakes, FBS, TG, LDL, and HDL. Kruskal-Wallis and chi-squared tests were used as univarible analysis. In the next step, variables such as age, Δ-BMI, Δ-WC, Δ-calories and carbohydrate intake, Δ-FBS, Δ-TG, Δ-LDL and Δ-SBP, and also marital status, education, job status, with p-value less than 0.2 in univariable analysis, were entered into the multi-nominal logistic regression analysis to examine the relative risk of regression and progression of NAFLD, and no change group was considered as reference group. Collinearity among variables was assessed using variance inflation factor (VIF) before multivariate analysis and no collinearity was observed (VIF = 1). The IBM SPSS statistics (version 20-IBM corporation-USA) and Nutritionist-4 (version 3.5.2, N-Squared Computing and First DataBank of The Hearst Corporation-USA) were used to do statistical and food intake analysis, respectively.
4. Results
Out of 844 participants in the first stage, 554 (65.6%) attended in the second stage of this study. After excluding participants who had moderate (n = 13) or severe (n = 4) NAFLD in both phases, analysis was done on 537 participants, of whom 163 (30.3%) showed regression of their NAFLD compared to 93 (17.3%) that developed NAFLD or their NAFLD had progressed. The median age of participants in the second stage was 44 years and 308 (57.3%) were female. In the second stage, among all participants, the median of BMI was 26.0 kg/m2. Prevalence of normal, mild, moderate, and severe grades of NAFLD was 53.9%, 23.6%, 16%, 6.5%, in the first and 54.0%, 35.7%, 8.5%, 0.9% in the second phases of study, respectively. Furthermore, history of hyperlipidemia, hypertension, diabetes, overweightness and obesity was 19.6%, 11.1%, 7.0%, 42.2%, 19.6%, in the first and in 25.1%, 22.2%, 10.4%, 42.7%, 18.5% in the second phases of study, respectively. Characteristics of participants in case of demographic, social, anthropometric and medical status were shown in Table 1.
| Variables | Regressed (N = 163) | Progressed (N = 93) | Unchanged (N = 281) | P Value |
|---|---|---|---|---|
| Age, median (IQR), y | 50 (43, 58) | 40 (31, 49) | 41 (29, 50) | < 0.001 |
| Δ-Daily calories intake, median (IQR), Kcal | 131.0 (-429.5, 497.0) | 281.0 (-84.0,770.0) | 125.0 (-241.1, 637.5) | 0.02 |
| Δ-Daily protein intake, median (IQR), gr | 6.7 (-12.7, 26.7) | 3.6 (-16.8, 20.2) | 3.4 (-12.9, 24.1) | 0.34 |
| Δ-Daily fat intake, median (IQR), gr | -15.1 (-27.7, 0.7) | -19.8 (-39.0, -1.2) | -18.5 (-32.3, -1.2) | 0.22 |
| Δ-Daily carbohydrate intake, median (IQR), gr | 52.1 (-23.5, 145.6) | 92.8 (35.7, 172.8) | 61.0 (-0.3, 156.6) | 0.01 |
| Δ-BMI, median (IQR), kg/m2 | -0.6 (-1.8, 0.7) | 0.9 (-0.4, 2.2) | 0.1 (-0.9, 1.4) | < 0.001 |
| Δ-WC, median (IQR), cm | 6.0 (2.0, 11.0) | 10.0 (6.5, 15.0) | 7.0 (3.0, 12.0) | < 0.001 |
| ∆-FBS, median (IQR), mg/dL | 2.0 (-11.5, 14.0) | 8.0 (-1.0, 19.0) | 5.0 (-4.0, 14.0) | 0.01 |
| ∆-TG, median (IQR), mg/dL | -23.0 (-68.0, 16.0) | 1.0 (-32.0, 42.0) | -8.0 (-38.0, 37.0) | 0.001 |
| ∆-LDL, median (IQR), mg/dL | -18.0 (-42.0, 8.0) | -5.0 (-32.2, 22.2) | -8.0 (-29.0, 13.0) | 0.02 |
| ∆-HDL, median (IQR), mg/dL | -3.0 (-14.0, 6.0) | -3.0 (-11.0, 8.0) | -3.0 (-12.0, 6.0) | 0.81 |
| ∆-SBP, median (IQR) | 0.0 (-8.0, 11.0) | 0.0 (-9.0, 10.5) | -1.0 (-10.8, 10.0) | 0.13 |
| ∆-DBP11, median (IQR) | 1.0 (-7.0, 8.0) | 2.0 (-3.0, 10.5) | 2.0 (-4.0, 8.3) | 0.43 |
| Gender, No. (%) | ||||
| Male | 75 (32.8) | 44 (19.2) | 110 (48.0) | |
| Female | 88 (28.6) | 49 (15.9) | 171 (55.5) | 0.22 |
| Marital status, No. (%) | ||||
| Married | 154 (32.6) | 80 (16.9) | 239 (50.5) | |
| Single | 9 (14.1) | 13 (20.3) | 42 (65.6) | 0.01 |
| Education, No. (%) | ||||
| ≤ 12 years | 49 (23.1) | 43 (20.3) | 120 (56.6) | |
| > 12 years | 114 (35.2) | 50 (15.4) | 160 (49.4) | 0.01 |
| Job status, No. (%) | ||||
| Employed | 48 (25.5) | 35 (18.6) | 105 (55.9) | |
| Unemployed | 115 (33.2) | 58 (16.8) | 173 (50.0) | 0.18 |
| Tobacco use, No. (%) | ||||
| Yes | 36 (36.0) | 16 (16.0) | 48 (48.0) | |
| No | 124 (28.8) | 75 (17.4) | 231 (53.7) | 0.37 |
| Physical activity, No. (%) | ||||
| Yes | 54 (26.5) | 35 (17.2) | 115 (56.4) | |
| No | 96 (32.1) | 52 (17.4) | 151 (50.5) | 0.35 |
Abbreviations: Δ, difference between two phases of cohort study (phase 2 - phase 1) ; BMI, body mass index; DBP, diastolic blood pressure; FBS, fasting blood sugar; HDL, high-density lipoprotein; IQR, inter-quartile range; LDL, low-density lipoprotein; NAFLD, Non-alcoholic fatty liver disease; SBP, systolic blood pressure; TG, triglyceride; WC, waist circumference.
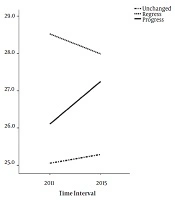
There were significant differences between regressed, progressed and unchanged groups in terms of participants’ age, marital status, and education, and Δ-daily calories and carbohydrate intakes, and value of BMI, WC, FBS, and serum TG, and LDL. Analysis showed that Δ-daily calories intake (P = 0.02), Δ-daily carbohydrate intake (P = 0.01), Δ-BMI (P < 0.001), Δ-WC (P < 0.001), Δ-FBS (P = 0.01), Δ-TG (P = 0.001), and Δ-LDL (P = 0.02) were significantly lower in regressed than progressed groups. Moreover, participants who were married (P = 0.01), and had an education of lower than 12 years (P = 0.01) were significantly more frequent in regressed compared to the progressed group. Results of multi-nominal regression, were shown in the Table 2. Every one unit decrease in difference of BMI (BMI in phase 2 minus BMI in phase 1), increased the relative risk of improvement by 13.3 percent (RR: 0.86; 95% CI: 0.77 - 0.96; P = 0.01) and decreased the relative risk of deterioration of the disease by 14.3% (RR: 1.14; 95% CI: 1.009 - 1.29; P = 0.03). Age was also a significantly effective covariate in increasing the relative risk of improvement, although it was not effective in progression of the disease. Trend of BMI Changes in regressed, progressed and unchanged groups of NAFLD was shown in Figure 1 and effect of Δ-BMI on the incident risk of regression and progression of NAFLD, was shown in the Figure 2.
| Variables | Regressed vs. Unchanged Group | Progressed vs. Unchanged Group | ||||
|---|---|---|---|---|---|---|
| RR | 95% CI | P Value | RR | 95% CI | P Value | |
| Age | 1.06 | 1.04 - 1.09 | < 0.001 | 1.005 | 0.98 - 1.03 | 0.71 |
| Δ-BMI | 0.86 | 0.77 - 0.96 | 0.01 | 1.14 | 1.009 - 1.29 | 0.03 |
| Δ-Daily calories intake | 1.00 | 0.99 - 1.006 | 0.68 | 1.00 | 0.99 - 1.00 | 0.23 |
| Δ-Daily carbohydrate | 1.003 | 0.99 - 1.006 | 0.10 | 1.001 | 0.99 - 1.005 | 0.73 |
| Δ-WC | 1.004 | 0.97 - 1.03 | 0.80 | 1.03 | 0.99 - 1.07 | 0.05 |
| ∆-FBS | 0.99 | 0.98 - 1.001 | 0.10 | 1.004 | 0.99 - 1.01 | 0.40 |
| ∆-TG | 0.99 | 0.99 - 1.002 | 0.48 | 0.99 | 0.99 - 1.003 | 0.74 |
| ∆-LDL | 0.99 | 0.99 - 1.003 | 0.26 | 0.99 | 0.99 - 1.005 | 0.69 |
| ∆-SBP | 0.99 | 0.98 - 1.01 | 0.90 | 1.01 | 0.99 - 1.03 | 0.29 |
| Marital status | ||||||
| Single (ref) | ||||||
| Married | 1.19 | 0.49 - 2.58 | 0.68 | 1.29 | 0.57 - 2.88 | 0.53 |
| Education | ||||||
| ≤ 12 years (ref) | ||||||
| >12 years | 0.78 | 0.47 - 1.27 | 0.32 | 1.05 | 0.60 - 1.84 | 0.85 |
| Job status | ||||||
| Unemployed (ref) | ||||||
| Employed | 1.51 | 0.89 - 2.58 | 0.12 | 1.26 | 0.70 - 2.28 | 0.43 |
Abbreviations: Δ, difference between two phases (phase 2 - phase 1); BMI, body mass index; CI, confidence interval; FBS, Fasting blood glucose; LDL, low-density lipoprotein; NAFLD, non-alcoholic fatty liver disease; ref, reference; RR, relative risk; SBP, systolic blood pressure; TG, triglyceride; WC, waist circumference.

Trend of median changes of BMI and standard error bars at the baseline and follow up in regressed, progressed and unchanged groups of NAFLD patients during four years of a cohort study in Shiraz, Iran
 of regression (A) versus progression (B) of NAFLD status according to BMI changes (Δ-BMI) through a four-year cohort study in Shiraz, Iran")
Relative risk (RR) of regression (A) versus progression (B) of NAFLD status according to BMI changes (Δ-BMI) through a four-year cohort study in Shiraz, Iran
5. Discussion
In this cohort study, association of demographical, social, anthropometrical, dietary and medical factors with the improvement or progression of NAFLD were assessed. Based on the univariable analysis, variables such as age, Δ-daily calories intake, Δ-daily carbohydrate intake, Δ-BMI, Δ-WC, Δ-FBS, Δ-TG, Δ-LDL, Δ-SBP, marital status, and education were associated with changing of NAFLD status.
5.1. Demographic and Social Risk Factors of NAFLD Regression or Progression
Several studies found that age was associated directly with NAFLD; with increasing age, the possibility of NAFLD would be more (1, 2, 6), but these studies were mostly cross sectional. Furthermore, there is an age-related increase in visceral adiposity and muscles and liver fat deposition, which is associated with NAFLD (12). In recent study, age was a predictor of higher relative risk of regression. The mean rank of age was significantly higher in the regression group, suggesting that patients were more self-concern than the first phase of the study by their age increased over the time. However, analysis of our variables did not show any association between physical activity and diet with regression and progression of the disease. Factors such as age-related metabolic changes can be considered in later stages of the cohort.
Based on many studies, gender is another factor related to NAFLD, (1, 2) while, some studies reported no gender differences among NAFLD cases (13). Similarly, in the present study, there was no gender difference between the regression and progression groups of NAFLD cases. We also found that marital status and level of education varied amongst the groups; where married participants and those with education level less than 12 years showed more relative risk of regression compared to the counterpart groups. This finding is in opposition to another study that showed those with lower education had a higher risk of NAFLD (14). Lower education probably could be in line with more physical activities, or lower income which would be correlated with lower calorie intake or higher fiber intake from vegetable and legumes as lower price source of food. In line with other researches, tobacco usage was not different among the groups of our study (14, 15). However, other reports revealed that smoking was correlated with NAFLD (12).
5.2. Biochemical Parameters Associated with NAFLD Regression or Progression
The values of Δ-FBS, Δ-TG, and Δ-LDL were significantly lower in the regression group in comparison with the progression group, showing that participants who had followed medical recommendations had a better probability for NAFLD regression. Other studies considered dyslipidemia, hypertension and type 2 diabetes as the risk factors for NAFLD (2, 6). In a Persian Guilan cohort, on 950 individuals, SBP, DBP, FBS and lipid profile such as TG, total cholesterol, and HDL were correlated with NAFLD. However, there was no correlation with LDL (16). In the van den berg et al. study, patients with NAFLD had a higher prevalence of type 2 diabetes (1). Based on a report, blood glucose was an independent variable of advanced NAFLD status and severe fibrosis (17). In a cohort study of a healthy Korean population, NAFLD and its severity had independent and strong association with incidence of diabetes (18). At the baseline of the present study, 10.7% of the participants with NAFLD had diabetes. Conversely, in the unchanged group, the prevalence of diabetes was 4.3%, suggesting that diabetes was a risk factor for NAFLD.
5.3. Dietary and Physical Activity Risk Factors Associated with NAFLD Regression or Progression
As we concluded from univariable analysis, Δ-daily calories and carbohydrate intake were significantly higher in progressed than regressed or unchanged group. Romero-Gomez et al. suggested that dietary habits and physical activity (lifestyle changes), have to be the primary line of treatment concerning NAFLD and nonalcoholic steatohepatitis (NASH) (3). According to another study, diet plays a major role in the development and progression of NAFLD (19). Low carbohydrate diet can reduce liver fat for only a short period of time (20). However, in the long run, reduction of liver fat seems to be a result of weight-loss (21). Whether or not exercise has a direct influence on liver fat is yet to be fully discussed (22, 23). Habitual physical activity was negatively associated with liver fat, independent of BMI, yet dependent on visceral adiposity (24). Regarding the impact of lifestyle modification on NAFLD, controversial recommendations were due to differences in the studies’ design, namely, various forms of lifestyle interventions with different diets and physical activity regimens, absence of standardized endpoints, diverse phenotypes of NAFLD, different follow-ups together with a relatively small number of patients included in the earlier trials.
5.4. Anthropometric Risk Factors Correlated to the NAFLD Regression or Progression
BMI was the main risk factors to influence the NAFLD regression or progression in our study. The results showed that BMI had the most effect on the regression and progression of NAFLD; the reduction in BMI increased the regression of NAFLD and vice versa. However, increasing BMI had a bit more effect on increasing the probability of progression of NAFLD than reduction of BMI in increasing relative risk of its regression. Although NAFLD and its more severe form, NASH, might develop in non-obese patients, the dominant portion of these diseases occurs in obese or overweight individuals (14). The BMI, WC, and weight-to-height ratio were observed to be associated with NAFLD, with BMI being a better index for diagnosing NAFLD (2). Closely associated with NAFLD development and its progression, obesity is a pro-inflammatory condition resulting in insulin resistance (25). It was suggested that, weight reduction, with its clear dose-response association, is the most established treatment for both NAFLD and NASH. In other word the effect of weight loss on histological improvement of liver was found to be dependent on the weight reduction degree, regardless of the method employed to reach it (3). Romero-Gomez, et al. had also showed that weight loss had been further underlined in NASH patients, where weight loss > 7% was related to a clinically meaningful regression of disease status and weight reduction of ≥ 10% was able to ameliorate fibrosis by at least one stage (3) and resulted in improvement of liver enzymes and histology (26). Furthermore, a modest 3 - 5 kg weight gain, regardless of baseline BMI, predicted the development of NAFLD (27). In another study on NASH patients, those with 10% (or more) loss of the total body weight had observably higher rates of fibrosis regression (63% vs.9%) (28).
In western countries, visceral obesity was reported to be associated with the pathogenesis of NAFLD, compared with the overall obesity (29). Accordingly, WC was a well-known surrogate marker of abdominal fat accumulation. However, similar to Hu et al. study that was conducted in East Asia (2), we found that BMI was superior to WC and was a better index of NAFLD status. Fracanzani et al. showed that there was a significant correlation between hepatic steatosis and visceral adiposity, yet failed to show that WC and NASH were correlated at multivariate analysis (30). They indeed proposed that with the appearance of NASH, visceral fat is no longer a significant determinant of the degree of liver damage.
Using ultrasonography was the limitation of our study. In NAFLD, the primary disease of interest is NASH as this NAFLD phenotype carries the risk of hepatic fibrosis and cirrhosis- Ultrasonography findings are unable to differentiate whether nonalcoholic fatty liver or NASH is present. Histopathological findings are excellent benchmarks for the diagnosis of NAFLD; and liver elastography also was a costly method which were not easily accessible to use in our cohort study. Furthermore, Medication adherence was self-reported which was a limitation in our study. As a recommendation, revealing the effect of treatments in participants with decreased BMI, and its effect on regression of NAFLD should be considered in the future studies. We also suggest to compare groups with fixed severity of NAFLD at the beginning and end of the cohort study with other groups in the next researches. According to evidence of obesity and development of NAFLD in children, follow-up cohort on this age group is suggested.
5.5. Conclusions
BMI is the most important determinant of NAFLD regression and progression. The reduction in BMI significantly augments the probability of regression and reduces the probability of the progression of NAFLD.
