


1. Background
Chronic kidney disease (CKD) is a common disorder and an important growing public health problem worldwide. Various factors contribute to this increase, including increased prevalence of diabetes and hypertension (1-3). Moreover, comorbidity of diabetes and hypertension produces an increased risk of some complications (4). As per the global burden of diseases study in 2016, the global disability-adjusted life years (DALY) of CKD was 21 million in 1990, which reached 35 million in 2016, a 62% increase (5). CKD is more common among those aged 65 years or older (23.4-35.8%). However, its prevalence among those 30 years or older is considerable (7.2%) (6). In both developed and developing countries, diabetes and hypertension are major causes of CKD (7). Type 2 diabetes mellitus (T2DM) is a major risk factor for CKD (8), and various studies have investigated its role as an independent risk factor in the incidence of CKD (3, 9, 10). The prevalence of T2DM has been increasing continuously all around the world. Currently, approximately 450 million individuals are affected by T2DM, and it's expected to reach 690 million by 2045 (11). Hypertension is a cause of the incidence and intensification of CKD. It's the second leading cause of kidney failure in the US. Hypertension is the most common chronic disease in developed societies, which each year claims nearly 7.1 million lives globally. According to the annual reports of the US renal data system, up to 25% of CKD cases could be attributed to hypertension in 2013 (12-14). Although some studies have surveyed risk factors and their interaction on CKD progression (15), to the best of our knowledge, no study has investigated the potential interaction of diabetes and hypertension in the incidence of CKD. On the other hand, based on experimental research, there is a potential interaction between these two conditions in causing kidney damage (16).
2. Objectives
Hence, regarding the ascending trend of the prevalence and incidence of diabetes and hypertension, and the expected rise in the incidence of chronic complications such as CKD, the current study aimed to determine the interactive effect (multiplicative and additive) of these two risk factors on CKD incidence.
3. Methods
3.1. Study Population
This study was conducted on the framework of a population-based cohort study in Tehran, named Tehran Lipid and Glucose Study (TLGS), as secondary data analysis. The sampling technique and the methods of measurements in the TLGS have been published before (17). Briefly, the first phase of the TLGS started between 1999 and 2001 on a sample of 15005 individuals aged ≥ 3 years old who were selected using a multi-stage cluster sampling from the east of Tehran. All participants were invited for repeated measurements every three years for the other four consecutive phases up to 2014 (17). A total of 12808 participants aged ≥ 20 years at the baseline, phase 1, (5612 males and 7196 females) were included; exclusion criteria were: individuals with CKD (2061 people), those who developed hypertension or diabetes besides CKD during the follow-up (135 people), those with incomplete information on their baseline serum creatinine or covariates (fasting plasma glucose (FPG), 2-hour post-challenge plasma glucose (2h-PCPG), education, smoking status, body mass index (BMI), triglyceride (TG), total cholesterol (TC), and high-density lipoprotein cholesterol (HDL-C) (1423 individuals), those with unknown outcome status due to leaving the study or death before follow-ups (1692 individuals), or those with no data on serum creatinine during the study period (155 individuals); eventually 7342 eligible subjects aged 20 years or older (3440 males and 3902 females) were fully followed-up. The study proposal was approved by the Research Council of the Research Institute for Endocrine Sciences (RIES) at Shahid Beheshti Medical Sciences University. Written informed consent was obtained from all participants.
Clinical, anthropometric, and laboratory measurements in the TLGS have been published before (3, 17). In the present study, GFR was calculated using the abbreviated predictive formula developed by the Modification of Diet in Renal Disease (MDRD) study and based on serum creatinine (18).
3.2. Definition of Variables and Outcomes
CKD was defined as eGFR < 60 mL/min/1.73 m2. CKD's event date was defined as the mid-time between the first diagnosis of CKD and the last follow-up visit; the follow-up period was calculated as the difference between the mid-time date and the date the subject entered the study. Survival time was considered as the interval between the first and last observation dates for the subjects who were censored and were categorized as lost to follow-up. Diabetes was defined as FPG ≥ 7 mmol/L, 2-h PCPG ≥ 11.1 mmol/L, or history of taking anti-diabetic drugs (19). Hypertension is described as systolic blood pressure (SBP) above 140 mmHg or diastolic blood pressure (DBP) above 90-mmHg or drug use (20).
3.3. Statistical Analyses
To analyze the data, first, the participants were separated into four groups according to their status regarding diabetes and hypertension: Group I: no diabetes and hypertension; Group II: diabetes and no hypertension; Group III: no diabetes but suffer from hypertension; and Group IV both diabetes and hypertension. Then, the baseline variables were compared for each group, separated by gender. Data were presented as mean ± standard deviation for normal continuous variables, median (interquartile range, IQR) for skewed continuous variables, and number (percentage) for classified variables. Continuous variables were compared by ANOVA test if normally distributed and by the Kruskal-Wallis test, in case of skewness. Classified variables were compared by the X2 test.
A significant interaction was found between “diabetes- hypertension” and “gender” in Group IV. Hence, the subsequent analyses were stratified by gender. Three models were built using the Cox Multivariable regression to calculate the hazard ratio of incident CKD for each group in reference to Group I. The first model was run to calculate the crude hazard ratios. The second model was age-adjusted, and the third model was also adjusted for education level, smoking status, BMI, TG, TC, HDL-C, eGFR, and propensity score for being lost to follow-up.
To reduce selection bias (21), propensity score (the estimated probability that a participant would have been followed in the study) was computed using the logistic regression for both genders. For this reason, the baseline measures (including FPG, 2h-PCPG, TG, TC, HDL-C, SBP, DBP, BMI, education level, age, eGFR, taking diabetes-related drugs, lipid and hypertension, and smoking status) were included in a logistic model as exposures, with participation in the follow-up as the outcome; the probability of participation in follow-up was then estimated for every participant.
Finally, using the Cox Multivariable model and by adjusting the variables (Body Mass Index; Total Cholesterol; Triglycerides; High-Density Lipoprotein cholesterol; eGFR; Smoking status; Age; Education Level; Propensity score) the multiplicative interaction of diabetes and hypertension was investigated in both genders. Further, the additive interaction of diabetes and hypertension was also examined by modifying the abovementioned variables and using the following equations:
1- The relative excess risk due to interaction (RERI):
2- The attributable proportion due to interaction (AP):
3- The synergy index (S):
In the absence of an interactive effect, RERI and AP were equal to zero, and S was considered as one (22).
Schoenfeld's global residual test was used to evaluate the proportional hazards assumption. All analyses were performed using SPSS version 19 and STATA version 14 (Stata Corp LP, TX, USA). Statistical significance was considered when P value < 0.05.
4. Results
In total, 7342 participants were studied, that 3440 (46.8%) of them were male. The mean age of males and females was 44.88 ± 13.84 and 38.01 ± 11.72 years, respectively. At the baseline, 374 subjects (5.09%) were diagnosed with diabetes, 963 (13.12%) were suffering from hypertension, and 269 (3.66%) had both conditions. During the following up period (11.31 years; IQR: 7.49-12.98), 1864 participants developed CKD, giving rise to a cumulative incidence of 17.81% in males and 32.06% in females. The baseline characteristics of participants separated by gender are provided in Table 1. Accordingly, a significant difference was found between the groups concerning social, clinical, and biochemical factors for both genders.
| Variable | TOTAL | GROUP 1b | GROUP 2 | GROUP 3 | GROUP 4 | P Value |
|---|---|---|---|---|---|---|
| Men | ||||||
| Number | 3440 | 2646 | 189 | 485 | 120 | |
| Age (years) | 44.88 ± 13.84 | 38.96 ± 12.57 | 51.95 ± 12.26 | 50.37 ± 14.17 | 56.13 ± 11.03 | < 0.001 |
| Education Level (%) | < 0.001 | |||||
| Higher than diploma | 640 (18.6) | 522 (19.7) | 24 (12.7) | 80 (16.5) | 14 (11.7) | |
| Diploma/High school | 1990 (57.8) | 1622 (61.3) | 90 (47.6) | 228 (47.0) | 50 (41.7) | |
| Illiterate/Primary School | 810 (23.5) | 502 (19.0) | 75 (39.7) | 177 (36.5) | 56 (46.7) | |
| Smoking status (%) (current smoker) | 1076 (31.3) | 903 (34.1) | 55 (29.1) | 89 (18.4) | 29 (24.2) | < 0.001 |
| FPG (mg/dl) | 96.32 ± 26 ± 38 | 89.75 ± 8.84 | 158.05 ± 52.74 | 93.48 ± 10.40 | 155.39 ± 54.52 | < 0.001 |
| 2-hPG (mg/dl) | 110.48 ± 53.97 | 98.42 ± 28.06 | 269.70 ± 103.37 | 112.94 ± 33.20 | 271.69 ± 85.73 | < 0.001 |
| SBP (mmHg) | 118.73 ± 16.87 | 113.23 ± 10.80 | 118.78 ± 10.72 | 141.20 ± 17.76 | 149.35 ± 22.61 | < 0.001 |
| DBP (mmHg) | 77.08 ± 10.83 | 73.83 ± 8.19 | 76.29 ± 7.90 | 91.57 ± 9.30 | 91.51 ± 12.24 | < 0.001 |
| BMI (kg/m2) | 25.83 ± 4.11 | 25.31 ± 3.94 | 27.06 ± 4.02 | 27.45 ± 4.23 | 29.01 ± 4.00 | < 0.001 |
| TC (mg/dl) | 199.97 ± 42.40 | 197.01 ± 42.26 | 215.97 ± 44.62 | 206.81 ± 40.49 | 212.48 ± 38.75 | < 0.001 |
| TG (mg/dl) (IQR) | 154 (104-224) | 144 (98-214) | 205 (144-301) | 169 (116-244) | 202 (155-257) | < 0.001 |
| HDL-C (mg/dl) | 37.83 ± 9.30 | 37.88 ± 9.33 | 36.62 ± 9.34 | 38.21 ± 9.48 | 37.08 ± 7.86 | < 0.001 |
| eGFR (ml/min/1.73m2) | 76.78 ± 10.61 | 77.91 ± 10.62 | 74.04 ± 9.89 | 73.19 ± 9.92 | 70.78 ± 8.09 | < 0.001 |
| CKD incidence (%) | 613 (17.8) | 359 (13.6) | 57 (30.2) | 145 (29.9) | 52 (43.3) | < 0.001 |
| Women | ||||||
| Number | 3902 | 3090 | 185 | 478 | 149 | |
| Age (years) | 38.01 ± 11.72 | 35.12 ± 10.14 | 46.91 ± 9.19 | 48.61 ± 11.53 | 52.88 ± 9.15 | < 0.001 |
| Education Level (%) | < 0.001 | |||||
| Higher than diploma | 460 (11.8) | 428 (13.9) | 7 (3.8) | 22 (4.6) | 3 (2.0) | |
| Diploma/High school | 2250 (57.7) | 1969 (63.7) | 72 (38.9) | 179 (37.4) | 30 (20.1) | |
| Illiterate/Primary School | 1192 (30.5) | 693 (22.4) | 106 (57.3) | 277 (57.9) | 116 (77.9) | |
| Smoking status (%) (current smoker) | 160 (4.1) | 123 (4.0) | 18 (9.7) | 11 (2.3) | 8 (5.4) | < 0.001 |
| FPG (mg/dl) | 94.71 ± 29.44 | 87.52 ± 8.71 | 164.48 ± 62.02 | 92.39 ± 10.65 | 164.58 ± 63.41 | < 0.001 |
| 2-hPG (mg/dl) | 114.05 ± 45.69 | 104.09 ± 25.75 | 264.92 ± 73.93 | 121.20 ± 29.00 | 261.72 ± 71.03 | < 0.001 |
| SBP (mmHg) | 114.99 ± 17.23 | 109.39 ± 11.01 | 119.40 ± 10.83 | 138.92 ± 18.14 | 148.90 ± 20.02 | < 0.001 |
| DBP (mmHg) | 76.08 ± 10.49 | 73.07 ± 8.12 | 77.89 ± 6.82 | 90.51 ± 9.51 | 89.96 ± 10.94 | < 0.001 |
| BMI (kg/m2) | 27.22 ± 4.91 | 26.48 ± 4.66 | 29.21 ± 4.47 | 29.90 ± 4.76 | 31.33 ± 5.30 | < 0.001 |
| TC (mg/dl) | 201.59 ± 45.16 | 194.36 ± 41.37 | 225.93 ± 47.71 | 226.38 ± 46.85 | 241.68 ± 51.87 | < 0.001 |
| TG (mg/dl) (IQR) | 123 (85-183) | 110 (79-161) | 216 (146-285) | 163 (121-223) | 214 (165-301) | < 0.001 |
| HDL-C (mg/dl) | 44.60 ± 11.19 | 44.92 ± 11.26 | 40.94 ± 9.49 | 44.60 ± 11.08 | 42.59 ± 11.09 | < 0.001 |
| eGFR (ml/min/1.73m2) | 73.56 ± 9.31 | 74.55 ± 9.50 | 70.26 ± 7.38 | 70.07 ± 7.75 | 68.16 ± 6.32 | < 0.001 |
| CKD incidence | 1251 (32.1) | 853 (27.6) | 80 (43.2) | 234 (49.0) | 84 (56.4) | < 0.001 |
Abbreviations: FBS, Fasting Blood Sugare; 2-hPG, 2-hour Plasma Glucose; SBP, Systolic Blood Pressure; DBP, Diastolic Blood Pressure; BMI, Body Mass Index; TC, Total Cholesterol; TG, Total Triglycerides ; HDL-C, High-Density Lipoprotein cholesterol; eGFR, estimated Glomerular Filtration Rate; CKD, Chronic Kidney Disease.
aValues are Mean ± S.D. or frequency (%). IQR is 25th to 75th percentile.
bGROUP 1, Diabetes−/Hypertension−; GROUP 2, Diabetes +/ Hypertension −; GROUP 3, Diabetes−/ Hypertension +; GROUP 4 Diabetes+/ Hypertension +.
According to the results of Cox regression models, the hazard ratio of CKD for males was greater in group 4 than groups 2 and 3, in all crude, age-adjusted, and Multivariable-adjusted models. For females, in crude and age-adjusted models, the hazard ratio of CKD for females in group 4 was higher than groups 2 and 3; in the multivariable-adjusted model, diabetes and hypertension showed a modest effect on CKD with around 25% increase in the risk (Table 2).
| Variable | GROUP 1b | GROUP 2 | GROUP 3 | GROUP 4 |
|---|---|---|---|---|
| Men | ||||
| Crude | Reference | 3.13 (2.33-4.19) | 2.67 (2.19-3.26) | 5.99 (4.40-8.15) |
| Adjusted for age | Reference | 1.91 (1.42-2.57) | 1.66 (1.35-2.05) | 3.23 (2.36-4.42) |
| Multivariable-adjustedc | Reference | 2.16 (1.60-2.93) | 1.63 (1.29-2.05) | 3.59 (2.59-4.99) |
| Women | ||||
| Crude | Reference | 2.00 (1.57-2.55) | 2.20 (1.89-2.56) | 2.69 (2.15-3.37) |
| Adjusted for age | Reference | 1.28 (0.99-1.65) | 1.35 (1.15-1.59) | 1.44 (1.14-1.82) |
| Multivariable-adjustedc | Reference | 1.24 (0.96-1.60) | 1.28 (1.08-1.51) | 1.25 (0.98-1.59) |
aValues are the Hazard ratio (95% CI).
bGROUP 1, Diabetes−/Hypertension−; GROUP 2, Diabetes +/ Hypertension −; GROUP 3, Diabetes−/ Hypertension +; GROUP 4 Diabetes+/ Hypertension +.
cAdjusted for Body Mass Index; Total Cholesterol; Total Triglycerides; High-Density Lipoprotein cholesterol; estimated Glomerular Filtration Rate; Smoking status; Age; Education Level; Propensity score for being lost to follow-up.
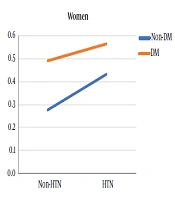
The incidence of CKD in males and females separated by health status (diabetes and/or hypertension) is shown in Figure 1, which depicts no quantitative (i.e. different slops) or qualitative (i.e. crossed lines) interactions between diabetes and hypertension. After introducing diabetes, hypertension, and their multiplicative interaction in the Cox Multivariable regression model, the final result indicated that the multiplicative interaction of diabetes with hypertension, concerning CKD incidence, was not significant either in males (hazard ratio of 1.01 and P value = 0.943) or females (hazard ratio of 0.78 and P value = 0.186) (Table 3).

Incidence of CKD in females and males with and without diabetes and/or hypertension. CKD, Chronic Kidney Disease; DM, Diabetes Mellitus; HTN, Hypertension.
| Multivariable adjusted Modelb | Men | P Value | Women | P Value |
|---|---|---|---|---|
| Diabetes | 2.16 (1.60-2.93) | < 0.001 | 1.24 (0.96-1.60) | 0.096 |
| Hypertension | 1.63 (1.29-2.05) | < 0.001 | 1.28 (1.08-1.51) | 0.003 |
| Diabetes × Hypertension | 1.01 (0.65-1.58) | 0.943 | 0.78 (0.55-1.12) | 0.186 |
aValues are Hazard ratio.
bAdjusted for Body Mass Index; Total Cholesterol; Triglycerides; High-Density Lipoprotein cholesterol; estimated Glomerular Filtration Rate; Smoking status; Age; Education Level; Propensity score for being lost to follow-up.
To investigate the additive interaction of diabetes and hypertension, the previously mentioned equations 1-3 (RERI, AP, S) were used. The additive interaction values for males and females were as follow: RERI= 0.79 (males) and -0.26 (females) using equation 1; AP=0.22 (males) and -0.21 (females), using equation 2; and S=1.44 (males) and S=0.48 (females), using equation 3 (Table 4). Accordingly, no significant additive interaction was detected between diabetes and hypertension concerning the incidence of CKD in either gender.
aAdjusted for Body Mass Index; Total Cholesterol; Triglycerides; High-Density Lipoprotein cholesterol; estimated Glomerular Filtration Rate; Smoking status; Age; Education Level; Propensity score for being lost to follow-up. Interaction exists if RERI > 0, AP > 0, and S > significantly.
bRelative Excess Risk due to Interaction,
cAttributable Proportion due to Interaction,
dSynergy index
5. Discussion
In the present study, the incidence of CKD was almost twice in females than males, which is similar to the findings of previous studies conducted in Iran (3, 23) and a number of other studies (24, 25). Although hypertension and diabetes are independent risk factors of CKD, no significant additive or multiplicative interaction was found between these risk factors concerning CKD incidence. In the present study, after 10 years of follow-up, more than 2% of adults (≥ 20 y/o) develop CKD (stages 3 to 5) each year.
In this study, diabetes was an independent risk factor for CKD in males; however, the evidence was not sufficient to prove such an association for females. Most studies on the association between diabetes and CKD incidence mentioned diabetes as an independent risk factor for CKD incidence (10, 26). Meanwhile, not all studies reported a similar association. Khajehdehi et al. (2014), in a study conducted in Iran, reported no significant association between diabetes and CKD (27). Yamagata et al. also mentioned diabetes as a protective factor for the incidence of CKD stage 3-5 in males and females (28). This difference can be attributed to the time since diagnosis of diabetes in various participants. Al-Rubeaan et al. (2014) showed that a mean diagnosis time of more than 15 years is an important risk factor for developing CKD (odds ratio= 6.30: 5.46-7.27) (10). There are other studies that reported an association between the duration of diabetes and the incidence of CKD, for example, in South Korea, India, and Thailand (29-31). In the present study, the mean age of females and males diagnosed with diabetes was 47 and 52 years, respectively. The lower mean age of females with diabetes, which in turn indicates the probability of lower duration of diabetes diagnosis, can be considered as the main reason for observed differences between females and males. Moreover, since female sex hormones have protective effects for renal function, which is reversed by hyperglycemia, renal damages may present later in females than males (32). In this line, based on TLGS's previous investigations, the present study revealed that diabetes is an independent risk factor for CKD in females, whereas newly diagnosed diabetes, probably with a shorter duration, was not associated with the incidence of CKD (3, 33).
We also investigated the effect of hypertension on CKD incidence. For both females and males, hypertension was an independent risk factor for CKD incidence, which is consistent with the results of previous studies, both in Iran and other countries (1, 3, 23, 27, 34, 35). The lower risk of hypertension for CKD development in females, compared to males, can be attributed to different factors such as female sexual hormones, under-controlled hypertension, and less compliance with treatment in males compared to females (36). Different studies have indicated a close association between diabetes and hypertension, whereby there is considerable overlap in the etiology and influence of these two diseases (37). In the US, 30% of individuals with type I diabetes, along with 50 to 80% of those with type II diabetes, suffer from hypertension (38). In the present study, around 42% of diabetic patients had hypertension, as well. Diabetes and hypertension are two chronic diseases affecting a large portion of the population. The comorbidity of diabetes and hypertension suggests common predisposing factors that can be either genetic or environmental (39). Several studies have reported an association between genetics and developing diabetes and hypertension (40-42). In addition to genetic-related factors, environmental factors are an important arena that needs further investigation (i.e. consumption of high levels of sodium, alcohol and non-saturated fats, smoking, no physical exercise, psychological stress are examples of unhealthy lifestyle) (37). Based on the aforementioned issues, it seems that to investigate the interaction between diabetes and hypertension in the incidence of different diseases, particularly the diseases of interest here, as well as paying attention to the high overlap of these two conditions, the role of genetic and environmental factors driving these two diseases should also be taken in to account. In other words, several genetic, environmental, and behavioral factors contribute to the comorbidity of diabetes and hypertension. Moreover, their interaction is associated with an increased risk of chronic diseases such as CKD and cardiovascular diseases. Nevertheless, to investigate the incidence of these outcomes, studies with longer periods should be implemented.
In conclusion, this study demonstrated that hypertension, regardless of the presence or absence of diabetes, is an independent risk factor for CKD incidence in both genders. The findings also indicated that diabetes is an independent risk factor for CKD incidence in males, while such association was not found for females. Moreover, diabetes has no multiplicative or additive interaction with hypertension in the incidence of CKD.
