


1. Background
Diabetes is one of the most prevalent non-communicable diseases with the highest prevalence among metabolic diseases in the world. Over 90% of diabetics suffer from type 2 diabetes (T2D). The disease is related to short-term and long-term complications that are irreversible in many cases (1). Pathogenicity and mortality of these complications are the major health problems in the world. The increase in the number of patients with T2D shows a global epidemic (2). Over 422 million people in the world have diabetes, and one out of 11 people suffers from the disease. Moreover, 1.6 million annual deaths are directly because of the diabetes (1). It is estimated that by 2030 the number of people with diabetes will reach 643 million (3).
The prevalence of T2D in Iranian adults aged 25 - 64 years is estimated to be 10.3%, which is only half of the cases diagnosed. T2D cases are increasing in Iran mainly due to obesity, overweight, and sedentary lifestyle (4). The World Health Organization (WHO) has estimated that the number of diabetic patients in Iran will reach more than 6 million by 2030 (5).
Although T2D has no definitive cure, it can be controlled by medicines and regular visits to doctors and health service centers, adopting a healthy lifestyle, avoiding health risk behaviors, as well as self-care by the patients. Performing self-care behaviors can reduce the symptoms of hyperglycemia, prevent complications, and increase the quality of life of patients so that they can continue their daily activities like other healthy people. This needs increasing awareness and the capacity to understand and analyze information, and finally, the power of decision-making to adopt and control behaviors appropriate to the disease, which is called health literacy (6). Indeed, by enhancing the level of health literacy of T2D patients, one can hope that while having a high quality of life, these patients will reduce the costs imposed on themselves and their families, as well as society. Nowadays, the role of health literacy in achieving health justice is essential (7).
However, one cannot state that the people have a good level of health simply by having a general literacy and high awareness. Health literacy is a social cognitive skill referring to the capacity of individuals to acquire and process health information and use health services to make appropriate decisions to promote and maintain health (8). In other words, many people, even with general literacy and education, may not be able to read or understand the educational contents and messages provided to them about their health (9). Measuring the status quo from the level of health literacy of this group is the first step to plan educational interventions for the T2D patients.
To the best of our knowledge, no specific instrument has been provided to study the health literacy of T2D patients in Iran so far. Hence, this study aimed to translate a dedicated foreign instrument to assess the health literacy of patients with T2D, as well as to evaluate the psychometric parameters of the Iranian version. We used the Chinese Health Literacy Scale for Diabetes (CHLSD), as it is a comprehensive tool for assessing health literacy; also, the psychometric measurements of this tool confirm its reliability (10). This 34-item questionnaire includes four subscales of remembering, application, understanding, and analysis, and is dedicated to the adult age group with T2D. Although there were other questionnaires to measure the health literacy of diabetic patients, we did not use them because they usually investigated a specific group (like children and adolescents with type 1 diabetes), were not in the scope of the study, were less widespread, and did not measure all the desired aspects (11-14).
Many studies have been carried out in Iran and abroad to evaluate the health literacy status of patients with T2D. In most of these studies, some general tools have been used, and the results have revealed inadequate and unfavorable levels of health literacy (15-19). Reliable results can be obtained from carefully collected data, and it seems essential to have a reliable and appropriate instrument for the target group to collect data with high accuracy (20). Applying appropriate tools for research requires special attention to psychometric criteria (21).
2. Objectives
Considering the significance of health literacy to plan educational and care activities for patients with T2D, which will finally bring about disease control and enhance the living standards of this group of patients, this study was carried out to provide an instrument standardized and tailored to the characteristics of the adult age group with T2D through a process of translation and psychometric measurement.
3. Methods
3.1. Study Design
This methodological research was carried out in two phases. In the first phase, using a standard forward-backward translation procedure (22), the original version of CHLSD, designed in China and made available to scholars in English (10), was translated into Persian. In the second phase, the psychometric parameters of the translated instrument were measured.
3.2. Tool Assessment
The CHLSD was designed to measure the health literacy of patients with diabetes in terms of decision-making on four cognitive levels, including remembering, understanding, applying, and analysis. CHLSD was developed and validated in Hong Kong from April 2009 to March 2010, and it included Chinese patients with T2D aged over 25 years. The CHLSD Questionnaire has 34 items and two sections. The first part has 18 terms or words related to the subject of diabetes, where the participant is asked to pronounce each word aloud, getting a score of 2 if pronounced correctly, 1 if pronounced hesitantly and illegibly, and 0 if it could not be read. In the second part of the questionnaire, some information is provided as medication labels or counseling sheets and care instructions, and 16 questions are asked. Each correct answer is given a score of 2, and any incorrect answer gets a score of 0. The total score of the instrument ranges from 0 to 68, with 48 as the cut-off point; any score below that indicates that people have an inadequate level of health literacy and any score above that shows an adequate level of health literacy.
3.3. Forward-Backward Translation
The WHO forward-backward translation standard protocol was used to translate the instrument from English into Persian after getting permission from the corresponding author as one of the instrument designers (22). Therefore, the questionnaire was translated into Persian by two fluent English experts. One of these experts was active in medical sciences. After making the necessary corrections in the two translations, another expert who was fluent in English and had not previously seen the English version of the questionnaire was asked to back-translate the Persian version into English to determine the degree of conformity with the original questionnaire. The original and the translated version in English were compared, and with the coordination of the people who were in charge of translation and re-translation, minor changes were made by the research team in the wording and some terms. After preparing the Persian version of the instrument, a cognitive interview was conducted with 10 T2D patients, and they were asked to read the questionnaire and give feedback if they had difficulty reading and understanding words and sentences to identify a suitable alternative if needed. They expressed doubts only about the names of the two medicines stated in the questionnaire, not widely used in Iran. So, they were replaced by the generic names that the patients were more familiar with. Ultimately, the psychometric steps of the instrument started.
3.4. Content Validity
The purpose of this evaluation is to answer the question of whether the content of the instrument can measure the goal is set or not (23). To examine the content validity with a qualitative approach, the questionnaire was given to ten specialists in the fields of health education, public health, nursing, endocrinology, and internal medicine to study and give feedbacks on the writing of the scale based on the criteria of grammar, use of appropriate words, necessity, importance, placement of items in their proper place, and proper scoring (24).
The two coefficients of content validity ratio (CVR) and content validity index (CVI) were used for each item to evaluate the content validity with a quantitative approach. Twelve specialists were used for each index to present their opinions. The value specified by Lawshe was used to calculate the CVR (25), and the value specified by Hyrkäs et al. (score 0.79 and above) was used to calculate CVI (26). In calculating the CVR for each item, a three-part spectrum (“necessary”, “useful but not necessary”, and “not necessary”) was used, and items with a score of at least 0.54 were kept in the questionnaire. In calculating the CVI for each item, the degree of relevancy, clarity, and simplicity of each item was evaluated based on a 4-option Likert scale and the score was obtained by summing the agreeing scores for each item that had obtained the third and fourth ranks (highest score) on the total number of specialists. Accepting the items was based on CVI score higher than 0.79.
3.5. Face Validity
This form of evaluation includes the question of whether the appearance of the instrument is properly designed to evaluate the intended purpose or not (23). First, the instruments were given to 12 specialists and patients (six health education specialists, two nursing education specialists, one internal medicine specialist, one endocrinologist, and 2 T2D patients) for qualitative face validity. Using face-to-face interviews, they commented on the degree of difficulty, the degree of appropriateness, and the ambiguity of each item. Then, the instrument was provided to 20 patients with T2D, and finally 16 questionnaires answered appropriately were included. To calculate the impact score, a 5-point Likert scale was used ranging from “absolutely important” to “not important at all” for each item for quantitative face validity, and a score higher than 1.5 was considered to keep the items (27).
3.6. Construct Validity
Ultimately, after the above steps, the final version of the questionnaire was prepared without any changes to assess construct validity and reliability. A cross-sectional study was designed to perform construct validity and reliability. Using convenient sampling method, 400 literate patients with T2D (aged over 25 years) and a history of diabetes for at least one year were selected from among the patients admitted to the specialized diabetes clinic of Khoy, Iran. Of these, 37 were not willing to participate in the study, and finally, 363 people entered the study. Then, 50 patients performed a test-retest at two-week intervals to determine the reliability of stability, 30 patients participated in completing questionnaires to determine internal consistency, and the remaining 283 participated in construct validity. The sample size in this section was determined according to at least ten samples for each item of the questionnaire (28) (Figure 1).
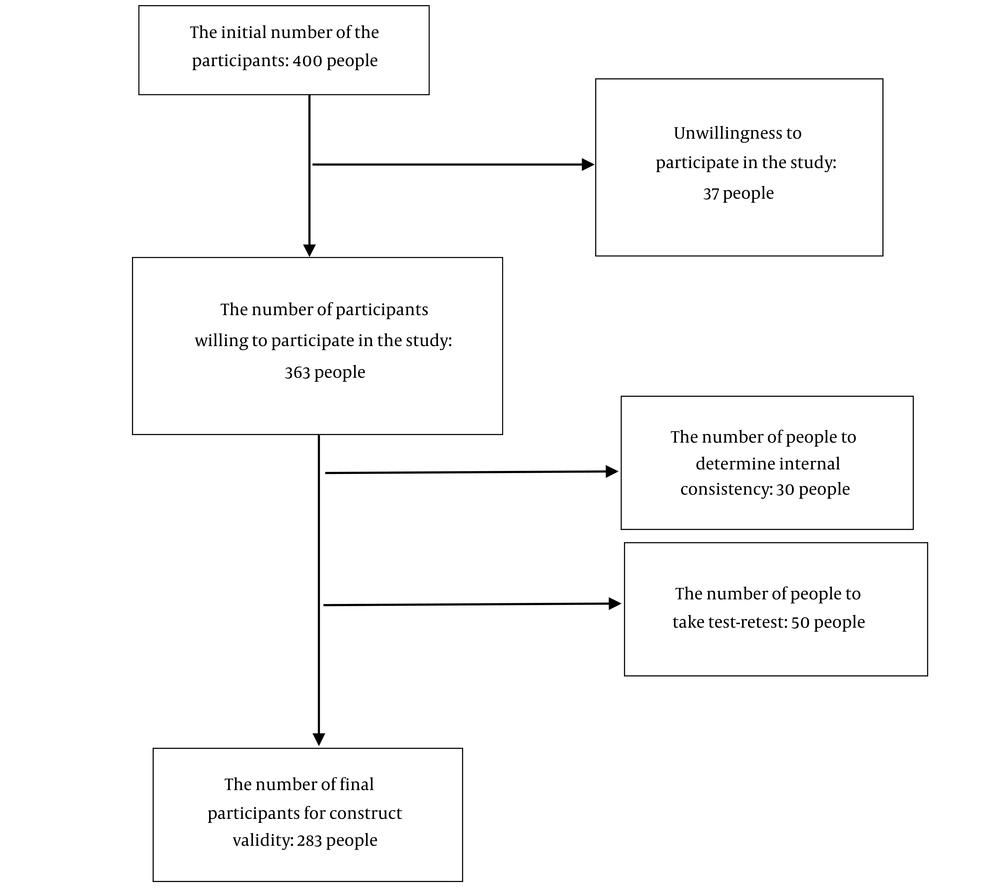
Figure 1.
Assigning the participants in the psychometric stages of the Persian version of diabetes health literacy evaluation instrument
As in the psychometric evaluation of the original version of the questionnaire by instrument designers, exploratory factor analysis (EFA) was carried out to summarize and categorize the data and determine the aspects of the questionnaire. Having an accepted default, it was used to confirm it through convergent validity by the internal consistency method and determine the pattern fit. The model fit was the extent to which a model was compatible with the relevant data. Thus, in this section, the fit of the assumed research model was evaluated to ensure its compatibility with the research data, and finally, the answers to the research questions were inferred (29).
Factor loadings are measured by calculating the correlation of the characteristics of a construct with that construct. If this value is equal to or greater than 0.4, it confirms that the variance between the construct and its parameters is greater than the variance of the measurement error of that construct, and the reliability of model is acceptable (30). The important point is that if the researcher faces values less than 0.4 after calculating the factor loadings between the construct and its indices, s/he must modify those indices (questions) or remove them from his model (30), that was not the case in our study. It has been suggested that researchers consider some indices to determine the pattern fit (31). The indices used in this study were standardized root mean squared residual (SRMR), normalized fit index (NFI), goodness of fit (GOF), d-ULS, and d-G. NFI and GOF indices are from 0 to 1, and the closer the values are to 1, the more appropriate and fit the model (32). The acceptable values for SRMR less than 0.08 show adequate fit, and values less than 0.05 indicate good fit (33, 34). Moreover, the value of Q2 (Stone- Geisser) statistic, determining the predictive power of the model in endogenous structures, was calculated. The models with an acceptable structural fit should be able to predict the endogenous variables of the model. This means that if the relationships between constructs are properly defined in a model, the constructs will have a sufficient effect on each other, and thus the hypotheses are correctly confirmed. Henseler et al. determined the values 0.02, 0.15, and 0.35 as low, medium, and strong predictive power, respectively (35).
3.7. Reliability
Two methods of internal consistency and stability were used to measure the reliability of the translated instrument. To measure internal consistency, Kuder-Richardson (K-R) index was used to the degree of interference of all questions in terms of measuring a common feature. The difficulty level of all questions should be the same to be able to use this test. The questionnaire has acceptable reliability if the values of K-R coefficient are more than 0.7 (36). In this study, a re-test method was used to evaluate the stability of the questionnaire. Re-testing is the completion of an instrument by a group of samples with the same conditions in two or more different times (37). The commonest way to find the correlation between scores in this method is to calculate the Spearman correlation coefficient, that has to have re-test coefficient values greater than 0.8 (35). Test-retest method assumes that the variables or measured concepts, as well as the characteristics of the participants will not change during the course (37).
3.8. Ethics
The ethics committee of Tarbiat Modares University approved the study (IR.MODARES.REC.1398.100). The objectives of the study were explained to all the patients, a written consent was obtained, and they were ensured that their information would be kept confidential.
4. Results
The Persian version of the tool was prepared through a forward-backward translation process by three experts fluent in English. A cognitive interview was conducted with ten T2D patients. Finally, the Persian version of the tool was prepared for evaluation of psychometric parameters.
4.1. Content and Face Validity
In examining the face validity by the specialists and patients, in the quantitative part, all the items were retained and found suitable for further analysis as the “impact score” of all items was higher than 1.5. In the qualitative section, some medical terms that were not widely used in Iran replaced them with similar and widely used drugs in our country. In the content validity review, the views of experts were obtained in the qualitative section and no suggestion that needed to be changed in the questionnaire was received. In quantitative content validity, based on the number of expert members and Lavashe table, as the CVR score of all items was higher than 0.56 and CVI score of items was higher than 0.79, there was no need to delete any items.
4.2. Construct Validity
A cross-sectional study was carried out to perform construct validity. Out of 283 patients, more than half were female (61.1%). The patients’ age ranged from 28 to 72 years with a mean of 52.4 years and a standard deviation of 11.5. About 65% of participants had undergraduate education and a total of 8.1% (n = 23) had university education. The mean history of diabetes was 8.2 ± 5.8 years (range: 2 - 30 years). Most of the participants had at least one complication of diabetes (79%) (Table 1).
Table 1.Demographic Characteristics of the Patients in Cross-sectional Study (Construct Validity) a
| Variables | Values (n = 283) |
|---|---|
| Age | 52.4 ± 11.5 |
| Gender | |
| Female | 173 (61.1) |
| Male | 110 (38.9) |
| Marital status | |
| Married | 257 (90.8) |
| Single | 17 (6) |
| Widow (er) | 9 (3.2) |
| Education | |
| < 12 years | 183 (64.6) |
| ≥ 12 years up to bachelor degree | 90 (31.8) |
| Bachelor's degree and higher | 10 (3.6) |
| Employment status | |
| Housewife | 138 (48.7) |
| Employee | 45 (16) |
| Student | 14 (5) |
| Retired | 73 (25.8) |
| Unemployed | 13 (4.6) |
| Address | |
| Village | 164 (58) |
| City | 119 (42) |
| Complications | 224 (79) |
| Duration of the disease (y) | 8.2 ± 5.8 |
a Values are expressed as mean ± standard deviation or No. (%).
The fit of the hypothesis of the model was evaluated to ensure its compatibility with the research data, and finally the answers to the research questions were inferred (Figure 2). The collected data were analyzed by the Statistical Package for the Social Sciences (SPSS) version 23.0 (IBM), and Amos software version 23 (IBM).
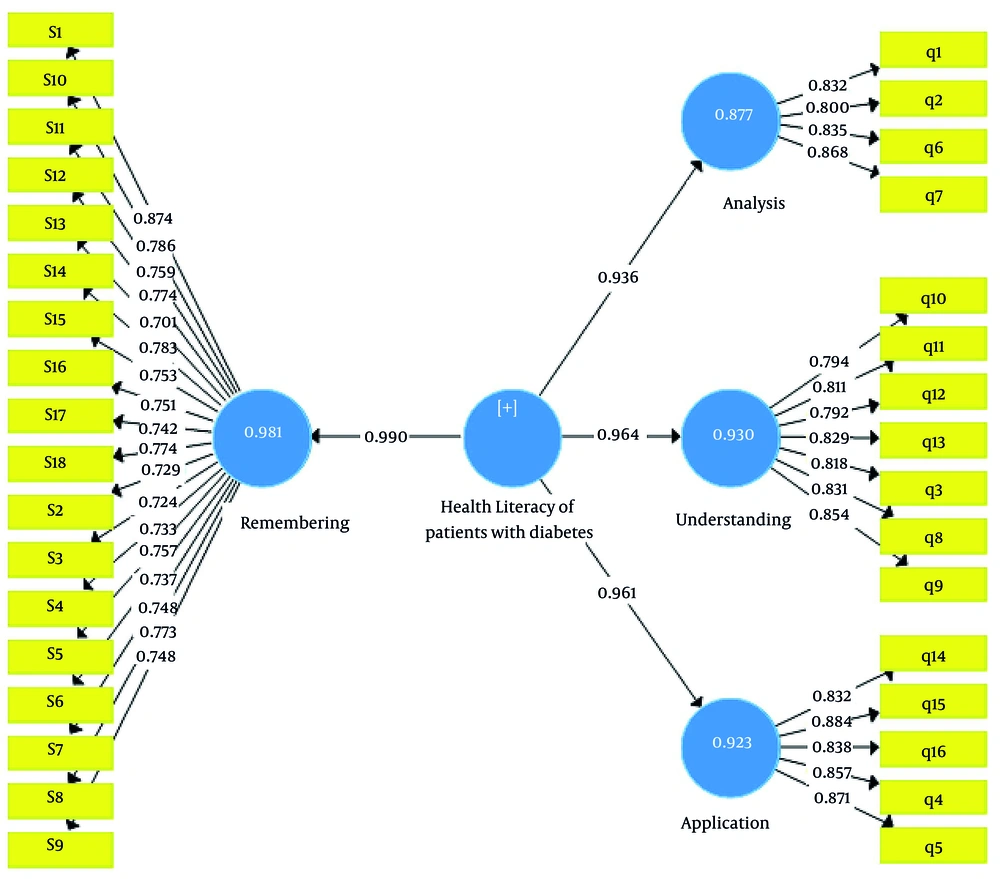
Figure 2.
Research factor loadings model
As Cronbach’s alpha values, combined reliability (internal consistency), and AVE were all in the normal range, one can confirm that the convergent reliability and validity of the research model were appropriate (Table 2).
Table 2.The Results of Convergent Validity (Internal Consistency)
| Variables | Average Variance Extracted (AVE > 0.5) | Combined Reliability Coefficient (Cr > 0.7) | Cronbach's Alpha Coefficients (Alpha > 0.7) |
|---|---|---|---|
| Remembering | 0.576 | 0.961 | 0.957 |
| Application | 0.734 | 0.932 | 0.909 |
| Analysis | 0.696 | 0.901 | 0.854 |
| Understanding | 0.67 | 0.934 | 0.918 |
| Health literacy of patients with diabetes | 0.599 | 0.981 | 0.98 |
Fit indices of the research model are shown in Table 3. Based on the values obtained, the collected data were sufficient to measure the hidden variables and thus, the results of the research model estimate were reliable and trustworthy. The values of Stone-Geisser statistic indicated a strong predictive fit between the variables of the research model (Table 4).
Table 3.Goodness of Fit Criteria for the Research Model
| Variables | Acceptable Range | Observed Value | Result |
|---|---|---|---|
| SRMR | Less than 0.08 | 0.078 | Good fit |
| d-ULS | Less than 0.95 | 0.824 | Good fit |
| d-G | Less than 0.95 | 0.392 | Good fit |
| NFI | More than 0.25 | 0.778 | Good fit |
| GOF | More than 0.25 | 0.573 | Good fit |
Abbreviations: SRMR, standardized root mean squared residual; NFI, normalized fit index; GOF, goodness of fit.
Table 4.Stone-Geisser Values of the Variables
| Variables | Stone-Geisser | Status |
|---|---|---|
| Remembering | 0.495 | Strong predictive fit |
| Application | 0.568 | Strong predictive fit |
| Analysis | 0.47 | Strong predictive fit |
| Understanding | 0.539 | Strong predictive fit |
| Health literacy of diabetic patients | 0.536 | Strong predictive fit |
4.3. Reliability
The results of evaluating the reliability of the questionnaire indicated that according to K-R coefficients and Spearman correlation, the questionnaire had an acceptable reliability (Table 5).
Table 5.The Results of Stability and Internal Consistency
| Row | Subscales | Kuder-Richardson's Coefficients | Re-test Coefficient |
|---|---|---|---|
| 1 | Remembering | 0.71 | 0.81 |
| 2 | Application | 0.73 | 0.82 |
| 3 | Analysis | 0.87 | 0.80 |
| 4 | Understanding | 0.89 | 0.85 |
5. Discussion
In this study, we translated the Chinese Health Literacy Scale for Diabetes (CHLSD) and evaluated the psychometric parameters of the Iranian version. The study results confirmed the psychometric properties of the CHLSD Questionnaire in a sample of the Iranian population, indicating that this questionnaire is a valid and reliable instrument for measuring the health literacy of patients with T2D in Iran.
Health literacy is of the most effective components in performing self-care activities among patients with T2D (38). The role of this construct in adopting behaviors like healthy eating, physical activity, and adherence therapy has been proven (39), and its measurement is necessary to predict the success of self-care training programs. This can be done using a valid and reliable proprietary instrument presented to scholars as the key result obtained from this study. Importantly, although health literacy has been accepted as an important motivational factor in the control of diabetes and self-care, in many cases it has been considered as an indirect effective factor through intermediaries like self-efficacy (40, 41). The results of a study revealed no statistically significant relationship between health literacy and patient self-care (42). Thus, a criticism noted in many previous studies is using general health literacy evaluation instruments for diabetics, whereas health literacy evaluation instruments must be specifically designed for each of the self-care behaviors.
To select the present questionnaire for translation and psychometric analysis, other similar instruments were found by extensive search, but they were omitted for different reasons, including not covering the target group of the present study (adults with T2D over 25 years) and evaluating other types of diabetes (eg, type 1 diabetes or gestational diabetes). There was also an instrument that measured only the mathematical aspect and did not consider all the necessary aspects, and there were instruments available in languages other than English (12, 43-45). Ultimately, CHLSD instrument was selected for the present study.
The validity and reliability of the present instrument were confirmed using psychometric properties (26, 27, 33-35). All the 34 items of the questionnaire were kept by performing quantitative and qualitative face validity and quantitative and qualitative content validity. Cronbach’s alpha, K-R coefficients, and the combined reliability coefficients were calculated to evaluate the internal consistency of the whole instrument and its subscales; as the results were greater than 0.7 and close to 1, the reliability of the questionnaire was confirmed. Furthermore, a re-test exam was used to determine the stability of the instrument with an interval of two weeks on 50 patients, whose Spearman correlation coefficient confirmed the appropriate stability of the translated instrument. The convergent validity index and the desired values of GOF indices of the model confirmed the construct validity of this questionnaire, stating that the classification of questions and determination of aspects were done properly.
Finally, the Persian version of “Type 2 Diabetes Health Literacy Evaluation Instrument” was finalized with 34 items in the present study, and content validity, face validity, constructs validity, internal consistency, and stability were confirmed by analyzing the obtained data.
5.1. Limitations
This study had some limitations. First, the sample used in this study was limited to a geographical area in Iran that spoke the main local language, “Azeri”. Second, because of the convenient method of sampling, it is impossible to generalize the results to the entire population of Iran. Third, this instrument was first translated, and its psychometric parameters were measured outside China (the country where it was developed). Hence, the study results were incomparable with samples psychometrically tested in other countries and in languages except Chinese.
Considering the limitations of the study and as the instrument is the first one examined in the Iranian sample, it is recommended to be repeated on other samples from various regions of Iran with more cultural and ethnic diversity so that by repeating it more and stronger approval is attained. Additionally, it is suggested that other psychometric properties be examined in future studies.
5.2. Conclusions
Overall, the study demonstrated that the CHLSD is a valid and reliable instrument for measuring the health literacy of patients with T2D in Iran. Considering the literature, emphasizing the study of patient health literacy using appropriate instruments, the questionnaire can be used in studies related to this field if the psychometric properties of the Persian version are confirmed in other regions and studies.


