


1. Background
Hypocalcemia of critical illnesses has been introduced since decades ago (1, 2). Association of this disorder with severe infectious disease, especially septicemia, is stronger than in other critical situations (3, 4).
Since the epidemic of coronavirus disease 2019 (COVID-19), many studies have reported high prevalence of hypocalcemia in this disease (5-7). The reported prevalence of hypocalcemia in the hospitalized COVID-19 patients varies from about 60% to 80% in different studies (8-10). Higher degrees of inflammation have been reported in more severe hypocalcemic patients (9). Moreover, in a meta-analysis, Martha et al. showed the association between poor prognosis and mortality of COVID-19 with hypocalcemia (11).
Several mechanisms have been mentioned as the involving factors in the hypocalcemia of critical illnesses. Hypoalbuminemia (12), functional hypoparathyroidism due to suppressive effects of inflammatory markers or hypomagnesemia (13), resistance to parathyroid hormone (PTH) (14), decreased vitamin D level due to redistribution and renal wasting (15), and calcium precipitation by high levels of free fatty acids (16) have been mentioned as the main causes of hypoclacemia in these situations.
Hypocalcemia of COVID-19 may be somehow different from that of other critical illnesses. Based on limited studies, the prevalence of hypocalcemia in COVID-19 is possibly higher than other critical illnesses (7) and is even reported in about two-thirds of non-severe cases (17).
Despite the high prevalence, impact on mortality, and possible differences with usual hypocalcemia of critical illness, few studies have been designed to investigate the natural course of this disorder and changes of the related biochemical and hormonal parameters in the cases of new occurrence of hypocalcemia during the hospitalization.
2. Objectives
This longitudinal prospective study was conducted on the hospitalized patients with COVID-19 to examine the following issues: (1) calcium changes during the first week of hospitalization; (2) role of decreasing serum vitamin D level (mainly as the result of renal wasting of vitamin D) in the occurrence of new hypocalcemia; and (3) role of PTH changes and functional hypoparathyroidism in the occurrence of hypocalcemia during hospitalization.
3. Methods
3.1. Study Design and Characteristics of Participants
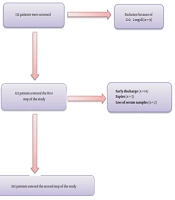
This prospective longitudinal study was conducted on hospitalized patients with COVID-19 at Booali-Sina University Hospital of Qazvin, Iran, from March to April 2021 during a 3-week time frame. All the information was collected through censuses. Hospitalized patients aged ≥ 18 years old with confirmed COVID-19 by polymerase chain reaction (PCR) were included in the study. Patients with known metabolic bone or parathyroid disease, advanced liver disease, serum creatinine ≥ 2mg/dL, and using anticonvulsants were excluded from the study. After excluding nine patients with serum creatinine ≥ 2 mg/dL, 123 patients entered the study (Figure 1). Demographic characteristics, symptoms, and underlying diseases were recorded in the questionnaire.

Flowchart of the study participants
3.2. Measures
Serum calcium and albumin levels were assessed on the first day and fourth to sixth days of hospitalization, and the serum samples were stored at -80°C. Physicians who managed patients were not aware of the calcium and albumin results.
Serum albumin, calcium, albumin, phosphate, and magnesium levels were assessed using colorimetric method. The normal range of calcium was 8.5 - 10.5 mg/dL with the inter-assay and intra-assay of 0.95% and 1.05%, respectively. The normal ranges of albumin, magnesium, and phosphate were 35 - 50 g/L, 1.8 - 2.6 mg/dL, and 2.5 - 4.5 mg/dL, respectively. The intra-assay and inter-assay of albumin assay were 1.25% and 1.34%, respectively. The 25(OH)D and PTH level assays were performed by electrochemiluminescence (ECL) method with the normal range of 30 - 70 ng/mL and 15 - 65 pg/mL, respectively. The intra-assay and inter-assay were 1.2% and 2% for PTH, and 3% and 3.7% for 25 (OH)D, respectively.
Vitamin D deficiency and insufficiency were defined as 25(OH)D < 20 ng/ml and 20 ng/mL ≤ 25(OH)D < 30 ng/mL, respectively (18).
The corrected calcium was calculated using the following formula: Corrected calcium(mg/dL) = serum calcium(mg/dL) + 0.8 * [4 - serum albumin(g/dL)] (19).
3.3. Statistical Analysis
The participants were divided into three groups of normal calcium (serum calcium ≥ 8.5 mg/dL), mild hypocalcemia (8 mg/dL ≤ serum ca < 8.5mg/dL), and moderate/severe hypocalcemia (serum ca < 8mg/dL).
The data were analyzed using SPSS-24. Comparisons of quantitative data between time one and time two were performed by paired t-test. The logarithmic transformation was used for non-parametric data. The comparison of calcium groups between time one and time two was performed using McNemar’s test. The multivariate logistic regression test was run for the predictors of new or worsening hypocalcemia in separate models for total and corrected calcium as the dependent variable. The biochemical and hormonal parameters with significant changes between times one and two, hypovitaminosis D, CRP, and oxygen saturation levels (as indicators of disease severity) were entered as the independent variables. A P-value < 0.05 was considered as significant.
4. Results
In the first step, out of 132 patients, nine subjects were excluded due to serum creatinine level ≥ 2 mg/dL, and 123 eligible patients were included in the study. Of these patients, 21 subjects were excluded due to early discharge (14 patients), early expire (five patients), and loss of serum samples (two patients). The results of 102 patients were analyzed and presented in Figure 1.
The means of age, serum levels of total calcium, corrected calcium, PTH, 25(OH)D, Mg, phosphate, CRP, and oxygen saturation of patients in drop-out group were not significantly different compared to the patients who completed the study. The mean serum creatinine of patients in drop-out group was significantly higher than the other group (1.23 ± 0.51 mg/dL vs. 0.86 ± 0.22 mg/dL, respectively; P < 0.05).
Table 1 represents baseline characteristics, oxygen saturation on days 4 to 6 of hospitalization, and receiving oral or parenteral calcium during hospitalization. The mean age was 62.7 ± 15.9 years old. On the first day of hospitalization, calcium levels of 35 (34.3%) patients were normal, 45 (44.1%) patients had mild hypocalcemia, and 22 (21.6%) patients had moderate/severe hypocalcemia.
| Variables | Values |
|---|---|
| Age (y) | 62.7 ± 15.9 |
| Gender (male %) | 56 (54.9) |
| Complains | |
| Constitutional | 66 (64.7) |
| Respiratory | 91 (89.2) |
| Gastrointestinal | 22 (21.5) |
| Musculoskeletal | 55 (53.9) |
| Comorbidity | |
| HTN | 24 (23.5) |
| IHD | 15 (14.7) |
| DM | 27 (26.4) |
| CKD c | 1 (0.09) |
| COPD | 7 (6.8) |
| Using supplements before hospitalization | |
| Vitamin D3 | 42 (41.2) |
| Calcium | 2 (0.019) |
| Received oral calcium during hospitalization | 19 (18.6) |
| Received parenteral calcium during hospitalization | 3 (2.9) |
| RR | |
| RR ≤ 20 | 70 (68.7) |
| 20 < RR ≤ 30 | 31(30.4) |
| RR > 30 | 1 (0.9) |
| O2 saturation at admission | |
| O2 sat > 93% | 44 (43.1) |
| 90% ≤ O2 sat ≤ 93% | 26 (25.5) |
| O2 sat < 90% | 17 (16.7) |
| O2 saturation on days 4 to 6 of hospitalization | |
| O2 sat > 93% | 54 (52.9) |
| 90% ≤ O2 sat ≤ 93% | 28 (27.5) |
| O2 sat < 90% | 11 (10.8) |
| Inflammatory markers | |
| CRP (mg/dL) | 73.9 ± 72.2 |
| WBC (/mm3) | 8270.3 ± 37.07 |
| Lymphocyte (%) | 16.7 ± 13.2 |
| Calcium groups on first day | |
| Normal calcium | 35 (34.3) |
| Mild hypocalcemia | 45 (44.1) |
| Moderate to severe hypocalcemia | 22 (21.6) |
Of the participants, 19 (18.6%) patients and three (2.9%) patients received oral and parenteral calcium, respectively.
The serum calcium levels of three participants who received intravenous calcium were 6.8 mg/dL, 7.1 mg/dL, and 7.5 mg/dL, and their oxygen saturation was below 90%. The main reason for receiving intravenous (IV) calcium was resistant systolic hypotension. The clinical characteristics and serum calcium levels of participants who received or not received oral calcium during hospitalization were not significantly different. No patient received vitamin D3 supplements other than in combination with calcium in physiologic dosage.
Table 2 represents the changes of serum calcium and other biochemical parameters after four to six days. The mean serum total and corrected calcium levels significantly decreased at time two compared to time one (from 8.32 ± 0.52 mg/dL to 8.02 ± 0.55 mg/dL, P < 0.001; and from 8.38 ± 0.43 mg/dL to 8.27 ± 0.49 mg/dL, P = 0.043, respectively). The mean albumin and PTH levels also decreased (39.29 ± 4.00 g/L vs. 36.83 ± 3.58 g/L and 42.17 ± 27.20 pg/mL vs. 31.28 ± 23.42 pg/mL, respectively; P < 0.001 for both). The mean serum magnesium increased at time two compared to time one (2.17 ± 0.34 mg/dL vs. 2.09 ± 0.28 mg/dL, respectively, P = 0.012). However, the mean serum levels of vitamin D and phosphate were not different at these two times.
| Variables | Time 1 | Time 2 | P |
|---|---|---|---|
| Calcium (mg/dL) | 8.32 ± 0.52 | 8.02 ± 0.55 | < 0.001 |
| Albumin (g/L) | 39.29 ± 4.00 | 36.83 ± 3.58 | < 0.001 |
| PTH (pg/L) | 42.17 ± 27.20 | 31.28 ± 23.42 | < 0.001 |
| Vitamin D (ng/mL) | 31.85 ± 18.38 | 32.19 ± 18.11 | 0.723 |
| Magnesium (mg/dL) | 2.09 ± 0.28 | 2.17 ± 0.34 | 0.012 |
| Phosphate (mg/dL) | 3.40 ± 0.73 | 3.54 ± 1.13 | 0.763 |
| Corrected calcium | 8.38 ± 0.43 | 8.27 ± 0.49 | 0.043 |
The serum calcium levels at time two are shown in Figure 2. Of 35 patients with normal calcium level at time one, 11 (31.4%) patients and nine (25.7%) patients had moderate/severe and mild hypocalcemia at time two, respectively (Figure 2A). Also, out of 45 patients, 24 (53.3%) cases in mild hypocalcemia group at time one had moderate/severe hypocalcemia at time two (Figure 2B). Of 22 patients with moderate/severe hypocalcemia at time one, 68.2% remained moderate/severe hypocalcemic, and the calcium level of only 18.2% of the patients became normal at time two (Figure 2C).
, mild hypocalcemia on day 1 (Panel B), and moderate/severe hypocalcemia on day 1 (Panel C). The bars represent the frequencies of normal (white bars), mild hypocalcemia (gray bars), and moderate/severe hypocalcemia (black bars) on days 4 to 6 of hospitalization (P < 0.001) by McNemar’s test.")
Redistribution of calcium groups on days 4 to 6 of hospitalization in patients with normal calcium on day 1 (Panel A), mild hypocalcemia on day 1 (Panel B), and moderate/severe hypocalcemia on day 1 (Panel C). The bars represent the frequencies of normal (white bars), mild hypocalcemia (gray bars), and moderate/severe hypocalcemia (black bars) on days 4 to 6 of hospitalization (P < 0.001) by McNemar’s test.
Table 3 represents the predictors of decreasing total and corrected calcium level from normal to hypocalcemia or from mild hypocalcemia to moderate/severe hypocalcemia. Among significantly different biochemical and hormonal changes in Table 2, the decreasing levels of albumin and PTH were significant independent factors in the occurrence of new or worsening hypocalcemia (total calcium) at time two (OR = 1.27; 95% CI: 1.10 - 1.46; P < 0.001 for each 1 g/L decrease of albumin, and OR = 1.29; 95% CI: 1.03 - 1.62; P = 0.026 for each 10 pg/mL decrement in PTH). Decreased PTH level was also a significant independent predictor for the occurrence of new or worsening of low corrected calcium (OR = 1.23, 95% CI: 1.01 - 1.52; P = 0.049 for each 10 pg/mL decrement in PTH).
| Variables | Total Calcium | Corrected Calcium | ||
|---|---|---|---|---|
| OR (95%CI) | P | OR (95%CI) | P | |
| Albumin decrease (g/L) | 1.27 (1.10 - 1.46) | 0.001 | - | - |
| PTH decrease b | 1.29 (1.03 - 1.62) | 0.026 | 1.23 (1.01 - 1.52) | 0.049 |
| Mg increase (mg/dL) | 0.44 (0.07 - 2.59) | 0.362 | 0.49 (0.10 - 2.38) | 0.382 |
| Vitamin D category | ||||
| Normal vitamin D | Reference | Reference | ||
| Vitamin D insufficiency | 1.95 (0.56 - 6.78) | 0.291 | 0.85 (0.26 - 2.75) | 0.791 |
| Vitamin D deficiency | 0.62 (0.17 - 2.29) | 0.478 | 1.08 (0.34 - 3.45) | 0.892 |
| CRP | 1.00 (0.99 - 1.01) | 0.896 | 0.99 (0.99 - 1.00) | 0.587 |
| O2 saturation | 1.07 (0.92 - 1.24) | 0.368 | 1.00 (0.88 - 1.14) | 0.998 |
Changes in Biochemical Parameters and Vitamin D Status as Predictors of New Hypocalcemia or Increasing Severity of Hypocalcemia Categorized by Total and Corrected Calcium a
Vitamin D deficiency had no significant predictive role in the occurrence or worsening of hypocalcemia.
5. Discussion
In the present study, calcium levels decreased on the fourth to sixth days compared to the first day of hospitalization. More than half of the patients with normal serum calcium levels became hypocalcemia on these days. In addition to decreased albumin level, decreased PTH level had a significant role in the occurrence or worsening of hypocalcemia. For each 10 pg/mL decrease in PTH level, the risk of new low total or corrected calcium rose by about 25%. We found no evidence of increased vitamin D catabolism as the involving factor of occurrence of new hypocalcemia.
There are limited studies about the course of hypocalcemia during critical illness in general and COVID19 in particular. In a study by Steele et al. conducted on hospitalized patients in the intensive care unit (ICU), the patients were divided into two groups of adjusted serum calcium < 2.2 nmol/L and ≥ 2.2 nmol/L (20). The first group received parenteral calcium, and serum ionized calcium levels were normalized within four days in most of both receivers and non-receivers. Serum ionized calcium was low (< 1.1 mmol/L) at admission in 83 patients despite normal adjusted serum calcium. These patients did not receive parenteral calcium based on the study protocol; however, ionized calcium level rose to normal in maximum within four days, similar to parenteral calcium receivers.
The differences between the hypocalcemia course in our study and the study by Steele et al. (20) can be related to the indications of ICU admission. In this work, both septic and non-septic subjects admitted to the ICU were included. Regarding the strong association between inflammation level and the occurrence of hypocalcemia (21), one hypothetical reason for normalization of calcium levels on the fourth day can be the presence of non-septic patients in the study. However, in the study by Steele et al. (20), subgroup analysis compared septic and non-septic patients and showed similar normalization patterns of serum calcium on the fourth day.
Another reason for this difference can be attributable to the possible direct effect of COVID-19 virus in the occurrence of hypocalcemia. Calcium is an essential element for the entrance of viruses into the host cells, virus gene expression, producing viral proteins, and release of new viruses from the host cells (22, 23). Therefore, coronaviruses induce calcium ions influx across the host’s cell membranes to meet their needs (24). The high prevalence of hypocalcemia in other coronavirus diseases such as severe acute respiratory syndrome (SARS) and Ebola, as well as high prevalence of hypocalcemia in even non-severe disease of COVID-19, is the evidence for this hypothesis (25, 26). There is limited evidence about the involved pathophysiological mechanisms. Functional hypoparathyroidism has been reported as one of the causes of hypocalcemia of critical illness (13). In animal studies, the up-regulation of calcium sensor receptors (CaSR) in the high inflammation states, such as burn or exposure of parathyroid cells to interleukin-1β and interleukin-6 has been demonstrated (21, 27-29). Up-regulation of CaSR leads to the increased sensitivity of parathyroid cells to serum calcium levels and inhibition of PTH secretion at lower levels of serum calcium (13).
In our study, PTH level decreased by about 25% on the fourth to sixth days compared to the first day of study, and PTH change was the independent predictor of new or worsening total or corrected hypocalcemia.
Serum albumin level usually decreases dramatically during critical illnesses. Decreased synthesis, extravasation, and increased catabolism of albumin are the main causes of hypoalbuminemia during critical illnesses (30). Regarding the protein binding of serum calcium to albumin, hypoalbuminemia decreases serum total calcium. In our study, albumin levels decreased significantly, and decreasing albumin level was an independent factor for the occurrence of new or worsening hypocalcemia.
Decreased vitamin D concentration in critical illness is another theoretical cause of hypocalcemia in these situations (15). Hourly changes of 25(OH)D have been reported in critical illnesses (31). Serum vitamin D binding protein levels decrease during critical illness (32, 33). These proteins are essential for reabsorption of filtrated 25(OH)D from renal tubules (34). Renal wasting of 25(OH)D can lead to low levels of vitamin D. In addition, hemodilution and extravasation of 25(OH)D are other mechanisms of decreased vitamin D during critical illnesses (15, 35). However, we observed no significant decrease in vitamin D levels in our study.
Hypomagnesemia is a known and important etiological factor in the hypocalcemia of critical illnesses (36). However, we found no role of hypomagnesemia in the occurrence of new hypocalcemia.
Our study had some limitations. The main limitation was the lack of assessing ionized calcium in our patients. Low sample size was another limitation. The main novelties of our study were the prospective longitudinal design for evaluating the course of hypocalcemia and PTH changes in COVID-19. Furthermore, the role of 25(OH)D changes during critical illnesses was evaluated in animal studies. To the best of our knowledge, no longitudinal human study has evaluated the role of this parameter in the occurrence of new hypocalcemia in the first week of critical illnesses.
In conclusion, we found downslope course of hypocalcemia on the fourth to sixth days of hospitalization. Suppressing PTH and hypoalbuminemia was the main factors involved in the occurrence of new or worsening of hypocalcemia. We found no evidence of vitamin D changes during these days. Vitamin D deficiency at admission and magnesium changes had no role in this phenomenon.
