


1. Background
Type 2 diabetes is a growing public health problem worldwide, especially in low- and middle-income countries. The International Diabetes Federation estimated that in 2021, 10.5% of the global population aged 20 - 79 (approximately 536.6 million people) suffered from diabetes. The prevalence is estimated to rise to 12.5% in 2045 (1). Globally, 8 deaths occur every minute due to diabetes. In 2019, mortality related to diabetes among adults aged 20 - 79 was estimated to be 4.2 million, almost half of whom were younger than 60 (2). In the same year, global direct health expenditure on diabetes was estimated to be 760 billion USD, and it is projected to grow to 825 USD by 2030 (3). Among different regions of the world, the Middle East and North Africa (MENA) region is the second most affected area in the world after South and Central America. It is estimated that in this region, the number of people with diabetes will increase from 72.7 million in 2021 to 135.7 million in 2045 (1). In MENA, Iran is the third country with the highest number of adults living with diabetes. In 2021, it was estimated that 5.5 million people with diabetes lived in Iran (4). In 2019, more than 20% of deaths and 11.5% of disability-adjusted life years due to noncommunicable diseases were attributed to diabetes in Iran (5).
Around half of the adults living with diabetes are unaware of their condition, and more than 90% of cases with undiagnosed diabetes live in low- and middle-income countries. There is a direct relationship between the duration that a person with diabetes remains undiagnosed and the risk of developing complications (4). Therefore, it is essential to identify the affected population and initiate treatment in the early stages (6). Routine screening of type 2 diabetes is done based on the measurement of free plasma glucose, glycated hemoglobin (HbA1c), and 2-hour oral glucose tolerance test (OGTT) (7). Despite their high accuracy, these methods are costly and invasive and may not be accessible in remote areas. Furthermore, the emergence of the COVID-19 pandemic has led to a wide range of challenges in diabetes screening. For example, Holland et al., in their study in 2021, showed that only in the UK, under the influence of the COVID-19 pandemic, 6.6 million HbA1c tests were missed in 6 months, of which 2.7 million were screening tests (8). In these conditions, using noninvasive risk scores may be an appropriate alternative to identify those with undiagnosed diabetes.
Noninvasive diabetes risk assessment tools consist of short questions on lifestyle and biometric measures that are simple to measure in a wide range of settings and recommended by international health organizations such as the American Diabetes Association, Diabetes UK, and the Department of Health of Australia (9-11). The promising performance of these models in the original population does not guarantee that they will perform well in new populations. This could be explained mainly by differences in the baseline risk of populations. Therefore, to be applicable to new communities, these models should be geographically validated by adjusting the original model’s baseline risk to the new population.
2. Objectives
In the present study, we assessed the discrimination power, calibration, and net benefit of 2 widely used risk prediction models, the Finnish Diabetes Risk Score (FINDRISC) and the Australian Diabetes Risk assessment tool (AUSDRISK), to identify undiagnosed diabetes in a representative sample of people living in Kerman, Iran.
3. Methods
3.1. Study Population
This cross-sectional study analyzed data collected in the second round of the Kerman Coronary Artery Disease Risk Factors Study (KERCADRS). From 2014 to 2018, 9930 individuals aged 15 years and older were recruited for the study by 1-step random cluster sampling. A total of 420 zip codes were randomly selected; each of the zip codes represented a house. Then, 24 eligible people were recruited from houses near every selected house until the total target sample size of 10,000 was reached. The analytic sample consisted of 3265 eligible individuals. Eligibility criteria were being 35 - 65 years old and having no history of confirmed diabetes.
3.2. Clinical and Laboratory Measurements
Participants were interviewed for information on age, sex, physical activity, dietary habits, past medical history, family medical history, and smoking status. Anthropometric measurements were taken with light clothing without shoes. Body mass index (BMI) was obtained by dividing weight in kilograms by height in meters squared (kg/m2). Waist circumference (WC) was taken at the end of a gentle expiration at the midpoint between the iliac crest and the lower border of the tenth rib. Blood pressure was measured twice, at least 30 minutes apart, after participants sat on a chair and rested for 5 minutes. The average of these 2 values was recorded as the blood pressure. Fasting blood glucose was measured using a blood test after 10 - 12 hours of fasting.
3.3. Outcome
The outcome was undiagnosed diabetes, defined as FBS ≥ 126 mg/dL or HbA1c ≥ 6.5% without a history of diabetes. Each individual’s risk of developing the outcome was calculated based on variables used in the FINDRISC and AUSDRISK prediction models and compared with the observed risks.
3.4. Model Description
The FINDRISC model was developed in the Finnish population aged 35 to 64. The variables in this model are age (< 45, 45 - 54.9, and 55 - 64 years), BMI (< 25, 25 - 29.9, and ≥ 30 kg/m2), waist circumference (< 94, 94 - 101.9, and ≥ 102 cm in males and < 80, 80 - 87.9, and ≥ 88 cm in females), physical activity (< 4 and ≥ 4 hours a week), daily consumption of fruits, berries, or vegetables (yes, no), history of antihypertensive drug treatment (yes, no), and history of high blood glucose (yes, no). The AUSDRISK model was developed in the Australian population aged ≥ 25 years. This model uses age (25 - 34.9, 35 - 44.9, 45 - 54.9, 55 - 64.9, and ≥ 65 years), sex (male, female), ethnicity (Southern European, Asian, aboriginal, and Torres Strait Islander or Pacific Islander background), parental history of diabetes (yes, no), history of high blood glucose level (yes, no), use of antihypertensive medications (yes, no), current smoking (yes, no), physical inactivity (less vs more than 2.5 hours physical activity per week), waist circumference (< 90, 90 - 99.9, and ≥ 100 cm in males and < 80, 80 - 89.9, and ≥ 90 cm in females), BMI (< 25: Normal, 25 - 29.9: Overweight, 30 - 34.95: Obese, 35 ≤: Morbidly obese) to predict the incidence of type 2 diabetes.
3.5. Statistical Analysis
To evaluate the calibration of the model, we fitted a logistic regression model with undiagnosed type 2 diabetes as the outcome and the variables used in each model as the predictors to obtain the linear predictor part of each model.
The corresponding model for FINDRISC is as follows:
Logit (p [Y = 1]) FINDRISC = -5.65 + [age < 45 (0), 45 - 54 years (0.65), 55 - 64 years (0.94)] + [BMI < 25 (0), 25 - 30 (0.01), > 30 (0.93)] + [WC < 94 in males and < 80 in females (0), 94 - 102 in males and 80 - 88 in females (1.02), ≥ 102 in males and ≥ 88 in females (1.42)] + [history of antihypertensive drug treatment (0.71)] + [physical inactivity (0.26)] + [daily consumption of fruits or vegetables (0.16)] + [history of high blood glucose (2.26)] = LP(m FINDRISC)
Logit (p [Y = 1]) AUSDRISK = -5.38 + [female (0), male (0.58)] + [age 25 - 34.9 (0), 35 - 44.9 (0.45), 45 - 54.9 (0.91), 55 - 64.9 (1.3), ≥ 65 (1.64) years] + [parental history of diabetes (0.62)] + [use of antihypertensive medications (0.46)] + [current smoking (0.46)] + [physical inactivity (0.42)] + [waist circumference (< 90 in males and < 80 in females (0), 90 - 99.9 in males and 80 - 89.9 in females (0.88), ≥ 100 cm in males and ≥ 90 in females (1.41)],[BMI (< 25 (0), 25 - 29.9 (0.56), 30 - 34.95 (1.24), 35 ≤ (1.69)], [history of high blood glucose (1.35)] + [ethnicity (0.41)] = LP(m AUSDRISK)
To recalibrate the models, we applied the intercept and slope calibration technique to correct the differences in prevalence unrelated to covariate effects and overfitting in the derivation population.
The recalibrated models are presented below:
The calibration of the original and recalibrated models was assessed using the Hosmer-Lemeshow chi-square test, with test statistics higher than 20 indicating poor calibration (12). Furthermore, we plotted the predicted probabilities (x-axis) against the observed probabilities across the deciles of the predicted risks (y-axis) to obtain a calibration plot. A plot along the bisector indicates perfect calibration, as predicted and observed probabilities are equal.
The discrimination power of each model was assessed by plotting the receiver operating characteristic (ROC) curve and estimating the area under the curve (AUC) for each risk prediction model.
The clinical usefulness of the studied models was evaluated by calculating the net benefit across the entire range of risk thresholds and plotting the decision curve. The risk threshold refers to the minimum probability of disease in which further interventions are necessary. We calculated the net benefit for each risk threshold based on the number of true positives (TPs) and false positives (FPs) of each model at a certain threshold, as well as the total number of the study population (N).
Due to the greater importance of TP compared to FP, FP was multiplied by a factor of w, which is equal to the harm-to-benefit ratio or, in other words, the odds of threshold probabilities.
Then, by plotting the decision curve, the net benefit for each threshold was compared with 2 extreme scenarios, the treat-all and treat-none scenarios. The treat-none scenario considers all individuals as healthy. Therefore, there is no TP and no FP in this scenario, resulting in a net benefit of 0 for all risk thresholds. In the treat-all scenario, all individuals are treated as patients with diabetes. Therefore, in this scenario, TP is equal to the total number of patients with diabetes, and FP would be equal to the number of healthy individuals in the studied sample. These 2 scenarios serve as a reference line to judge if the model has any additional benefit. Data were analyzed using SPSS version 22 (SPSS Inc, Chicago, Ill, USA). Decision curve analysis was performed using Stata version 15 (StataCorp LLC, College Station, Texas, USA).
4. Results
Overall, 4.4% (n = 145) of the 3262 eligible participants had undiagnosed diabetes. The prevalence of undiagnosed diabetes among women and men was 4.1% and 5.2%, respectively. The mean ± SD) age of patients was 53.23 ± 7.38 and 49.14 ± 8.68 in those with undiagnosed diabetes and healthy individuals, respectively (P < 0.0001). Most participants were female and educated up to high school in both groups. The average waist circumference, systolic blood pressure, and FINDRISC and AUSDRISK scores among individuals with undiagnosed diabetes were significantly higher than in healthy individuals (Table 1).
| Variables | Without Diabetes (n = 3117) | Undiagnosed Diabetes (n = 145) | P Value |
|---|---|---|---|
| Age | 49.14 ± 8.62 | 53.23 ± 7.30 | < 0.001 |
| Gender | |||
| Female | 2175 (69.8) | 93 (64.1) | 0.34 |
| Male | 942 (30.2) | 52 (35.9) | |
| Level of education | |||
| Illiterate | 209 (4.21) | 15 (6.68) | 0.1 |
| Primary school | 683 (13.77) | 35 (15.33) | |
| Middle School | 592 (11.94) | 33 (14.25) | |
| High school | 1073 (21.63) | 41 (18.12) | |
| University | 560 (3.75) | 21 (3.05) | |
| Body mass index, kg/m2 | 27.69 ± 4.73 | 29.36 ± 4.50 | 0.25 |
| Waist circumference, cm | |||
| Male | 92.28 ± 12.13 | 100.76 ± 12.38 | < 0.0001 |
| Female | 90.59 ± 12.28 | 96.69 ± 11.69 | < 0.0001 |
| Systolic blood pressure, mmHg | 116.28 ± 16.83 | 123.27 ± 17.78 | < 0.0001 |
| Diastolic blood pressure, mmHg | 76.42 ± 11.11 | 79.08 ± 11.78 | 0.12 |
| Current smoking | |||
| Yes | 59 (1.9) | 4 (2.8) | 0.57 |
| No | 3058 (98.1) | 141 (97.2) | |
| FINDRISC score | 8.18 ± 3.39 | 9.64 ± 3.13 | < 0.0001 |
| AUSDRISK score | 16.95 ± 5.73 | 20.42 ± 4.99 | < 0.0001 |
Characteristics of the Participants Recruited for the Validation Study of Finnish Diabetes Risk Score and Australian Diabetes Risk Assessment Models for Diagnosis of Undiagnosed Diabetes in Kerman, Iran (n = 3262) a
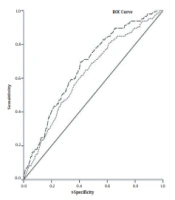
The estimated AUC for AUSDRISK and FINDRISC models was 0.67 and 0.62, respectively (Figure 1). There was a significant difference between the discrimination ability of these 2 models (P < 0.001). Figure 2 shows the calibration plot of the original and recalibrated models. The chi-square statistic for the FINDRISC and AUSDRISC models was 7.90 and 16.47 for the original and 3.69 and 14.61 for the recalibrated model, respectively, indicating good calibration in both original and recalibrated models.
")
The area under the receiver operating characteristic curve of Finnish Diabetes Risk Score and Australian Diabetes Risk Assessment models for diagnosis of undiagnosed diabetes in Kerman, Iran (n = 3262)
 and Australian Diabetes Risk Assessment (down) models for diagnosis of undiagnosed diabetes in Kerman, Iran (n = 3262)")
Calibration plots of original and recalibrated Finnish Diabetes Risk Score (up) and Australian Diabetes Risk Assessment (down) models for diagnosis of undiagnosed diabetes in Kerman, Iran (n = 3262)
Based on the decision curve plots presented in Figure 3, useful threshold ranges for the original models of FINDRIS and AUSDRISK were 4 - 10% and 3 - 13%, respectively. This means that in these thresholds, evaluating patients based on the prediction models leads to higher benefits than the alternative strategies of screening all patients (treat-all scenario) or screening no patients (treat-non scenario). However, the corresponding threshold range is very narrow. Calibration worsened the usefulness of the models; the useful threshold ranges for the recalibrated models of FINDRISC and AUSDRISK were 4 - 8% and 4 - 9%, respectively (Figure 3).
 and Australian Diabetes Risk Assessment (down) prediction models for diagnosis of undiagnosed diabetes in Kerman, Iran (n = 3262)")
Decision curves of original and recalibrated Finnish Diabetes Risk Score (up) and Australian Diabetes Risk Assessment (down) prediction models for diagnosis of undiagnosed diabetes in Kerman, Iran (n = 3262)
5. Discussion
The increasing incidence of diabetes in recent years highlights the need for simple and accessible tools for screening this disease. To the best of our knowledge, this is the first study to evaluate the validity and clinical usefulness of FINDRISC and AUSDRISK risk prediction models to identify those with undiagnosed diabetes in Kerman, Iran. Our study showed that both original models perform reasonably in the study population and could be applied in settings with limited access to laboratory tests to decrease health inequality. It was also revealed that recalibration did not improve these models’ clinical performance.
The discrimination ability of the studied model, as presented by AUC, for FINDRISC and AUSDRISK was 62% and 67%, respectively, indicating better discrimination ability for AUSDRIC compared to FINDRISC. For both models, the estimated AUC was lower than the AUC obtained in their original studies (0.77 for AUSDRISK and 0.86 for FINDRISC). In other external validation studies, AUC ranges from 76% to 89% (13-15) for AUSDRISK and from 43% to 82% (16-29) for FINDRISC. A variety of factors can explain the observed difference between the findings of various studies: Area under the curve illustrates the discrimination ability of clinical models by plotting and sensitivity (FP rate) against 1-specificity (false-negative rate). The sensitivity and specificity of each diagnostic model and its AUC are affected by the sensitivity and specificity of the variables that constitute it. Differences in the accuracy of measured variables, especially variables such as physical activity and nutritional status, whose measurement is based on individuals’ self-reporting and subsequent misclassification of such variables, may result in a difference in the reported sensitivity of the same model in different populations. Furthermore, spectrum bias (which refers to the variability of test performance in different settings due to differences in the population mix) may be another explanation (30). In the present study, we used general population-based data to avoid this bias. However, in some validation studies, such as the study performed by Silvestre et al among overweight individuals in Bulgaria (28) or in the study performed by Omech et al., which selected a sample from referrals to outpatient clinics in Botswana, the study population is limited to specific groups and may affect the discrimination power of these models (27).
We showed that both models had good calibration in their original forms, and recalibration did not improve their calibration. The good calibration of the original models may be due to the similar prevalence of undiagnosed diabetes in our analytic sample and those of the original FINDRISC and AUSDRISK studies. In our studied sample, the prevalence of undiagnosed diabetes was 4.4%, which is very close to the corresponding prevalence in FINDRISC (4%) (31) and AUSDRISK’s (6%) (10) original studies. However, in studies with different background prevalence rates, the calibration of these models improved after recalibration. For example, in the study of Lotfaliany et al. in Tehran, Iran, with a 17.7% estimated prevalence of undiagnosed diabetes, the original FINDRISC model underestimated the risk of undiagnosed diabetes while the original AUSDRISK model had reasonable calibration (32). After recalibration of the FINDRISC model, its calibration improved. In 2 separate studies conducted by Janghorbani et al. in Isfahan, Iran, and Salinero-Fort et al. in Spain, the calibration of the FINDRISC original model was reported to be good (16, 17). However, calibration did not improve the AUSDRISK model too much. This could be due to the fact that in the external validation, coefficients from the original population are being used. Sometimes these coefficients could not fit the validation population and consequently lead to a slight improvement in model performance.
Based on the decision curve analysis, we showed that the useful risk threshold for identifying those with diabetes in both original models was narrow, ranging from 4% to 10% for FINDRISC and from 3% to 13% for AUSDRISK. In this range, the maximum net benefit for FINDRISC and AUSDRISK is 0.02 and 0.03, respectively, which is equivalent to having 2 and 3 additional patients correctly identified as diabetic per 100 patients without incorrectly identifying anyone who does not have diabetes using these 2 models, respectively. Furthermore, as stated in the methods section, the odds of threshold probabilities are equal to the harm-benefit ratio, which is the maximum number of FPs that a medical doctor accepts per TP. This means, for example, that for the 4% threshold, the odds (harm-to-benefit ratio) are 1: 25; hence, at this threshold, at most, 25 FPs are accepted per 1 TP. Recalibration of the models made these ranges narrower. Most validation studies have not evaluated the clinical usefulness of these models. In the study by Lotfaliany et al. in 2019, the useful risk threshold ranged between 17% and 42% for FINDRISC and between 9% and 71% for AUSDRISK. In their study, recalibration widened the useful risk threshold to %10 - %63 for FINDRISC and 8% - 64% for AUSDRISK (32). Compared to the findings of Lotfaliany et al., these 2 models are only useful in a narrower range of the probability threshold (32). Furthermore, in lower risk thresholds, more net benefits will be reached compared to higher ones. Previous studies have also shown that the acceptable harm/benefit ratio will differ between institutes and populations (33).
Overall, considering the 2 models’ discrimination, calibration, and clinical usefulness, our findings indicate that AUSDRISK performs better in identifying undiagnosed diabetes and could be applied to the Iranian population. The better performance of AUSDRISK in the Iranian population has been confirmed in the previous study by Lotfaliany et al. in Tehran, Iran (32). This could be attributable to a higher number of predictors in the AUSDRISK model. Furthermore, the AUSDRISK model uses ethnicity as a predictor, and the prevalence of diabetes has been reported to be higher among Asians, Hispanics, and blacks compared to whites (32).
In the present study, we used a representative sample of Kerman’s adult population aged 35 - 65 to evaluate the performance of 2 widely used models for diagnosing patients with undiagnosed diabetes. We tried to validate a risk prediction model that can address the need for a valid and noninvasive tool to identify undiagnosed diabetes, especially in situations where the COVID-19 pandemic has adversely affected the screening process in the studied population. However, the study findings should be interpreted with caution due to some limitations. First, in the case of some variables, including the consumption of vegetables and physical activity, the variable was measured and defined slightly differently from the original studies. Furthermore, due to the unavailability of OGTT in the present study, the diagnosis of diabetes was based on fasting blood glucose and HbA1c, which would be prone to misclassification of the outcome. Finally, in the present study, we just aimed to externally validate AUSDRISK and FINDRISC models for screening undiagnosed diabetes in the Iranian population. We did not recommend any clear-cut point for risk probabilities. Actually, recommending a clear-cut point needs further information about the feasibility of treatment options and contextual factors. Collecting these pieces of information was not our goal. However, for future studies, it is recommended that national policymakers develop a clear cut-off considering these pieces of information and possible variations that exist among different populations.
5.1. Conclusions
The original AUSDRISK model performed reasonably in identifying patients with undiagnosed diabetes in Kerman, Iran. This model could be used as a simple, fast, and noninvasive tool in various situations, especially where access to laboratory facilities is costly or limited. Further research to study the performance of this model and possibly other available models in a wider population is needed and should be addressed in future studies.
