


1. Background
Metabolic syndrome (MetSyn) has mainly corresponded with a higher risk of developing diabetes and other atherosclerotic-related disorders as it incorporates several metabolic abnormalities related to cardiovascular diseases (CVDs) development, comprising hyperglycemia, hypertriglyceridemia, elevated blood pressure, central obesity, and reduced high-density lipoprotein cholesterol (HDL-C) levels (1-4). Although it is not fully delineated, multifactorial causes, such as having a sedentary lifestyle, being overweight or obese, disturbed neurohormonal function, and declined sensitivity to insulin, are considered the well-known involved factors in MetSyn spectrum pathogenesis (5-10).
From another point of view, a long-lasting pro-inflammatory status and intrinsic immune mechanisms have been outlined as predominating constituents that contributed to MetSyn development and atherosclerosis emergence and progression (5, 7-10). Mainly, the crucial role of inflammation in atherosclerosis is particularly reflected by the overexpression of nuclear factor kappa B, C-reactive protein (CRP), interleukin-6 (IL-6), IL-18, tumor necrosis factor-alpha (TNF-α), and other inflammatory mediators (11, 12). Likewise, both elevated levels of pro-inflammatory parameters and lipid aggregation within the vessel wall could provoke foam cell cholesterol efflux and therefore give rise to foam cell formation and plaque instability (11, 12).
The CRP is a nonspecific positive acute-phase protein that immediately rises after initiating an inflammatory state (1). It could be an indicator of endothelial dysfunction that is also linked to a higher risk of CVDs (13). Moreover, TNF-α is a cytokine that seems to modulate the whole-body lipid, carbohydrate metabolism, and the advancement of insulin resistance (13, 14). The epidemiological evidence highlighted that diabetes is linked to the augmented concentrations of several inflammatory markers, namely CRP, IL-6, and TNF-α (5, 7-9, 15, 16). Several studies have also scrutinized the relationship between MetSyn, as a major causative factor for CVDs, and inflammatory mediators (1, 17-20). Additionally, given their metabolic activities, adipocytes could contribute to the production of various adipokines and pro-inflammatory mediators. These effects of adipocytes might be involved in the pathogenesis of diabetes and atherosclerotic-related disorders in connection with higher body fat mass and obesity (1, 13, 17-20). Therefore, the association between pro-inflammatory mediators (including CRP, TNFα, and IL-6) and metabolic indices with the risk of MetSyn might vary according to the status of overweight/obesity (13). The aforementioned inflammatory biomarkers appeared to be relatively inexpensive and available laboratory measures that could be used in clinical settings. However, due to conflicting findings in this area, the necessity of a broader understanding, particularly regarding the role of inflammatory markers in the pathogenesis of MetSyn and their diagnostic value, is yet to be well-defined (15).
On the other hand, with respect to the close link between MetSyn and atherosclerosis with CVDs, considerable attention has been devoted to the identification of their shared underlying pathological mechanisms in recent decades. In this regard, the detection and management of atherosclerosis progression markers, including impaired lipid parameters and increased pro-inflammatory responses, at early stages, mainly using available cost-effective measures, could be considered among the most practical preventive strategies for atherosclerosis. Based on these aspects, the present study attempted to explore the potential association between two prominent inflammatory biomarkers, TNF-α and CRP, as the early markers of atherosclerosis with MetSyn risk by evaluating their levels in MetSyn patients as opposed to healthy obese and nonobese controls. Notably, in the current case-control study, the atherogenic coefficient (AC), as a serum atherogenicity index that incorporates the atherogenic and anti-atherogenic lipoproteins simultaneously, was also investigated in relation to MetSyn risk. In addition, to test whether the association between MetSyn and pro-inflammatory state is moderated by metabolic abnormalities, including elevated total and low-density lipoprotein cholesterol (LDL-C), triglyceride, blood sugar, and AC and reduced HDL-C, the correlations between these factors and inflammatory markers were evaluated.
2. Objectives
This study aimed to investigate the association between pro-inflammatory factors and newly-diagnosed MetSyn.
3. Methods
3.1. Study Population
This case-control study enrolled 84 obese and nonobese newly diagnosed MetSyn patients as the case group referred to the Outpatient Clinic of Dr. Heshmat university hospital in Rasht, Guilan, Iran, and 83 obese and nonobese healthy individuals as controls within April to July 2022. An expert physician examined all the studied patients, and the diagnosis of MetSyn for the first time was made in agreement with the National Cholesterol Education Program Adult Treatment Panel III, harmonized criteria definition, International Diabetes Federation (2), and the cut-off points proposed for waist circumference (WC) among the Iranian adult populations (21, 22). The control group comprised healthy gender-matched obese and nonobese volunteers with no clinical or laboratory signs of any metabolic disturbances. All the studied subjects were within the age range of 20 - 65 years with a body mass index (BMI) of 18.5 - 35 kg/m2.
The individuals were excluded from the study if they had a record of any cardiovascular events (e.g., myocardial infarction, stroke or angina pectoris, coronary artery disease, cardiomyopathy, and heart failure), a medical history of inflammatory, infectious, or immune disorders, severe renal, liver, or gastrointestinal dysfunction, neurological, psychological, or endocrine diseases, diabetes mellitus (explained as fasting blood sugar [FBS] ≥ 126 mg/dL or taking an anti-hyperglycemic drug or insulin use), pregnancy, lactation, or a history of MetSyn.
The patients were diagnosed to have MetSyn if they showed 3 out of 5 of the following criteria:
(1) Triglyceride levels > 150 mg/dL or taking antihyperlipidemic medications.
(2) HDL-C levels < 40 mg/dL (for men) and < 50 mg/dL (for women) or receiving antihyperlipidemic medications.
(3) Systolic to diastolic blood pressure levels of 130/85 mmHg or receiving antihypertensive medications.
(4) Abnormal glucose levels (FBS levels of more than 100 mg/dL or receiving anti-diabetic medications.
(5) Abdominal obesity as outlined by WC > 95 cm for males and females.
Since the case group included MetSyn patients who were newly diagnosed, almost all of them showed mild dyslipidemia as a typical manifestation of the disorder at early stages (i.e., HDL-C < 50 mg/dL in case of women and < 40 mg/dL in case of men and hypertriglyceridemia or serum triglyceride > 150 mg/dL) without substantial complications.
This study procedure was executed based on the guidelines outlined in the 2013 version of the Declaration of Helsinki. The research protocol was evaluated and confirmed by the Institutional Review Board of Cardiovascular Diseases Research Center and the Ethics Committee of Guilan University of Medical Sciences (research no.: 1401021902 (4193); ethics code: IR.GUMS.REC.1401.156). At study entry, all the study participants gave written informed consent.
3.2. Data Collection and Laboratory Analysis
The demographic characteristics of the included subjects (e.g., gender and age), anthropometric indices (e.g., height and weight), and clinical data (including medical history of the studied individuals) were collected on enrollment. At the study baseline, about 5 mL fasting venous blood sample was collected from the enrolled participants following a minimum of 8 hours fasting. The samples were then segregated within 10 minutes and frozen at -20°C until the tests were carried out. Total cholesterol and FBS levels were measured by the enzymatic method applying cholesterol oxidase, cholesterol esterase, and glucose oxidase, respectively, exploiting commercial kits manufactured by MAN Co. (Tehran, Iran) and Auto Analyzer (Hitachi Ltd., Japan). The same method was performed to evaluate triglyceride levels, except that glycerol phosphate oxidase and the Bionic corporation commercial kit were used. Then, the HDL-C level was estimated based on the enzymatic method (MAN Co., Tehran, Iran). Subsequently, LDL-C was calculated based on the Friedewald formula. Afterward, serum AC was estimated based on the following formula (23):
Moreover, the serum analysis of TNF-α concentration was performed by applying a commercial enzyme-linked immunosorbent assay kit based on the instruction of the manufacturer (East-Biopharm; Hangzhou Eastbiopharm Co., Ltd., Hangzhou, China). The CRP serum levels were measured using the immunoturbidimetric method based on the manufacturer’s manual (Novin Bio Kit, Tehran, Iran). Systolic and diastolic blood pressure levels were measured according to standardized approaches using a mercury sphygmomanometer.
3.3. Sample Size and Statistical Analysis
The sample size of the present study was calculated using a study by Ullah et al. (24) and the below formula. Assuming the same number of samples in both groups and with a significance level of α = 0.05 and a power of 1-β = 0.99, the minimum sample size of each study arm was estimated at 74 subjects. With the consideration of about a 15% drop rate, the final sample size was determined at 85 participants in each group.
The normal distribution of the data was tested by the Shapiro-Wilk test. The intergroup differences of the variables were then determined based on the independent sample t-test (in case of continuous variables, presented as mean and standard deviation) or chi-square test/Fisher’s exact test (in case of categorical variables, presented as numbers [percentages]). Furthermore, the univariate and multiple regression models (i.e., crude and adjusted logistic regression models) were run to explore the relationship between serum inflammatory indices and AC with MetSyn risk. Accordingly, odds ratios (ORs) and 95% confidence intervals (95% CIs) were reported. In the second and third multivariable logistic regression models, in order to analyze the association between serum concentrations of TNF-α and CRP and MetSyn risk, several variables, including gender, age, BMI, and total cholesterol and LDL-C levels, were considered. When analyzing AC values in relation to MetSyn risk, the multiple regression models were adjusted for gender, age, BMI, FBS, TNF-α, and CRP levels.
Moreover, the Pearson correlation test was performed to investigate the correlations between metabolic indices (including FBS, total cholesterol, LDL-C, HDL-C, and AC) and levels of inflammatory factors (including TNF-α and CRP). Then, the correlation coefficients and obtained P-values were reported. A P-value < 0.05 was set as the statistical significance level in all performed analyses. All the analyses were carried out using IBM SPSS software (version 24.0; SPSS, Chicago, IL, USA).
4. Results
4.1. Baseline Characteristics
The baseline characteristics of the study participants, including age, gender, BMI, TNF-α, CRP, glycemic profile, and lipid profile, are summarized in Table 1. Subgroup analysis comparing the cases and controls according to their BMI levels indicated that about 54% (n = 26) of the average-weight subjects (total n = 48) and approximately 49% (n = 58) of overweight and obese individuals (total n = 119) were diagnosed with MetSyn. The case group consisted of 84 patients with MetSyn (57% women, with a mean age value of 45.88 ± 10.61 years), of whom 58 patients were obese. The control group consisted of 83 healthy individuals (78.3% women with a mean age value of 43.19 ± 10.41 years), of whom 61 patients had BMI > 25 kg/m2. There were no significant differences in the mean age values between the MetSyn and control subjects in either of the BMI categories. It was also shown that serum metabolic and inflammatory parameters, including triglyceride, FBS, AC, TNF-α, and CRP, were shown to be higher in both average-weight or overweight and obese patients diagnosed with MetSyn than in controls (P < 0.001).
| Variables | BMI Categories (kg/m2) | |||||
|---|---|---|---|---|---|---|
| < 25 (n = 48) | P-Value | > 25 (n = 119) | P-Value | |||
| Control (n = 22) | Metabolic Syndrome (n = 26) | Control (n = 61) | Metabolic Syndrome (n = 58) | |||
| Gender (No. (%)) | ||||||
| Female | 17 (77.3) | 17 (65.4) | 0.281 | 48 (78.7) | 31 (53.4) | 0.003 |
| Male | 5 (22.7) | 9 (34.6) | 13 (21.3) | 27 (46.6) | ||
| Age (y) | 42.68 ± 12.34 | 44.81 ± 11.69 | 0.544 | 43.37 ± 9.73 | 46.36 ± 10.15 | 0.103 |
| BMI (kg/m2) | 22.50 ± 1.21 | 23.36 ± 0.80 | 0.005 | 28.05 ± 2.70 | 27.58 ± 2.37 | 0.316 |
| Total cholesterol (mg/dL) | 130.91 ± 14.95 | 185.88 ± 57.73 | < 0.001 | 179.41 ± 35.17 | 175.34 ± 41.37 | 0.564 |
| Triglyceride (mg/dL) | 86.95 ± 24.03 | 181.27 ± 32.24 | < 0.001 | 109.16 ± 30.56 | 179.76 ± 36.14 | < 0.001 |
| HDL-C (mg/dL) | 43.27 ± 8.08 | 38.88 ± 8.87 | 0.082 | 48.36 ± 11.27 | 39.39 ± 9.06 | < 0.001 |
| LDL-C (mg/dL) | 70.23 ± 12.64 | 119.70 ± 49.97 | < 0.001 | 105.55 ± 31.17 | 112.78 ± 37.69 | 0.256 |
| FBS (mg/dL) | 81.64 ± 9.60 | 101.96 ± 19.10 | < 0.001 | 92.52 ± 27.58 | 127.14 ± 44.64 | < 0.001 |
| AC | 2.10 ± 0.53 | 4.07 ± 2.05 | < 0.001 | 2.85 ± 1.00 | 3.64 ± 1.40 | 0.001 |
| TNF-α (pg/mL) | 5.52 ± 3.96 | 11.84 ± 5.27 | < 0.001 | 4.28 ± 3.71 | 10.02 ± 5.32 | < 0.001 |
| CRP (mg/dL) | 1.50 ± 1.63 | 2.41 ± 1.85 | < 0.001 | 1.34 ± 1.41 | 2.06 ± 1.56 | 0.009 |
Comparison of Baseline Characteristics of the Studied Participants in a Case-Control Study of Metabolic Syndrome Patients and Healthy Obese and Nonobese Subjects a
4.2. Association Between Serum CRP and TNF-α with AC and MetSyn
Significantly positive relationships between the serum CRP levels and the odds of MetSyn were observed in both the crude (OR = 1.46; 95% CI: 1.13 - 1.88; P = 0.003) and full regression models. Following controlling for potential confounders, including age, gender, and BMI, in the first multiple regression model, greater CRP levels were demonstrated to increase the risk of MetSyn by approximately 1.40 folds (adjusted odds ratio [AOR] = 1.38; 95% CI: 1.07 - 1.78; P = 0.012). Further adjustments for total cholesterol and LDL-C in the last multiple regression model also showed similar findings, and about 1.3 times higher odds of affecting by MetSyn for higher CRP levels were noted (AOR = 1.32; 95% CI: 1.01-1.72; P = 0.036) (Table 2).
| Variables | Odds Ratio | 95% Confidence Interval | P-Value |
|---|---|---|---|
| Serum C - reactive protein (mg/dL) | |||
| Model 1 a | 1.46 | (1.13 - 1.88) | 0.003 |
| Model 2 b | 1.38 | (1.07 - 1.78) | 0.012 |
| Model 3 c | 1.32 | (1.01 - 1.72) | 0.036 |
| Serum tumor necrosis factor -alpha (pg/mL) | |||
| Model 1 a | 1.29 | (1.19 - 1.41) | < 0.001 |
| Model 2 b | 1.30 | (1.19 - 1.42) | < 0.001 |
| Model 3 c | 1.29 | (1.18 - 1.41) | < 0.001 |
| Atherogenic coefficient | |||
| Model 1 a | 2.05 | (1.51 - 2.77) | < 0.001 |
| Model 2 b | 2.18 | (1.56 - 3.05) | < 0.001 |
| Model 3 d | 1.98 | (1.31 - 2.98) | 0.001 |
Odds Ratio and 95% Confidence Interval of Metabolic Syndrome for Inflammatory Factors and Atherogenic Coefficient
In addition, a significant relationship was shown between MetSyn and serum TNF-α levels in both crude regression models and after considering gender, age, and BMI (AOR = 1.29; 95% CI: 1.19 - 1.41; AOR = 1.30; 95% CI: 1.19 - 1.41; respectively, P < 0.001). Interestingly, additional adjustment for total cholesterol and LDL-C in the last multiple regression models demonstrated almost the same findings of about 29% increased odds of diagnosis by MetSyn (AOR = 1.29; 95% CI: 1.18 - 1.41; P < 0.001).
Last but not least, significant associations were noticed between the AC and the odds of MetSyn in the unadjusted regression analysis (OR = 2.05; 95% CI: 1.51 - 2.77; P < 0.001). Furthermore, considering potential confounders, such as age, gender, and BMI, did not change the significance and directions of these results, and the odds of suffering from MetSyn were raised by about 2.18 folds for higher AC values (AOR = 2.18; 95% CI: 1.56 - 3.05; P < 0.001). Nevertheless, after controlling for additional variables, including FBS, CRP, and TNF-α levels, this significant relationship was slightly attenuated and was demonstrated between greater AC values and elevated odds of MetSyn (AOR = 1.98; 95% CI: 1.31 - 2.98; P = 0.001).
4.3. Correlation Between Serum CRP and TNF-α with Metabolic Parameters
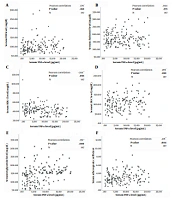
Figure 1A-F depicts the correlation between serum TNF-α concentrations and lipid and glycemic profiles. The Pearson correlation analysis elucidated significant positive correlations between the serum concentrations of TNF-α with LDL-C (r = 0.199, P = 0.01), FBS (r = 0.179, P = 0.021) and AC levels (r = 0.219, P = 0.004). A positive relationship was also observed between TNF-α and triglyceride levels (r = 0.351, P < 0.001). On the other hand, a negative correlation was noted between HDL-C with serum TNF-α concentrations (r = -0.244, P = 0.001).
 and healthy controls (n = 83) using Pearson Correlation Test with reported correlation coefficient (r) and P-values; FBS, fasting blood sugar; HDL-C, high-density lipoprotein cholesterol; LDL-C, low-density lipoprotein cholesterol; TNF-α, tumor necrosis factor-alpha.")
A to F. Correlation between lipid and glycemic biomarkers and tumor necrosis factor-alpha in a group of metabolic syndrome patients (n = 84) and healthy controls (n = 83) using Pearson Correlation Test with reported correlation coefficient (r) and P-values; FBS, fasting blood sugar; HDL-C, high-density lipoprotein cholesterol; LDL-C, low-density lipoprotein cholesterol; TNF-α, tumor necrosis factor-alpha.
Figure 2A-F characterizes the relationship between serum CRP concentrations and lipid and glycemic profiles. The Pearson correlation analysis elucidated significant positive correlations between CRP serum levels with LDL-C (r = 0.182, P = 0.018) and AC levels (r = 0.150, P = 0.053).
 and healthy controls (n = 83) using Pearson Correlation Test with reported correlation coefficient (r) and P-values; FBS, fasting blood sugar; HDL-C, high-density lipoprotein cholesterol; LDL-C, low-density lipoprotein cholesterol; CRP, C-reactive protein.")
A to F. Correlation between lipid and glycemic biomarkers and C-reactive protein in a group of metabolic syndrome patients (n = 84) and healthy controls (n = 83) using Pearson Correlation Test with reported correlation coefficient (r) and P-values; FBS, fasting blood sugar; HDL-C, high-density lipoprotein cholesterol; LDL-C, low-density lipoprotein cholesterol; CRP, C-reactive protein.
5. Discussion
In the current study, the serum levels of CRP and TNF-α as inflammatory mediators and AC, which outlines the balance between atherogenic and anti-atherogenic markers, were explored in newly diagnosed patients with MetSyn in comparison to healthy obese and nonobese participants. The obtained results revealed that higher serum pro-inflammatory mediators, including CRP and TNF-α, were related to about 32% and 29% elevated odds of newly diagnosed MetSyn, respectively, regardless of potential confounders, including age, gender, BMI, and serum lipid parameters.
Similar to the findings of the current study, the association between MetSyn and inflammatory biomarkers is shown in a study by Xue et al., in which baseline high sensitivity-CRP (hs-CRP) and longitudinal hs-CRP changes were reported to be positively associated with the incidence of MetSyn (17). Likewise, similar findings were indicated according to a population-wide cross-sectional study in the Framingham Heart Study (1). In another study by Ryu et al., inflammatory mediators, including adiponectin and white blood cells, were shown to be associated with MetSyn (18). Inflammatory markers, such as E-selectin, vascular cell adhesion molecule 1, and CRP, were also indicated to be related to insulin resistance and MetSyn in a study on elderly patients by Ingelsson et al. (19). Additionally, Ullah et al. reported significantly higher serum levels of TNF-α in participants with MetSyn than in healthy controls (24). Moreover, low-grade inflammation, as indicated through elevated serum inflammatory markers, including CRP and IL-6, is linked to peripheral arterial disease severity and coronary artery disease, as shown by Jacobs et al. (20).
Moreover, partly similar to the above-mentioned findings, recently, a study by Carmen Zaha et al. reported that obese patients (BMI ≥ 30 kg/m2, n = 80), compared to 80 normal-weight individuals (18.5 ≤ BMI < 25 kg/m2), experienced greater serum concentrations of leptin and showed higher insulin resistance levels (as marked by higher homeostasis model assessment of insulin resistance [HOMA-IR] levels) and augmented inflammation (as marked by elevated hs-CRP levels). This group also showed lower levels of adiponectin serum concentration. Among the aforementioned metabolic and inflammatory indices, adiponectin, HOMA-IR, and their ratios were significantly linked to MetSyn and its components. However, despite current results, they failed to find a significant relationship between hs-CRP and MetSyn or any of its components. Additionally, about 35% of the obese subjects were detected to have MetSyn; nonetheless, only 5% of the average-weight subjects were affected by the disorder (13). However, the prevalence of MetSyn was almost higher in the present population. The present study showed that about 54% of the normal-weight subjects and approximately 49% of overweight and obese individuals were diagnosed with MetSyn.
Furthermore, a new atherogenicity index, AC, instead of separated lipoproteins, was used for a clearer comprehension of the simultaneous role of atherogenic and anti-atherogenic lipoproteins in MetSyn risk. It was demonstrated that increasing the AC levels were accompanied by greater odds of being diagnosed with MetSyn for about 98% independent of the patient’s gender, age, BMI, and additional metabolic or inflammatory indices, including FBS, TNF-α, and CRP levels. One more notable finding of the current study was the substantial positive correlations between serum impaired metabolic profile (i.e., elevated FBS, LDL-C, triglyceride, and AC) and TNF-α levels. At the same time, a notable inverse relationship was also noted between TNF-α and HDL-C serum concentrations.
The above-mentioned results could be well explained based on the available evidence. The pro-inflammatory responses as characterized by the harmonized release of several immune and pro-inflammatory cells (e.g., leucocytes, macrophages, and mast cells) and their released mediators (e.g., cytokines, chemokines, vasoactive amines, and eicosanoids) comprise “low-grade” chronic inflammatory state which is a well-studied state associated with various metabolic disorders, including obesity, diabetes, MetSyn, atherosclerosis, and CVDs (6, 25, 26). In further attempts to delineate this condition, other phrases, such as metaflammation or para-inflammation, have been suggested that refer to an inflammatory state that is stimulated by metabolic disturbances (25). In agreement with the aforementioned finding, the present observations on the positive correlations between the serum concentrations of TNF-α and CRP, as the studied inflammatory markers, and metabolic indices, particularly LDL-C and AC, could further support this hypothesis (25).
The substantial role of inflammation as a result of dysregulation of adipose tissue and stimulated activity of monocyte and macrophage in insulin resistance, MetSyn, and subsequent adverse cardiovascular pathogenesis has been well acknowledged (26). As an inflammatory marker, CRP has been suggested to affect the signaling pathway of insulin, thereby being involved in insulin resistance (13). Additionally, it is thought that IL-6, together with TNF-α, in particular associated with obesity and higher adiposity, are linked to augmented insulin resistance probably through promoting the mitogen-activated protein kinase and protein kinase C pathways in addition to inducing the insulin receptor substrate-1 disruption. On the flip side, the experimental evidence indicated that the uptake of peripheral tissue glucose might be elevated following the neutralization of TNF-α (5, 15, 26).
As the currently studied patients were newly diagnosed with MetSyn and did not have any history of atherosclerosis, the direct association between higher AC and inflammatory mediators’ levels with an elevated risk of MetSyn might reinforce the value of these factors as the early markers of predicting the risk of atherosclerosis and CVDs among MetSyn subjects. However, further studies are needed to confirm the consideration of these biomarkers as the new features or components of MetSyn by the international guidelines. The main limitation of the current survey was its cross-sectional design, which might affect the interpretation and generalizability of the obtained findings and does not allow for exerting cause-and-effect evidence between the MetSyn risk and the studied factors.
5.1. Conclusions
The current findings revealed that the elevated serum concentrations of pro-inflammatory and atherogenic markers, including TNF-α, CRP, and AC, might be associated with higher odds of newly diagnosed MetSyn regardless of potential confounders, particularly BMI. The obtained findings might be moderated by the positive correlations observed between serum TNF-α, as the chronic inflammatory state indicator, and impaired lipid and glycemic markers. Therefore, these inexpensive and available laboratory measures that could also be used in clinical settings would be most helpful in the early detection of atherosclerosis development and primary prevention of CVDs among MetSyn subjects. However, further studies are needed to confirm the consideration of these biomarkers as the new features or components of MetSyn by the international guidelines.
