


1. Background
Obesity (body-mass-index (BMI) ≥ 30 kg/m2) is a multifactorial, chronic, and progressive disease (1) and a significant cause of morbidity and mortality, with around 603.7 million afflicted adults worldwide in 2015 (2). People living with obesity have an increased risk for various physiological comorbidities such as type 2 diabetes mellitus, cardiovascular diseases (3), and chronic low-grade inflammation (4). Additionally, obesity is associated with various impairments in behavioral and psychological health outcomes such as disordered or dysfunctional eating (5, 6), symptoms of depression and anxiety (7, 8), as well as decreases in health-related quality of life (HRQoL) (9). Moreover, chronic mental distress and dysfunctional eating behavior predict future weight gain, especially among individuals who already have a high BMI (6, 10).
Thus, the large number of obesity-related comorbidities may impair patients’ psychological and physical well-being, negatively affect long-term weight management, and limit long-term treatment success. Consequently, the necessity for multidisciplinary treatment becomes evident. Therefore, three-component lifestyle interventions comprising dietetics, physical exercise, and cognitive behavioral therapy (CBT) pose a cornerstone of obesity therapy (11). Earlier studies of relatively small size in selected populations have already demonstrated that the addition of CBT to a lifestyle intervention program leads to more weight loss and effectively improves the quality of life, possibly through altered reactivity of the stress response but also possibly by removing cognitive and behavioral obstacles to weight loss (12, 13). Indeed, it was shown that CBT for adults living with obesity seems effective in inducing improved eating behaviors, such as increased cognitive restraint and reduced emotional eating, which, in turn, can be expected to enhance weight loss (14). Thus, addressing psycho-behavioral comorbidities (beyond the measurement of cardiometabolic outcomes) may lead to improved weight management, underlining its relevance as an important treatment outcome. Despite the recommended multidisciplinary treatment approach, the definition of treatment success is often still based only on an average weight loss of ≥ 5%, as this has been shown to induce clinically relevant improvements in physiological health parameters (11, 15). Furthermore, there is a relative paucity of studies with a three-component lifestyle intervention, while these studies have a relatively short follow-up (6 months to a year) and focus mainly on cardiometabolic outcomes, but not on favorable psychological changes, changes in body composition, hormonal and immunological changes (16). In our study, we describe a wide spectrum of changes after long-term follow-up (1.5 years) of a three-component lifestyle intervention for patients with obesity, including cardiometabolic, endocrine, immunological, psychological, and behavioral outcomes.
2. Objectives
Our main objective is to provide a comprehensive overview of long-term changes in physiological, psychological, and behavioral health outcomes in response to a multidisciplinary 1.5-year combined lifestyle intervention (CLI), including cognitive behavioral therapy. Additionally, we investigated whether these changes were related to weight loss.
3. Methods
3.1. Study Design and Population
Participants were enrolled in the CLI at the outpatient clinic of the Obesity Center CGG at Erasmus University Medical Center, Rotterdam, the Netherlands, between October 2011 and June 2020. All patients of the CGG have been registered in a data bank. Of those, only those have been included in the research scheme which gave informed consent and fulfilled the following criteria: BMI ≥ 30 kg/m2, age ≥ 18 years, sufficient treatment adherence (e.g. ≥ three sessions missed), and presence of at least one obesity-related comorbidity (e.g., hypertension, type 2 diabetes, dyslipidemia, non-alcoholic fatty liver disease or obstructive sleep apnoea). Exclusion criteria were inability to speak Dutch, wish to become pregnant in the near future, intellectual disability, and (severe) behavioral problems that would impede functioning in a group setting. A physician, a dietician, a physical therapist, and a psychologist for eligibility for the CLI screened potential participants. Patients were enrolled in the program if no factors were detected that would indicate exclusion or necessitate additional treatments. Retrospectively, two patients have been excluded from analyses regarding insulin, blood glucose, homeostasis model assessment of insulin resistance (HOMA-IR), triglycerides, high-density lipoprotein cholesterol (HDL-C), low-density lipoprotein cholesterol (LDL-C), and immune parameters since they reported that they were not fasting at blood draw. Additionally, nine patients using thyroid hormone suppletion medication were excluded from thyroid-stimulating hormone (TSH) and free thyroxine (FT4) analyses.
Notably, during almost nine years during which the data for this study were collected, the number of parameters assessed was expanded. Thus, some parameters are more comprehensive than others that were added during the more recent years of the program.
3.2. Intervention
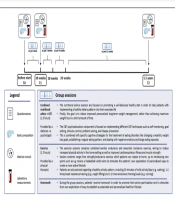
Two groups per year started a 1.5-year trajectory. In order to provide the best possible guidance given the extensiveness of the treatment, group size was restricted to a maximum of 10 to 12 people per group. Throughout the intervention, patients received 18 group sessions consisting of 1.5 hours of combined nutritional advice and CBT-based psychoeducation (provided by a dietician and a psychologist, respectively). These were followed by an exercise session consisting of 1.5 hours of aerobic and anaerobic exercise (guided by a physical therapist). Session frequency was gradually tapered from weekly at the beginning (weeks 1 - 10) to meetings every three months at a later stage of the program (week 25 until 1.5 years). For details, see Figure 1. The sessions were held in a meeting room (CBT group sessions with dietician and psychologist together) and, after that, the gym (exercise sessions) of the Erasmus Medical Center or at similar meeting rooms/sports hall at the Erasmus University. A financial incentive for treatment compliance and adherence was provided as patients were asked to pay €50 before the start of treatment, which they would receive back as soon as they finished the program. In order to finish the program, patients were allowed to miss no more than three sessions in total.

Description of the combined lifestyle intervention. CBT, cognitive behavioural therapy
3.3. Anthropometrics
Anthropometric measurements were performed at each evaluation time point by trained outpatient clinic assistants. Height was measured using a wall-mounted stadiometer. Weight in kilograms (kg) was assessed using a calibrated scale, with the patient wearing clothes and standing without shoes. Body-mass-index was calculated as weight divided by height in meters squared (kg/m2). Waist circumference (WC) in centimeters (cm) was measured unclothed, halfway between the superior anterior iliac crest and the lowest rib after a normal expiration, and the average of two consecutive measurements was noted. All anthropometric parameters were rounded to the nearest decimal. Blood pressure was measured using an automatic blood pressure monitor (DinaMap Monitor; GE Health Care, Freiburg, Germany).
3.4. Dual-energy X-ray Absorptiometry Scan
In a subsample of 37 participants (27 women), dual-energy X-ray absorptiometry (DEXA) scans were performed for body composition analysis at all three-time points. Baseline DEXA scans were performed using either the Lunar Prodigy Advance or the Lunar iDEXA (both: GE Healthcare, Madison, WI, USA). Measures of body composition were shown to be comparable between the two DEXA scans (17). We assessed total mass (kg), fat mass (kg), fat-free mass (kg), the fat and fat-free mass percentage of total body mass (%), android fat mass (% fat), gynoid % fat, and android/gynoid ratio.
3.5. Blood Sampling and Laboratory Analyses
After fasting overnight, venous blood samples were drawn at the three evaluation time points. Part of these blood samples was immediately analyzed, as part of standard clinical care, using routine laboratory measurements. These included: Serum insulin, glucose, glycated hemoglobin A1c (HbA1c), plasma lipids (triglyceride level, TG; HDL-C, LDL-C), aspartate aminotransferase (AST), alanine aminotransferase (ALT), gamma-glutamyl transpeptidase (gGT), thyroid-stimulating hormone (TSH), free thyroxine (FT4) and testosterone. Free testosterone levels were then calculated based on sex-hormone binding globulin (SHBG) levels using Vermeulen’s formula (18). Homeostasis model assessment of insulin resistance was calculated using the following formula:
In addition, frozen serum samples stored for a maximum duration of 7 years (at -20 or -80°C) were used to measure cortisol, dehydroepiandrosterone sulfate (DHEAS), and immune parameters. Serum cortisol and DHEAS were measured using liquid chromatography-mass spectrometry. Cortisol data were analyzed only for patients whose blood was drawn between 7:00 and 11:00 am at all time points (due to the circadian rhythm of cortisol (19)).
The immune parameters monocyte chemoattractant protein-1 (MCP1/CCL2), interleukin one receptor antagonist (IL-1ra), chemokine ligand 19 (CCL19), and vascular endothelial growth factor (VEGF) were measured using a customized panel of the commercially available R&D Luminex High-Performance Assay.
Commercially available ELISA kits were used to measure soluble IL-2 receptor (sIL-2R) (Diaclone, Besancon, France), soluble CD163 (sCD163) (Trillium Diagnostics/IQ Products BV, Groningen, the Netherlands), and soluble mannose receptor (sMR) (Hycult Biotech, Uden, the Netherlands).
3.6. Metabolic Syndrome Criteria and Type 2 Diabetes Mellitus
Metabolic syndrome was defined based on the joint interim statement by Alberti et al. (20).
The presence of metabolic syndrome was defined as the presence of at least three out of five of the following criteria: Elevated waist circumference (Europe, United States, Canada: Men ≥ 102 cm, women ≥ 88 cm; Asian (including Japan), Ethnic Central and South American: Men ≥ 90 cm, women ≥ 80 cm; Middle East Mediterranean, Sub-Saharan African: Men ≥ 94cm, women ≥ 80 cm), elevated triglycerides (≥ 1.7 mmol/L) or drug treatment for elevated triglycerides, reduced HDL-C (< 1.0 mmol/L in males; < 1.3 mmol/L in females) or drug treatment for reduced HDL-C, elevated blood pressure (systolic ≥ 130 and/or diastolic ≥ 85 mmHg) or antihypertensive drug treatment, elevated fasting glucose (≥ 100 mg/dL (5.6 mmol/L)) or drug treatment for elevated glucose. Type 2 diabetes mellitus was defined according to the ADA criteria (21).
3.7. Psychological Well-being, Quality of Life, and Eating Behavior
For the assessment of psychological health, the following questionnaires were used: The Hospital Anxiety Depression Scale (HADS), which measures symptoms of anxiety and depression (22); the Perceived Stress Scale (PSS), which reflects an individual’s perceived stress level (23), and the Symptom Checklist-90 (SCL-90) which measures symptoms of psychopathology (24). Regarding the HADS and PSS, we report only baseline and 1.5-year measurements since there were too few patients for whom 10-week measurements were available. Body image and self-esteem were assessed with the Fear of Negative Appearance Evaluation Scale (FNAES) (25) and the Rosenberg Self-Esteem Scale (RSE) (26), respectively. The Impact of Weight on Quality of Life-Lite (IWQoL-Lite) questionnaire was used to assess obesity-specific HRQoL (27).
We used the Dutch Eating Behaviour Questionnaire (DEBQ) to assess the three domains ‘restrained eating’, ‘emotional eating,’ and ‘external eating’. Higher scores indicate a stronger tendency towards the respective subscale behavior (28). The Eating Disorder Examination Questionnaire (EDE-Q) was used to assess eating behaviors associated with eating disorders (29). The General Food Craving Trait Questionnaire (FCQ-T) was used to assess general trait-like food cravings (30). All questionnaires were validated in previously published quantitative analyses (23, 25, 30-35). Reliability ranged between Cronbach’s alpha = 0.587 - 0.967 in our dataset.
3.8. Dietary Intake and Physical Activity
Dietary intake was measured using a self-administered 3-day food diary, and a dietician checked these. Fibre, protein, and energy consumption was calculated using Evry-Diëtist 6.7.7.0 (Evry BV, Alphen aan den Rijn, the Netherlands). Energy percentages were calculated, which reflect the energy contributed by that specific macronutrient to the total daily energy intake. Dietary fiber intake was computed as dietary fiber in grams per 1000 consumed kilocalories.
The International Physical Activity Questionnaire (IPAQ) was used to estimate patients’ levels of activity expressed as ‘metabolic equivalent of task’ (MET) minutes per week, a previously validated and standardized measure of energy expenditure (36, 37). One MET represents the energy expenditure of an individual while sitting still, and 3 - 6 METs correspond to moderately intensive physical activity (38).
3.9. Primary and Secondary Outcome Measures
Primary outcome measures are weight changes (kg), waist circumference (cm), and weight-related quality of life (measured with the IWQoL-Lite) between T0 (baseline) and T2 (1,5 years after the beginning of treatment). All other outcome measures were defined as secondary outcome measures. Primary and secondary endpoints were assessed after ten weeks (lab measurements after 10.1 ± 1.6 weeks; anthropometric parameters after 10.9 ± 1.4 weeks) and after 1.5 years (lab measurements after 78.8 ± 3.8 weeks; anthropometric parameters after 79.5 ± 4.1 weeks).
3.10. Statistical Analysis
To detect within-subject changes in continuous variables across the measurement time points, we used repeated-measure ANOVAs with Bonferroni-corrected post-hoc t-tests or Friedman’s test with Bonferroni-corrected post-hoc Wilcoxon signed-rank tests (depending on the normal distribution). Differences between responders and non-responders regarding age, baseline BMI, and baseline WC were tested with independent sample t-tests. Differences in responder status between sexes and ethnicities were tested using the chi-squared test of independence. Proportions of patients with diabetes or metabolic syndrome were compared across three-time points using Cochran’s Q test. Proportions of patients with clinically relevant HADS depression or anxiety scores were compared between baseline and 1.5 years using McNemar’s tests.
Univariable linear regressions were used to determine associations between weight loss (% change BMI) as the predictor (‘independent variable’), calculated as:
and changes in other outcomes (‘dependent variable’; absolute changes, calculated as variableT2 - variableT0), corrected for sex and age. If residuals were not normally distributed, log10 transformation was applied to the response variable to achieve normal distribution. This was the case for HbA1c, blood glucose, HOMA-IR, SHBG, triglycerides, ALT, AST, gGT, MCP1, IL-1ra, CCL19, VEGF, sCD163, and SCL-90. Data are depicted as mean ± standard deviation (SD) or median (interquartile range (IQR)), depending on the normal distribution. Based on the mean BMI of 40.5 kg/m2 ± 6.2 of patients in our outpatient clinic (39) and a power of 0.8, a sample size of n = 74 is needed for the main outcome measure of 5% weight loss. All statistical analyses were performed using SPSS version 25 (IBM Corp., 2019).
3.11. Ethical Consideration
The study was approved by the medical ethical committee of Erasmus University Medical Center, Rotterdam, the Netherlands (MEC2012257).
4. Results
4.1. Study the Population
Of the 155 patients whose 1.5-year trajectory ended between October 2011 and June 2020, 96 (73 women; 81 Caucasians) were included in the final analysis (Appendix 1). Dropouts and completers did not differ concerning sex, age, ethnicity, baseline BMI and WC.
4.2. Anthropometrics
Mean weight loss was -4.52% ± 3.11 at ten weeks and -5.15% ± 6.49 at 1.5 years (both P < 0.001 compared to baseline). Forty-seven patients (49% out of 96 available, 38 were women) achieved a weight loss of ≥ 5%. Of those, 22 patients achieved a weight loss of even ≥ 10% at the end of the program (22.9% out of 96 available, 17 women). Based on the formula of Pourhoseingholi et al. (40), a prevalence of ≥ 5% weight loss of 0.48, and a precision of 0.096, we calculated a z-score of 1.946. This z-score corresponds to a power of > 90%.
Waist circumference decreased by -5.57% ± 4.60 at ten weeks and -6.41% ± 6.70 after 1.5 years (both P < 0.001 compared to baseline). Among the subset of 37 patients for whom DEXA scans were available at all three time points (27 women), we saw a -7.52% ± 5.86 and -9.81% ± 11.49 decrease in body fat at ten weeks and 1.5 years respectively (both P < 0.001 compared to baseline). Fat-free mass did not change significantly. Results are shown in Table 1.
| Variables | N | Baseline | Ten Weeks | 1.5 Years | Reference |
|---|---|---|---|---|---|
| Sex (No. (%) female) | 96 | 73 (76.0) | |||
| Age (y) | 96 | 42 ± 13 | |||
| Ethnicity (Caucasian) | 93 | 81 (84.4) | |||
| Metabolic syndrome | 67 | 44 (65.7) | 42(62.7) | 38 (56.7) | |
| Type 2 diabetes | 90 | 20 (22.2) | 19 (21.1) | 18 (20.0) | |
| Anthropometrics | |||||
| BMI (kg/m2) | 96 | 39.9 ± 5.7 | 38.1 ± 5.5 b | 37.9 ± 6.1 b | |
| Weight (kg) | 96 | 117.6 ± 19.3 | 112.2 ± 18.5 b | 111.6 ± 19.8 b | |
| Waist circumference (cm) | 94 | 114 ± 15 | 108 ± 14 b | 107 ± 16 b | |
| Systolic blood pressure (mmHg) | 35 | 133 ± 12 | 132 ± 14 | 138 ± 14 | |
| Cardiometabolic parameters | |||||
| Insulin (pmol/L) | 69 | 140 (87 - 216) | 108 (76 - 154) c | 109 (69 - 156) b | < 100 d |
| Hba1c (mmol/L) | 92 | 37 (36 - 40) | 37 (34 - 39) c | 37 (34 - 40) b | < 42 d |
| Blood glucose (mmol/L) | 89 | 5.3 (5.0 - 6.2) | 5.2 (4.9 - 5.8) e | 5.4 (5.0 - 5.9) f | 10 - 70 (men), 20 - 120 (women) d |
| HOMA-IR | 69 | 5.03 (3.12 - 7.81) | 3.87 (2.37 - 5.16) b | 4.15 (2.38 - 5.96) b | < 2.9 (men), < 1.7 (women) d |
| SHBG (nmol/L) | 80 | 30.7 (21.8 - 44.6) | 36.2 (24.5 - 55.5) b | 36.7 (25.1 - 53.2) b | age- and sex-specific d |
| Triglycerides (mmol/L) | 88 | 1.41 (0.97 - 2.02) | 1.20 (0.90 - 1.64) e | 1.23 (0.83 - 1.61) c | age- and sex-specific d |
| HDL-C (mmol/L) | 87 | 1.28 (1.07 - 1.46) | 1.20 (1.04 - 1.37) e | 1.33 (1.15 - 1.54) e, g | < 35 (men) < 31 (women) d |
| LDL-C (mmol/L) | 87 | 3.37 ± 0.91 | 3.12 ± 0.85 b | 3.21 ± 0.88 c | < 55 (men), < 38 (women) d |
| ALT (U/L) | 91 | 26 (20 - 36) | 24 (19 - 33) e | 23 (17 - 31) c | < 42 d |
| AST (U/L) | 93 | 24 (19 - 30) | 22 (19 - 27) | 21 (19 - 26) e | 10 - 70 (men), 20 - 120 (women) d |
| Gamma-GT (U/L) | 93 | 28 (21 - 45) | 24 (18 - 37) b | 23 (18 - 40) c | < 2.9 (men), < 1.7 (women) d |
| Thyroid function | |||||
| TSH (mU/L) | 80 | 2.00 (1.54 - 2.77) | 1.86 (1.45 - 2.73) | 2.08 (1.41 - 2.95) | 0.56 - 4.27 d |
| FT4 (pmol/L) | 78 | 16.0 ± 2.6 | 15.6 ± 2.4 | 16.4 ± 2.5 f | 14.0 - 29.0 d |
| Body composition | |||||
| Fat mass (kg) | 37 | 58.05 ± 11.74 | 53.63 ± 10.78 b | 52.12 ± 11.20 b | |
| Fat-free mass (kg) | 35 | 56.79 (51.18 - 69.17) | 56.04 (51.32 - 68.18) | 56.04 (51.18 - 67.54) | |
| Body fat (%) | 37 | 48.95 ± 5.15 | 47.25 ± 5.29 b | 46.55 ± 5.68 b | |
| Android fat (% fat) | 37 | 57.75 ± 5.49 | 55.86 ± 6.25 c | 54.73 ± 6.34 b | |
| Gynoid fat (% fat) | 37 | 51.43 ± 5.90 | 49.14 ± 6.45 b | 48.51 ± 6.67 b | |
| Android/gynoid ratio | 35 | 1.13 ± 0.12 | 1.14 ± 0.14 | 1.14 ± 0.13 | |
| Steroid hormones | |||||
| Blood cortisol (nmol/L) | 17 | 354.3 (273.9 - 407.4) | 364.0 (268.2 - 417.0) | 345.6 (256.1 - 411.9) | 200 - 700 d |
| DHEAS (umol/L) | 39 | 3.00 (1.64 - 5.22) | 2.70 (1.80 - 4.55) | 2.91 (1.58 - 5.60) | |
| Testosterone (nmol/L) | |||||
| Men | 18 | 9.80 ± 2.44 | 11.59 ± 2.73 | 12.10 ± 4.17 e | 9.2 - 30 d |
| Women | 30 | 0.80 (0.59 - 1.10) | 0.90 (0.48 - 1.50) | 0.82 (0.53 - 1.05) | 0.2 - 2.0 d |
| Free testosterone (pmol/L) | |||||
| Men | 17 | 213.97 (180.76 - 280.67) | 260.25 (226.84 - 283.76) | 251.70 (214.36 - 296.81) | 245 - 785 d |
| Women | 27 | 12.02 (8.42 - 20.11) | 12.01 (8.22 - 18.57) | 10.22 (7.91 - 16.29) | |
| Immune parameters | |||||
| MCP1 (pg/mL) | 39 | 316.1 ± 121.7 | 313.1 ± 109.0 | 300.2 ± 100.6 | |
| IL-1ra (pg/mL) | 39 | 832.8 (569.6 - 1251.0) | 890.9 (620.2 - 1414.0) | 592.3 (401.2 - 867.3) c, g | |
| CCL19 (pg/mL) | 39 | 66.0 (54.0 - 86.0) | 66.3 (56.8 - 93.0) | 63.4 (47.6 - 100.4) | |
| VEGF (pg/mL) | 39 | 131.1 (94.0 - 200.0) | 129.7 (93.3 - 176.8) | 121.4 (82.0 - 185.9) c | |
| sIL-2R (pg/mL) | 39 | 4385 (3244 - 6528) | 4304 (2678 - 6079) | 3906 (2906 - 5551) b | |
| sMR (pg/mL) | 39 | 180.5 ± 117.9 | 167.1 ± 105.0 | 144.6 ± 93.6 e | |
| sCD163 (pg/mL) | 39 | 1207.2 (1008.1 - 1491.3) | 1135.9 (937.3 - 1340.1) e | 1082.5 (935.1 - 1447.7) |
Changes in Anthropometrics, Metabolic Health Indicators, Steroid Hormones, and Immune Parameters in Response to Combined Lifestyle Intervention a
4.3. Metabolic and Endocrine Parameters
We observed significant beneficial changes in metabolic parameters (Table 1), including decreases in insulin levels, HbA1c, triglycerides, LDL, ALT, AST, and gGT, along with increases in HDL-C and SHBG.
Among the 18 men for whom testosterone levels were known at all three time points, we saw significant increases in total testosterone levels but not free testosterone after 1.5 years compared to baseline (+ 12.3% (-2.4 - 40.0), P < 0.05, Table 1). At baseline, 10 of these men (55.55%) had levels below the normal range at T0; this number was reduced to 5 men (27.77%) at ten weeks and six men (33.33%) at 1.5 years. We did not see significant changes in blood cortisol, DHEAS, or TSH.
4.4. Immune Parameters
Among the immune parameters, we saw significant decreases over time in sIL-2R, IL-1ra, VEGF, and sCD206/sMR (Table 1). The other immune parameters did not change significantly.
4.5. Psychological Well-being
At 1.5 years, patients reported decreases in HADS total (P < 0.01) and HADS depression scores (P < 0.001) as well as PSS scores (P < 0.05), see Table 2. Concerning the cut-off values for clinically significant symptom severity in HADS scores, 17 patients (33.3%) had severe depressive symptoms at T0, and nine patients (17.6%) reported severe depressive symptoms at 1.5 years. A total of 16 patients (30.8%) had severe anxiety symptoms at T0 and 12 patients (23.1%) at 1.5 years. The changes in proportions of clinically significant cases of anxiety/depression were, however, not statistically significant (P > 0.05).
| Variables | N | Max. Score | Baseline | Ten Weeks | 1.5 Years | Interpretation |
|---|---|---|---|---|---|---|
| IWQoL-Lite (total) | 80 | 100 | 66.6 ± 15.3 | 73.9 ± 15.1 b | 78.6 ± 13.1 b, c | Higher score = higher life quality d |
| Physical functioning | 80 | 100 | 61.6 ± 20.0 | 71.2 ± 18.3 b | 75.6 ± 15.3 b, c | |
| Self-esteem | 80 | 100 | 55.1 ± 26.5 | 64.2 ± 23.8 b | 72.2 ± 22.4 b, c | |
| Sexual life | 65 | 100 | 75.0 (50.0 - 87.5) | 75.0 (56.3 - 100) e | 87.5 (68.8 - 100) b | |
| Public distress | 80 | 100 | 90.0 (70.0 - 95.0) | 90.0 (75.0 - 100) | 90.0 (75.0 - 100) e | |
| Work | 76 | 100 | 87.5 (75.0 - 100) | 93.8 (82.8 - 100) | 93.8 (75.0 - 100) | |
| SCL-90 (total) | 56 | 4 | 0.45 (0.19 - 0.69) | 0.31 (0.12 - 0.69) e | 0.31 (0.15 - 0.71) f | Higher score = more psychopathology g |
| Somatization | 70 | 4 | 0.50 (0.17 - 1.00) | 0.46 (0.17 - 0.86) | 0.42 (0.08 - 0.92) | |
| Obsessive-compulsive | 74 | 4 | 0.65 (0.20 - 1.00) | 0.50 (0.10 - 0.81) f | 0.50 (0.10 - 0.80) e | |
| Interpersonal sensitivity | 74 | 4 | 0.56 (0.22 - 1.00) | 0.44 (0.11 - 0.92) | 0.44 (0.19 - 0.89) | |
| Depression | 67 | 4 | 0.69 (0.31 - 1.30) | 0.54 (0.15 - 1.00) f | 0.46 (0.15 - 1.08) | |
| Anxiety | 72 | 4 | 0.20 (0.10 - 0.60) | 0.13 (0.00 - 0.40) | 0.20 (0.00 - 0.50) | |
| Hostility | 76 | 4 | 0.33 (0.17 - 0.63) | 0.17 (0.00 - 0.33) | 0.17 (0.00 - 0.50) f | |
| Phobic anxiety | 75 | 4 | 0.00 (0.00 - 0.29) | 0.00 (0.00 - 0.14) | 0.00 (0.00 - 0.14) | |
| Paranoid | 75 | 4 | 0.33 (0.00 - 0.67) | 0.17 (0.00 - 0.50) | 0.17 (0.00 - 0.50) f | |
| Psychoticism | 70 | 4 | 0.20 (0.00 - 0.40) | 0.10 (0.00 - 0.33) f | 0.10 (0.00 - 0.30) | |
| Additional | 75 | 4 | 0.71 (0.43 - 1.14) | 0.57 (0.14 - 0.86) b | 0.57 (0.29 - 1.10) f | |
| FNAES (total) | 25 | 30 | 17 ± 7 | 15 ± 7 f | 13 ± 6 e | Higher score = more fear of negative appearance h |
| HADS (total) i | 51 | 42 | 11 (8 - 18) | 8 (5 - 12) e | Higher score = more depression/anxiety j | |
| Depression | 51 | 21 | 5 (3 - 9) | 2 (1 - 5) e | ||
| Anxiety | 52 | 21 | 6 (4 - 8) | 5.5 (3.3 - 7) | ||
| PSS (total) k | 65 | 56 | 25.8 ± 7.3 | 23.4 ± 8.2 f | Higher score = more stress l | |
| RSE (total) | 71 | 40 | 30 ± 6 | 31 ± 6 | 32 ± 5 b | Higher score = more self-esteem m |
Psychological Parameters and Quality of Life in Response to Combined Lifestyle Intervention a
In addition, there was an increase in HRQoL concerning the IWQoL-Lite total score as well as the following subscales: Physical functioning, self-esteem, sexual life (all P < 0.001), and public distress (P < 0.01) (Table 2). We also saw significant decreases in SCL-90 total scores, which were driven by decreases in the subscales of obsessive-compulsive symptoms, hostility, ‘additional’, and paranoid symptoms (all P < 0.05). Similarly, FNAES scores were decreased (P < 0.01). Finally, we observed a small but significant increase in the RSE scores, indicating an increase in self-reported self-esteem (P < 0.001).
4.6. Eating Behavior
At the end of the program, there were significant decreases in the DEBQ scales in emotional and external eating and increases in restrained eating (Table 3). Additionally, we saw significant decreases in the EDE-Q total score and EDE-Q subscales eating concern, weight concern, and shape concern. FCQ-T total score decreased at 1.5 years (P < 0.05), indicating decreased cravings.
| Variables | N | Max. Score | Baseline | Ten Weeks | 1.5 Years | Interpretation |
|---|---|---|---|---|---|---|
| DEBQ | Higher score = higher tendency towards that eating behavior c | |||||
| Emotional eating | 75 | 5 | 2.97 ± 0.81 | 2.61 ± 0.80 d | 2.65 ± 0.81 e | |
| External eating | 76 | 5 | 3.08 ± 0.61 | 2.79 ± 0.57 d | 2.71 ± 0.59 d | |
| Restrained eating | 76 | 5 | 2.83 ± 0.57 | 3.19 ± 0.59 d | 3.19 ± 0.50 d | |
| EDE-Q (total) | 49 | 6 | 2.3 ± 0.9 | 2.0 ± 0.9 | 1.9 ± 1.0 f | Higher score = more pathology g |
| Restraint | 53 | 6 | 1.4 ± 1.0 | 2.3 ± 0.8 d | 1.8 ± 1.0 | |
| Eating concern | 52 | 6 | 1.4 (0.4 - 2.4) | 0.8 (0.4 - 1.4) f | 0.9 (0.4 - 1.8) f | |
| Weight concern | 52 | 6 | 3.0 ± 1.1 | 2.5 ± 1.2 f | 2.3 ± 1.3 e | |
| Shape concern | 53 | 6 | 3.2 ± 1.3 | 2.5 ± 1.5 d | 2.3 ± 1.5 d | |
| FCQ-T (total) | 16 | 126 | 63 ± 23 | 45 ± 18 | 51 ± 15 f | Higher score = more pathology h |
| Preoccupation with food | 18 | 36 | 16 ± 8 | 14 ± 6 | 14 ± 5 | |
| Loss of control | 18 | 42 | 22 ± 8 | 16 ± 7 | 17 ± 6 e | |
| Positive outcome expectancy | 20 | 24 | 11 ± 4 | 8 ± 4 | 10 ± 4 | |
| Emotional craving | 19 | 24 | 14 ± 6 | 10 ± 4 f | 11 ± 5 f | |
| Physical activity | ||||||
| IPAQ score (MET.minutes/per week) | 39 | 2640 (1229 - 6030) | 3741 (1758 - 6058) | 3810 (2079- 7662) | Higher score = more energy expenditure i | |
| Nutrition | 51 | |||||
| Total energy (kJ) (kcal) | 8171.3; (5891.1 - 9907.7); (1953 (1408 - 2368)) | 7363.8; (5891.1 - 7978.9) e; (1760 (1408 - 1907)) e | 6995.6; (6121.2 - 8238.3) e; (1672 (1463 - 1969)) e | |||
| Protein (en%) | 51 | 18.5 (15.6 - 21.6) | 20.1 (18.5 - 22.5) f | 19.6 (16.5 - 21.8) | 19 - 50 years old: 9 - 25 en% j | |
| Total fat (en%) | 51 | 35.1 ± 6.2 | 32.9 ± 5.6 f | 33.0 ± 6.7 | 51 - 70 years old: 10 - 25 en% j | |
| Saturated fat (en%) | 51 | 12.3 (11.1 - 15.1) | 11.0 (9.0 - 12.8) e | 11.2 (9.1 - 13.2) f | 20 - 30.35 en% j | |
| Total carbohydrates (en%) | 51 | 44.6 ± 6.1 | 45.5 ± 4.8 | 45.7 ±7.0 | As low as possible, max. 10 en% j | |
| Total mono- and disaccharides (en%) | 51 | 18.3 (14.7 - 21.7) | 17.7 (14.4 - 21.0) | 17.0 (13.8 - 19.4) | 40 en% j | |
| Fibre % of kcal | 51 | 10.4 ± 3.4 | 13.9 ± 3.6 d | 13.7 ± 3.9 d | ≥ 14 g/1000 kcal k |
4.7. Physical Activity and Nutritional Intake
We observed a trend towards increased physical activity, as measured via the IPAQ score MET minutes (P = 0.064). The total median energy intake decreased significantly from 8171 KJ (1953 kcal) at baseline to 6996 KJ (1672 kcal) at the end of the program. In addition, saturated fat intake significantly decreased after 1.5 years while fiber intake increased significantly. We did not see any other significant changes in dietary intake after 1.5 years. For details, see Table 3.
4.8. Associations of Weight Loss with Changes in Other Outcomes
In linear regressions, weight loss at 1.5 years was associated with changes in various metabolic parameters after 1.5 years (Table 4). Both before and after adjustment for age and sex, greater weight loss correlated with greater increases in HDL-C and SHBG and greater decreases in insulin levels, HbA1c, and AST (all P < 0.05). In addition, we found a significant positive association of weight loss with decreases in gGT and HOMA-IR (P < 0.01).
| Predictor: % Change BMI (T2 - T0) | Unadjusted | Adjusted for Age and Sex b | |||||
|---|---|---|---|---|---|---|---|
| N | β (95% CI) | Standardized β | P | β (95% CI) | Standardised β | P | |
| Metabolic parameters | |||||||
| T2 - T0 insulin | 76 | 30.251 (0.632; 50.871) | 0.276 c | 0.016 | 30.364 (0.709; 60.019) | 0.286 c | 0.014 |
| T2 - T0 Hba1c (log) | 92 | 0.0014 (0.0001; 0.0027) | 0.213 c | 0.042 | 0.0014 (0.00003; 0.0027) | 0.210 c | 0.045 |
| T2 - T0 blood glucose (log) | 89 | 0.0012 (-0.0009; 0.0034) | 0.119 | 0.266 | 0.0012 (-0.0009; 0.0034) | 0.120 | 0.266 |
| T2 - T0 HOMA-IR (log) | 76 | 0.0200 (0.0114; 0.0286) | 0.475 d | < 0.001 | 0.0202(0.0114; 0.0290) | 0.478 d | < 0.001 |
| T2 - T0 SHBG (log) | 80 | -0.0077 (-0.0133; -0.0020) | -0.293 e | 0.008 | -0.0073 (-0.0131; -0.0015) | -0.280 c | 0.014 |
| T2 - T0 triglycerides (log) | 88 | 0.0058 (0.0001; 0115) | 0.212 c | 0.048 | 0.0057 (-0.00001; 0113) | 0.209 | 0.050 |
| T2 - T0 HDL | 87 | -0.011 (-0.021; -0.002) | -0.250 c | 0.019 | -0.012 (-0.021; -0.002) | -0.259 c | 0.016 |
| T2 - T0 LDL | 87 | 0.009 (-0.006; 0.025) | 0.133 | 0.220 | 0.009 (-0.006; 0.025) | 0.132 | 0.226 |
| T2 - T0 ALT (log) | 91 | 0.0114 (0.0050; 0.0178) | 0.353 d | < 0.001 | 0.0117 (0.0054; 0.0180) | 0.361 d | < 0.001 |
| T2 - T0 AST (log) | 93 | 0.0057 (0.0010; 0.0104) | 0.246 c | 0.018 | 0.0059 (0.0013; 0.0106) | 0.257 c | 0.013 |
| T2 - T0 gamma-GT (log) | 93 | 0.0082 (0.0026; 0.0139) | 0.291 e | 0.005 | 0.0084 (0.0027; 0.0141) | 0.297 e | 0.004 |
| T2 - T0 TSH | 79 | 0.017 (-0.018; 0.051) | 0.109 | 0.341 | 0.017 (-0.018; 0.053) | 0.113 | 0.334 |
| T2 - T0 FT4 | 76 | -0.055 (-0.128; 0.017) | -0.173 | 0.135 | -0.055 (-0.130; 0.020) | -0.174 | 0.146 |
| T2 - T0 cortisol | 17 | -20.657 (-160.017; 100.704) | -0.424 | 0.678 | -90.466 (-250.105; 60.172) | -0.388 | 0.214 |
| T2 - T0 DHEAS | 39 | 0.018 (-0.033; 0.069) | 0.117 | 0.477 | 0.023 (-0.031; 0.077) | 0.149 | 0.389 |
| T2-T0 Testosterone a | |||||||
| Male | 19 | -0.132 (-0.454; 0.190) | -0.206 | 0.398 | -0.125 (-0.485; 0.235) | -0.194 | 0.472 |
| Female | 30 | -0.017 (-0.056; 0.021) | -0.172 | 0.363 | -0.017 (-0.056; 0.022) | -0.171 | 0.373 |
| T2-T0 Free testosteronea (log) | |||||||
| Male | 18 | 0.0024 (-0.0079; 0.0128) | 0.113 | 0.627 | 0.0017 (-0.0094; 0.0127) | 0.084 | 0.754 |
| Female | 27 | 0.0097 (-0.0122; 0.0316) | 0.179 | 0.371 | 0.0103 (-0.0118; 0.0325) | 0.191 | 0.346 |
| Immune parameters | |||||||
| T2 - T0 MCP1 (log) | 39 | 0.0011 (-0.0027; 0.0049) | 0.094 | 0.567 | 0.0017(-0.0023; 0.0058) | 0.150 | 0.391 |
| T2 - T0 IL-1ra (log) | 39 | 0.0158 (0.0064; 0.0251) | 0.490 e | 0.002 | 0.0163 (0.0063; 0.0263) | 0.507 e | 0.002 |
| T2 - T0 CCL19 (log) | 39 | 0.0038 (-0.0025; 0.0101) | 0.230 | 0.230 | 0.0047 (-0.0019; 0.0113) | 0.242 | 0.161 |
| T2 - T0 VEGF (log) | 39 | 0.0027 (-0.0013; 0.0067) | 0.217 | 0.185 | 0.0027 (-0.0016; 0.0070) | 0.221 | 0.209 |
| T2 - T0 sIL-2R | 39 | 580.639 (40.450; 1120.827) | 0.339 c | 0.035 | 560.205 (-20.169; 1140.578) | 0.325 | 0.059 |
| T2 - T0 sMR | 39 | -0.275 (-40.097; 30.547) | -0.024 | 0.885 | -0.081 (-40.056; 30.894) | -0.007 | 0.967 |
| T2 - T0 sCD163 (log) | 39 | 0.0005 (-0.0040; 0.0049) | 0.035 | 0.834 | 0.0004 (-0.0044, 0.0051) | 0.028 | 0.874 |
| Psychological health | |||||||
| T2 - T0 HADS | 51 | 0.102 ( -0.150; 0.354) | 0.115 | 0.421 | 0.121 ( -0.138; 0.379) | 0.136 | 0.353 |
| T2 - T0 IWQoL-Lite | 84 | -0.492 (-0.932; -0.053) | -0.239 c | 0.029 | -0.493 (-0.936; -0.051) | -0.239 c | 0.029 |
| T2 - T0 SCL-90 (log) | 62 | -0.0053 (-0.0219; 0.0114) | -0.082 | 0.527 | -0.0042 (-0.0208; 0.0124) | -0.021 | 0.613 |
| T2 - T0 PSS | 65 | 0.372 (0.048; 0.697) | 0.277 c | 0.025 | 0.350 (0.010; 0.690) | 0.261 c | 0.044 |
| T2 - T0 FNAES | 81 | 0.132 (-0.063; 0.328) | 0.150 | 0.182 | 0.125 (-0.072; 0.321) | 0.141 | 0.209 |
| T2 - T0 RSE | 75 | -0.083 (-0.242; 0.076) | -0.121 | 0.303 | -0.083 (-0.242; 0.076) | -0.121 | 0.300 |
| Eating behaviour | |||||||
| T2 - T0 DEBQ emotional | 81 | 0.011 (-0.015; 0.036) | 0.093 | 0.411 | 0.010 (-0.016; 0.036) | 0.087 | 0.442 |
| T2 - T0 DEBQ external | 82 | 0.012 (-0.007; 0.031) | 0.136 | 0.223 | 0.011 (-0.008; 0.029) | 0.125 | 0.259 |
| T2 - T0 DEBQ restrained | 81 | 0.006 (-0.012; 0.025) | 0.073 | 0.516 | 0.005 (-0.013; 0.022) | 0.055 | 0.613 |
| T2 - T0 EDE-Q total | 59 | 0.069 (0.026; 0.111) | 0.390 e | 0.002 | 0.074 (0.030; 0.118) | 0.423 e | 0.001 |
| T2 - T0 FCQ-T | 61 | 0.641 (-0.008; 10.290) | 0.249 | 0.053 | 0.633 (-0.044; 10.310) | 0.246 | 0.066 |
| Physical activity | |||||||
| T0 - T2 IPAQ | 52 | -950.738(-2780.592; 870.117) | -0.147 | 0.298 | -850.855 (-2670.481; 950.772) | -0.132 | 0.347 |
| Nutritional data | |||||||
| T2 - T0 total energy (kcal) | 57 | -30.308 (-300.454; 230.837) | -0.033 | 0.808 | -20.666 (-300.159; 240.827) | -0.027 | 0.847 |
| T2 - T0 protein (en%) | 57 | -0.060 (-0.261; 0.142) | -0.080 | 0.554 | -0.063 (-0.268; 0.142) | -0.084 | 0.540 |
| T2 - T0 total fat (en%) | 57 | 0.018 (-0.349; 0.386) | 0.014 | 0.920 | 0.011 (-0.362; 0.385) | 0.008 | 0.952 |
| T2 - T0 saturated fat (en%) | 57 | 0.005 (-0.163; 0.173) | 0.009 | 0.950 | -0.001 (-0.171; 0.168) | -0.002 | 0.987 |
| T2 - T0 total carbohydrates (en%) | 57 | 0.104 (-0.247; 0.454) | 0.080 | 0.555 | 0.111 (-0.244; 0.466) | 0.085 | 0.533 |
| T2 - T0 total mono- and disaccharides (en%) | 57 | -0.042 (-0.459; 0.375) | -0.027 | 0.841 | -0.049 (-0.470; 0.373) | -0.032 | 0.818 |
| T2 - T0 fibre % of kcal | 57 | -0.172 (-0.341; -0.003) | -0.265 c | 0.047 | -0.179 (-0.349; -0.009) | -0.276 c | 0.039 |
Associations of Weight Loss with Changes in Physiological and Psychological Health Outcomes
Most changes in immune parameters were not associated with weight loss. After adjustments for age and sex, only decreases in IL-1ra correlated significantly (P < 0.010). However, the association between weight loss and decreases in sIL-.2R was significant before adjustment (P < 0.05) and almost reached significance in the model adjusted for sex and age (P = 0.059).
Similarly, changes in most psychobehavioural health parameters occurred rather independently of weight loss (Table 4). Regarding psychological outcomes, only greater increases in IWQoL-Lite total scores and greater decreases in PSS total scores were significantly associated with greater weight loss before and after correction for sex and age (all P < 0.05). Among measures of eating psychopathology, only greater decreases in EDE-Q total scores correlated with greater weight loss (P < 0.01), although there was a similar trend for FCQT (P = 0.066). Regarding nutritional intake, only greater increases in fiber intake were associated with greater decreases in body weight (P < 0.05). We did not find a significant association between weight loss with changes in physical activity.
5. Discussion
This study provides a comprehensive overview of the physiological, psychological, and behavioral improvements in individuals with obesity after a 1.5-year CLI with CBT in a real-life outpatient setting. Our results demonstrate the systemic benefits of multidisciplinary obesity treatment and the need for a comprehensive approach to assessing treatment effects. We found favorable and long-lasting changes in anthropometrics, body composition, metabolic, endocrine, and immune parameters, HRQoL, psychological well-being, and behavioral outcomes. Notably, most improvements in psychological well-being and behavioral outcomes occurred independently of successful weight loss.
Current European and American guidelines for obesity management recommend a three-component lifestyle intervention, including diet, exercise, and behavioral therapy (11, 15). Previous research has shown that behavioral treatment strategies significantly improve treatment adherence through higher session attendance, physical activity, lower attrition rates, and higher self-monitoring (43). With a dropout rate of 22.6%, attrition was relatively low in our study compared to 35 - 80% reported in the literature (44). Despite a relatively high BMI, a high percentage of females, and a relatively young population, all known predictors of low treatment adherence (45).
Participants in our study had a weight loss of 5.15%. With an average BMI of 37.9 kg/m2 at the end of the CLI, most participants were still classified as having obesity. At face value, this might seem like an unsatisfactory outcome, and defining treatment success after a weight loss program is a contentious issue. Previous studies, however, show significant improvements in physical health parameters at a weight loss of ≥ 5% of total body weight (46, 47), which is also seen in our study. We saw improved glycaemic parameters, such as decreased insulin resistance and lower HbA1c. The improvements in lipid levels and decreased liver enzyme concentrations suggest less hepatic steatosis. Notably, most individuals had liver enzyme concentrations, HbA1c, and lipid levels within the normal range at all times. The decreased prevalence of metabolic syndrome from 66% to 57% underlines these cardiometabolic improvements. In this context, it is remarkable that we also saw improvements in various immune parameters, particularly sIL-2R, VEGF, IL-1ra, and sMR (but also in sCD163, CCL19, and MCP1, although not statistically significant). Obesity is associated with chronic low-grade inflammation, which, in turn, has been implicated in the development of cardiometabolic comorbidities such as type 2 diabetes and many obesity-related diseases, such as osteoarthritis, several forms of cancer, asthma, non-alcoholic fatty liver disease, infertility, severe infections, depression and anxiety (4, 48-50). Thus, the observed decreases in inflammation markers can be expected to have favorable effects on cardiometabolic health and multiple diseases. Additionally, we saw increased testosterone levels in males, indicating at least a partial reversal of hypogonadism, even though free testosterone was not significantly altered.
Another major focus of the CLI was promoting adherence through implementing a balanced and healthy diet and preventing weight gain via improved long-term behavioral changes. Previously, the PREDIMED trial showed that adherence to a healthy diet without energy restriction successfully reduces cardiovascular morbidity, even without achieving any weight loss (51). Thus, a healthy diet, as recommended by the Dutch Health Council (41) without a specific focus on calorie restriction, may be a good alternative to low- or very-low-calorie diets in ameliorating cardiovascular risk and maintaining favorable body composition. This is underlined by our study’s 10% reduction in fat mass without significant loss of fat-free mass. Interestingly, although our patients were not instructed to follow a hypocaloric diet, the total caloric intake was decreased (Table 3.). Possibly, this could be due to increased satiety in response to a higher intake of healthy (unprocessed) foods (52).
As participants of the CLI undergo CBT, the focus on psychological well-being is an important component of the intervention. Indeed, we observed a wide range of improvements in psychological health outcomes after 1.5 years of treatment. Using the IWQoL questionnaire, we observed increased weight-related HRQoL, which can be clinically meaningful based on previous findings (53). In addition, there was a significant increase in self-esteem, as measured both in the obesity-specific IWQoL-Lite and the generic RSE questionnaire, indicating that both tools are suited to capture relevant changes in self-esteem in our study population. Participants also reported lower perceived stress after the CLI and lower fear of negative appearance. Moreover, both HADS total and depression scores, as well as SCL-90 scores (total, obsessive-compulsive, hostility, and paranoid), were significantly decreased, indicating less psychopathological symptomatology. While patients’ baseline HADS subscale scores for anxiety were comparable to scores from the general adult population, depression subscale scores were higher (54). This may explain the lack of a statistically significant decrease in the anxiety subscale in response to the CLI. The relationship between psychiatric disorders, stress, and obesity has been well-documented, and literature suggests that this relation is bidirectional (8). Individuals with obesity have a higher risk of psychopathology and report lower HRQoL (8, 9, 55), indicating the need for a psychological component in lifestyle intervention programs, which we see confirmed in our study results.
Another treatment goal was to accomplish lasting behavioral changes, including decreases in problematic (over-)eating, improved dietary intake, and, in trend, increased physical activity. Specifically, participants reported less emotional and external eating behavior, indicating fewer tendencies towards hedonic overeating. In line with previous studies in patients with obesity (5, 35), we saw higher scores for pathological eating in our patient group compared to healthy populations at baseline, evident, e.g., as higher emotional, external eating, and EDE-Q total scores. In response to the CLI, eating behavior improved towards normal levels yet did not reach levels of healthy populations.
Lastly, for dietary improvements, the total daily proportion of energy intake comprised of saturated fat decreased while dietary fiber consumption increased; both are associated with favorable cardiometabolic changes and lower mortality risk (56, 57). Altogether, our results indicate that at the end of the CLI, patients reported fewer features associated with psychopathological eating and a healthier dietary pattern.
As expected, and in line with previous evidence (47), most improvements in metabolic parameters were related to weight loss. Interestingly, we did not see such associations for most changes in immunologic parameters, psychologic health, eating behavior, and physical activity. Only improvements in IL-1ra, IWQoL-Lite, and PSS scores correlated with more weight loss. The results suggest that immunological and psychological improvements occurred rather independently of weight loss and might be a consequence of the intervention’s exercise, CBT, or dietary components. Unhealthy dietary composition and a sedentary lifestyle have been implicated in adverse immunological and psychological changes (8, 58). For example, a high dietary intake of (saturated) fatty acids is associated with the risk of depression and higher levels of pro-inflammatory markers, whereas a high dietary fiber intake is associated with lower inflammation and a lower risk of depression (59, 60). Furthermore, we see associations of improvements in psychological parameters and HRQoL with decreases in fat mass but not lean mass (Mohseni, Kuckuck, et al., unpublished data). This suggests that beneficial changes in body composition rather than the amount of weight loss could explain the aforementioned improvements. Previous evidence suggests that the association between depression and change in abdominal visceral fat might be stronger than that with a change in overall obesity. This might be linked to the fact that abdominal obesity, characterized by visceral fat accumulation, is more strongly associated with metabolic dysregulation (8). Nevertheless, we cannot measure the extent to which the CBT sessions of our intervention have influenced this association in our analysis. Future studies should investigate the exact mechanisms behind the observed improvements, such as potential endocrine or inflammatory changes known to accompany fat mass loss.
We consider the comprehensive three-component protocol as a strength of our current study, along with the large sample size and the long duration of follow-up. The low attrition rate in our study suggests the achievement of our goal to implement long-lasting lifestyle changes, which could be adhered to easily. However, we acknowledge that there are some limitations to our study. The selection of a cohort with severe obesity but the ability to participate in group therapy and the inclusion of a rather homogeneous group of mostly females of Caucasian ethnicity may limit the generalizability of our findings. In addition, we did not include a control group. Moreover, rather low numbers of available data for some parameters may have limited the statistical power of the respective analyses. Here, we also want to point out that with our descriptive analysis, we can show associations, but not causality, between changes in parameters. Finally, although we understand the multidisciplinary approach as a clinical benefit of our intervention, the complex interplay of the three different components (diet, exercise, and CBT) may have made it hard to trace individual associations with weight loss using linear regressions. Future studies should replicate our findings in larger cohort studies and investigate the associations of weight loss with other health outcomes across interventions.
5.1. Conclusions
In conclusion, we show that the value of a multidisciplinary treatment approach for patients with obesity lies in successful weight loss and improvements in body composition and the wide range of improvements in cardiometabolic and immunologic parameters, as well as psychological, dietary, and behavioral improvements. Lifestyle intervention programs for weight loss therapy often only consider classical outcome measures for obesity, such as cardiovascular disease and diabetes. However, our study underlines the need for a more comprehensive outcome evaluation, including mental and physical parameters. Although metabolic improvements were related to weight loss, this does not necessarily hold for immunological, behavioral, and psychological improvements. In future lifestyle programs for patients with obesity, it seems valuable to monitor multiple mental and physical health parameters beyond weight loss to enable an integrated evaluation of treatment efficacy.
