Phenotypic (subgroup) analysis using AES criteria: for the present study, based on the AES criteria, we had only two subgroups, the IM+HA+PCO group (n = 181, 89%), and the HA+PCO subgroup (n = 23, 11%), and no IM+HA subgroup.
The age range was 17 to 35 years for both patients and controls. The mean age of attaining menarche in PCOS patients was 13.03 + 1.25 years, and for controls was 14 + 1.5 years. The mean age of women in the control group (28 + 5.25) was similar to the mean age of PCOS subgroups. The mean BMI, WC, HC, W/H of PCOS subgroups were significantly higher (P < 0.0001) than the controls. Among PCOS subgroups, IM+HA+PCO showed more BMI, WC, HC, but the W/H was similar in the PCOS subgroups.
Central obesity: WC > 75 cm and W/H ratio > 0.85 cm indicates central obesity (
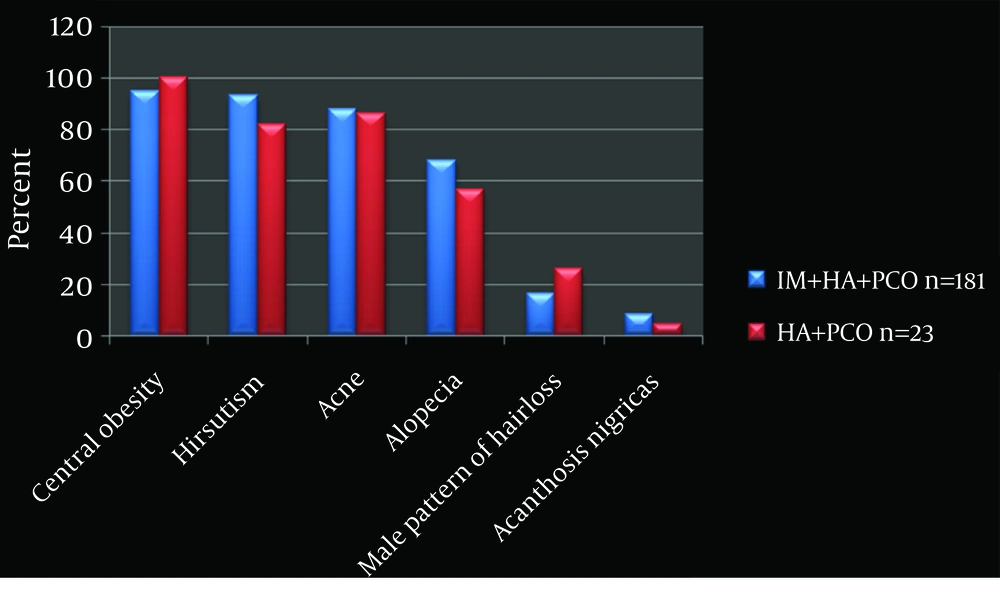
12). The IM+HA+PCO subgroup showed 95% (n = 172) and HA+PCO 100% central obesity.
Irregular Menstruation (IM): In the IM+HA+PCO subgroup (n = 181, 89%), irregular menstruation was observed in all. The HA+PCO subgroup (n = 23, 1 1%) had regular menstrual cycles (
Figure 1).
IM, Irregular Menstruation; HA, Hyperandrogenism; PCO, Polycystic Ovary; n, number
Metabolic syndrome in PCOS subgroups: based on the definitions of MetS (NCEP, ATP-III, and IDF), 26% [N = 53, IM+HA+PCO (n = 50), and HA+PCO (n = 3)] fulfilled the criteria (
Table 1).
Personal history: in the IM+HA+PCO subgroup, 17 cases of HTN, 20 cases of DM and 2 cases of CAD were noted. In the HA+PCO subgroup, 3 cases of HTN and 2 cases of DM were noted.
| Sample, No. | Parameter | Obese PCOS | Lean PCOS | Controls | P Values a |
|---|
| 1b | BMI c, kg/mL | 29.30 + 4.22 | 22.00 + 1.70 | 23.40+ 3.20 | < 0.0001 |
| 2b | W/H | 0.94 + 0.04 | 0.90 + 0.03 | 0.79 + 0.05 | < 0.0001 |
| 3b | F Glucose, mg/dL | 89.00 + 12.67 | 85.80+9.48 | 86.85 + 7.10 | 0.0470 |
| 4b | F Insulin, µU/mL | 14.20 + 13.50 | 13.40 + 12.00 | 6.60 + 3.19 | < 0.0001 |
| 5b | HOMA score | 3.10 + 2.93 | 2.79 + 2.33 | 1.44 + 0.75 | < 0.0001 |
| 6 | TSH, mIU/mL | 2.20 + 1.20 | 2.60 + 1.48 | 3.20 + 7.60 | 0.2338 |
| 7b | LH, mIU/mL | 12.00 + 5.76 | 11.36 + 6.31 | 7.90 + 5.46 | < 0.0001 |
| 8b | FSH, mIU/mL | 5.26 + 1.80 | 5.80 +2.19 | 6.47 + 3.16 | 0.0001 |
| 9b | LH/FSH | 2.40 + 1.00 | 2.10 + 1.44 | 1.50 + 1.20 | < 0.0001 |
| 10 | Chol, mg/dL | 165.00 +31.00 | 160.00 + 29.00 | 162.70 + 33.00 | 0.5243 |
| 11b | HDL, mg/dL | 41.00+ 9.80 | 39.00 + 8.50 | 45 + 13.40 | 0.0002 |
| 12b | TG, mg/dL | 118.00+39.28 | 117 + 32 | 97 + 49 | < 0.0001 |
aANOVA one way analysis –posttest if P value < 0.05
bP values are significant
cAbbreviations: BMI, Body mass index; W/H, waist/hip Fasting glucose and fasting insulin, TSH, Thyroid stimulating hormone; LH, Luteinizing hormone; FSH, Follicular stimulating hormone; HOMA score, Homeostatic model assessment score; Chol, cholesterol; HDL, high density lipoprotein; TG, Triglycerides; LDL, Low density lipoprotein; VLDL, very low density lipoprotein
Hyperandrogenism (HA): the IM+HA+PCO subgroup showed more hirsutism (93%) compared to the HA+PCO subgroup, (82%). Acne, alopecia, male pattern of hair loss and acanthosis nigricans were seen more in the IM+HA+PCO subgroup (88%, 68%, 16.5%, and 8.25%), compared to the HA+PCO subgroup (86%, 56.5%, 26%, and 4.3%) (
Figure 1).
Polycystic ovary (PCO): all the PCOS patients had undergone baseline ultrasound scanning (transvaginal-196, transabdominal-8). In the IM+HA+PCO subgroup, 84.5% (n = 153) showed bilateral PCO, and 15.5% (n = 28) unilateral PCO. In the HA +PCO subgroup, 82% (n = 19) showed bilateral PCO and 18% (n = 4) unilateral PCO.
Infertility: of the 204 patients, eight were unmarried. In the remaining 196 patients, the IM+HA+PCO subgroup showed, 80% primary infertility, and 15.5% secondary infertility. The HA+PCO subgroup showed 82% primary infertility, and 18% secondary infertility.
Biochemical Parameters: the hormonal and metabolic features of PCOS subgroups were compared with the controls (
Table 2). The HA+PCO subgroup showed more LH, FSH, fasting glucose, fasting insulin, HOMA score, and HDL compared to the IM+HA+PCO subgroup. Significant P value of LH, LH/FSH, fasting insulin, HOMA score, HDL, TG, and VLDL was noted, between the PCOS subgroups and controls.
| Sample, No. | Parameter | HA+PCO+IMC (n=181) a | HA+PCO (n=23)a | Controls (n = 204) a | P value b (PCOS Subgroups vs. Control) |
|---|
| 1 | Age, y | 28.27 + 3.70 | 27.91 + 1.00 | 28.00 + 5.25 | 0.8631 |
| 2 c | BMI d, kg/m2 | 27.25 + 5.02 | 26.00 + 4.10 | 23.40 + 3.20 | < 0.0001 |
| 3 c | WC, cm | 37.10 + 4.28 | 35.30 + 4.18 | 30.36 + 3.30 | < 0.0001 |
| 4 c | HC, cm | 39.60 + 4.04 | 37.40 + 4.50 | 38.11 + 3.70 | < 0.0001 |
| 5 c | WHR | 0.93 + 0.04 | 0.94 + 0.036 | 0.79 + 0.50 | < 0.0001 |
| 6 | TSH, mIU/mL | 2.33 + 1.29 | 2.50 + 1.05 | 3.20 + 7.60 | 0.1664 |
| 7 c | LH, mIU/mL | 11.83 + 6.18 | 13.09 + 5.20 | 7.90 + 5.46 | < 0.0001 |
| 8 | FSH, mIU/mL | 5.30 + 1.98 | 6.29 + 2.25 | 6.47 + 3.16 | 0.4864 |
| 9 c | LH/FSH | 2.41 + 1.35 | 2.16 + 0.67 | 1.50 + 1.20 | < 0.0001 |
| 10 | Fasting glucose, mg/dL | 87.83 + 10.84 | 91.80 + 14.86 | 86.85 + 7.10 | 0.1574 |
| 11 c | Fasting insulin, µU/mL | 16.40 + 17.10 | 21.10 + 17.90 | 6.66 + 3.19 | < 0.0001 |
| 12 c | HOMA Score | 3.80 + 3.59 | 4.80 + 4.00 | 1.44 + 0.75 | < 0.0001 |
| 13 | Chol, mg/dL | 162.00 + 29.82 | 151.50 + 31.00 | 162.70 + 33.00 | 0.2620 |
| 14 c | HDL, mg/dL | 40.00 + 10.37 | 41.37 + 8.90 | 45.00 + 13.40 | 0.0002 |
| 15 c | TG, mg/dL | 128.82 + 45.00 | 105.00 + 35.60 | 97 + 49 | < 0.0001 |
| 16 | LDL, mg/dL | 97.60 + 29.83 | 88.70 + 30.50 | 96.99 + 32.24 | 0.4233 |
| 17 c | VLDL, mg/dL | 25.45 + 8.79 | 21 + 7 | 20.82 + 11.79 | 0.0403 |
aData are shown as mean ± SD
bP values were evaluated by one–way ANOVA with post test
cSignificant values (P is < 0.05)
dAbbreviations: HA, hyperandrogenism; PCO, polycystic ovary; IM, Irregular menstruation
Family history of metabolic diseases: there were 75 patients with more than one affected family member. In the IM+HA+PCO subgroup, family history of DM (n = 42, 23%), HTN (n = 14, 8%), CAD (n = 7, 4%), DM+HTN+CAD (n = 42, 23%), DM+HTN (n = 36, 20%), DM+CAD (n = 4, 2%) and HTN+CAD (n = 2, 1%) were noted. In the HA+PCO subgroup, family history of DM (n = 8, 35%), HTN (n = 1, 4%), DM+HTN+CAD (n = 4, 17%) and DM+HTN (n = 5, 22%) were noted.
Family history of PCOD, late conception, infertility, and irregular menstrual cycles: in the IM+HA+PCO subgroup, 20 cases of PCOD, 71 cases of late conceiving, 20 cases of infertility, and 41 cases of irregular menstrual cycles were noted. In the HA+PCO subgroup, 3 cases each of PCOD, late conceiving and 2 each of infertility and irregular menstrual cycles were noted.
Anthropometric, biochemical differences betweenobese and lean PCOS: for this study, we had 141 (69%) cases of obese PCOS and 63 (31%) of lean PCOS. When the means were compared among these subgroups and controls, obese PCOS showed higher BMI, W/H, fasting insulin, HOMA score, LH, LH/FSH, HDL and TG, which were significant (P < 0.05) (
Table 3).
| Parameters | IM+HA+PCO (n = 181) | HA+PCO (n = 23) | Controls (n = 204) |
|---|
| WC a≥ 88 cm/ ≥ 80 cm | 94/145 | 08/17 | 08/45 |
| TG ≥ 1.7 mmol/L (150 mg/dL) | 50 | 03 | 20 |
| HDL ≤ 1.3 mmol/L (50 mg/dL) | 163 | 21 | 160 |
| BP ≥ 130/85 mmHg | 18 | 04 | - |
| FB glucose > 6.1 mmol/L (101 mg/dL) | 15 | 02 | - |
| No of subjects fulfilling the criteria | 50 (28%) | 03 (13%) | 08 (4%)/20 (10%) |
aAbbreviations: MetS, Metabolic Syndrome; PCOS, Polycystic Ovarian Syndrome; NCEP ATP III, National Cholesterol Education Program Adult Treatment Plan III; IDF, International Diabetes Federation; IM, Irregular Menstruation; HA, Hyperandrogenism; PCO, Polycystic Ovary; WC, Waist Circumference; TG, Triglycerides; HDL, High Density Lipoprotein; FBG, Fasting Blood Glucose.