1. Background
Nowadays one of the important causes of deaths around the world is cancer (1). According to the world cancer report 2014, thyroid cancer (TC) is one of the less frequent cancers around the world (2). However, this cancer is the most common endocrine cancer (3) and in the last 20 years its incidence has increased by more than any other malignancies (4). If this increasing trend continues, TC will become the fourth most common cancer in the United States, up to 2030 (5). Thus, regarding TC, from 1990 to 2013, ASIRs per 100 000 increased by 20% in both genders (6). Though the risk factors for TC have not been determined accurately, some of the factors that contribute to this cancer include exposure to radiation, a diet low in iodine, obesity, and gender (7); therefore, according to the latest global cancer statistics data, TC is the fifth most common cancer among females (3). In the recent years, several studies have shown that there are significant relationships between factors related to lifestyle and the development of TC (8, 9). On the other hand, lifestyle is directly related to socioeconomic status and developmental extent and changing some features of life, such as increasing life expectancy and aging, will lead to change in the pattern of cancers towards cancers caused with life style factors (10, 11).
In the recent years, several studies have examined the relationship between the development, specific conditions, and characteristics of life in different countries and various types of cancers (12-14). One of the indicators that reflects the development of each country and reflects the status and living conditions of different countries is the human development index (HDI) (15). The HDI is defined as the average achievement of three factors, including life expectancy at birth, gross national income per capita, and mean and expected years of schooling. Furthermore, HDI includes four levels of low, medium, high, and very high; where the low HDI level includes countries that are the least developed and the very high HDI level includes the most developed countries (16).
2. Objectives
The current study aimed at determining inequality in incidence and mortality of TC, according to HDI and its components around the world.
3. Methods
This ecological study was performed to estimate the incidence and mortality rate of TC, according HDI components. The three main components of HDI include mean years of schooling, and gross national income (GNI) per capita, and life expectancy at birth.
Age-specific incidence and mortality rate (ASR) is used to obtain TC rates with consideration of standard age structure, therefore, this formula minimizes the influence of age on the risk of outcome in the population. This consideration when comparing outcomes in several populations with different age groups is very important.
Data about the ASR of TC was obtained from the global cancer project for 172 countries in 2012 (17). This study, data were obtained for 169 countries from the United Nations Development Program (UNDP) database (18).
All of the 169 countries had two aspects in the data, including epidemiologic data and HDI. Overall, 169 countries were categorized to four categories including: Countries with very high, high, medium, and low human development index.
3.1. Statistical Analysis
Inequality in the ASR of PC was defined according to the HDI, by using the concentration index. The value of the concentration index ranged from -1 to +1; a negative value indicates that the health variable is more concentrated in the poor population and a positive value indicates greater concentration in the rich population (19).
The concentration index was decomposed to determine selected contributors to inequality in TC, including HDI, mean years of schooling, life expectancy at birth, gross national income per 1000 capita, expected years of schooling, age standardized obesity in adults, and urbanization level (%). In the first step of the decomposition process, the elasticity was calculated by βkXk/μ for the distinct variable to determine the amount of variance that was associated with change in one explanatory variable. In the elasticity formula, X and μ are x1, x2… xk and the mean score of ES, respectively. In the next step, to obtain of absolute contribution, elasticity was multiplied by its CI and in the final step, the percentage of inequality for each contributor was calculated by the (βkXk/μ) Ck formula, where Ck is CI for each specific contributor (20). All P values < 0.05 were regarded as statistically significant. Distributive Analysis Stata Package (DASP) was used for estimating the concentration index. This study used the Stata software version 11.1 (StataCorp, College Station, TX, USA) to estimate rates and analyze inequality.
4. Results
In 2012, there were 298102 new diagnoses (68 179 males and 229 923 females) of TC and 39771 mortality cases (12 626 males and 27 145 females) of TC, according to GLOBOCAN and UNDP. The incidence rates were from 1.3 per 100 000 in low human development countries and 9.9 per 100 000 in very high HDI, respectively, and the mortality rates ranged from 0.9 per 100 000 in low human development countries and 0.3 per 100 000 in very high HDI, respectively. Also, mortality cumulative risk of TC was 0.07 in less developed regions and 0.04 in more developed regions (Table 1).
| Categories | Incidence | Mortality | ||||||
|---|---|---|---|---|---|---|---|---|
| P | Crude Rate | ASR (W) | Cumulative Risk | P | Crude Rate | ASR (W) | Cumulative Risk | |
| World | 298102 | 4.2 | 4.0 | 0.40 | 39771 | 0.6 | 0.5 | 0.06 |
| More developed regions | 122776 | 9.9 | 7.4 | 0.73 | 10393 | 0.8 | 0.4 | 0.04 |
| Less developed regions | 175326 | 3.0 | 3.0 | 0.30 | 29378 | 0.5 | 0.6 | 0.07 |
| Very high HDI | 147319 | 12.8 | 9.9 | 0.95 | 8620 | 0.7 | 0.3 | 0.03 |
| High HDI | 54861 | 5.3 | 4.8 | 0.47 | 8214 | 0.8 | 0.7 | 0.08 |
| Medium HDI | 84613 | 2.4 | 2.2 | 0.21 | 16990 | 0.5 | 0.5 | 0.06 |
| Low HDI | 11188 | 0.9 | 1.3 | 0.14 | 5941 | 0.5 | 0.9 | 0.12 |
Abbreviation: P, population.
a Crude and age-standardized rates (ASR), per 100,000. Cumulative risk [0 - 74], percent.
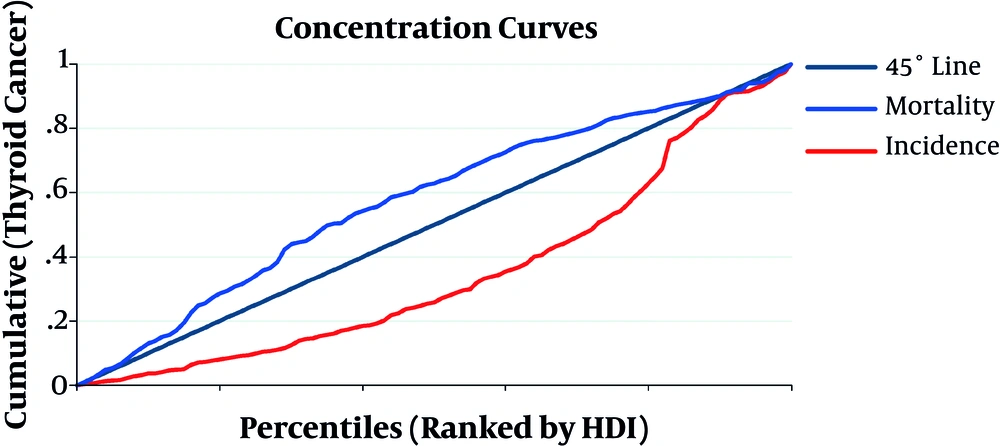
The concentration index for incidence and mortality rates of TC in both genders, according to HDI, was 0.29 (CI 95%: 0.21, 0.38) and -0.15 (CI 95%: -0.23, -0.06), respectively. These results showed that incidence rates of TC were more concentrated in countries with high HDI, yet inequality index showed that deaths occurred more in disadvantaged countries (Figure 1).
The inequality in incidence and mortality of TC for socioeconomic components by gender are shown in Table 2. According to this, regarding incidence rates, HDI had the highest and the age standardized obesity in adults had the lowest inequality scale in both genders. Inequality index for mortality rates of TC, according to HDI and all components, were negative, therefore, this indicated that mortality rates based on HDI and its components were more concentrated in disadvantaged countries.
| Socioeconomic Component | Incidence (95% CI) | Mortality (95% CI) | ||
|---|---|---|---|---|
| Males | Females | Males | Females | |
| HDI | 0.27 (0.20 - 34) | 0.31 (0.22 - 0.39) | - 0.08 ( - 0.17, - 0.01) | - 0.16 ( - 0.25, - 0.07) |
| Life expectancy at birth | 0.27 (0.19 - 35) | 0.31 (0.22 - 0.41) | - 0.07 ( - 0.16, - 0.00) | - 0.13 ( - 0.21, - 0.05) |
| Mean year of schooling | 0.23 (0.16 - 31) | 0.27 (0.19 - 0.36) | - 0. 9 ( - 0.19, - 0.00) | - 0.18 ( - 0.27, - 0.09) |
| Expected years of schooling | 0.25 (0.17 - 33) | 0.29 (0.20 - 0.39) | - 0.08 ( - 0.18, - 0.00) | - 0.18 ( - 0.08, - 0.08) |
| Gross national income per 1000 capita | 0.26 (0.19 - 32) | 0.28 (0.20 - 0.36) | - 0.07 ( - 0.16, - 0.01) | - 0.16 ( - 0.26, - 0.06) |
| Age standardized obesity in adults | 0.11 (0.01 - 20) | 0.15 (0.02 - 0.28) | - 0.04 ( - 0.14,0.05) | - 0.01 ( - 0.12,0.08) |
| Urbanization level (%) | 0.21 (0.13 - 28) | 0.26 (0.17 - 0.35) | - 0.10 ( - 0.19, - 0.0) | - 0.17 ( - 0.28, - 0.06) |
Abbreviations: CI, confidence interval; CIs, concentration indexes; HDI, human development index.
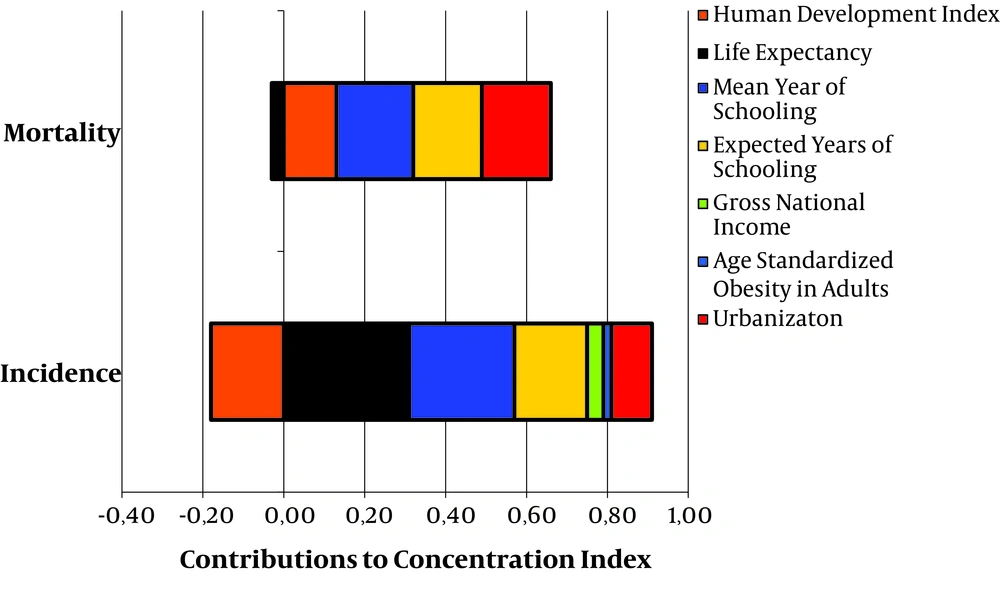
The inequality index was decomposed to determine important contributors to incidence and mortality of TC. As shown in Table 3 and Figure 2, important contributors in inequality for incidence rates of TC were life expectancy at birth (0.30), mean years of schooling (0.26), expected years of schooling (0.18), and urbanization (0.10). The important contributors in inequality of mortality rates were mean years of schooling (0.19), expected years of schooling (0.17), urbanization (0.17), and HDI (0.13).
| Socioeconomic Component | Incidence of Thyroid Cancer | Mortality of Thyroid Cancer | ||||||
|---|---|---|---|---|---|---|---|---|
| Elasticitya | Concentration Index | Contribution | Elasticity | Concentration Index | Contribution | |||
| Absolute | Percent | Absolute | Percent | |||||
| HDI | -2.42 | 0.29 | -0.0021 | -0.18 | -0.99 | -0.15 | 0.0056 | 0.13 |
| Life expectancy at birth | 3.89 | 0.30 | 0.0145 | 0.31 | 3.37 | -0.12 | -0.0001 | -0.01 |
| Mean year of schooling | 1.07 | 0.24 | 0.0097 | 0.26 | -0.71 | -0.16 | 0.0081 | 0.19 |
| Expected years of schooling | 1.30 | 0.28 | 0.088 | 0.18 | -1.12 | -0.16 | 0.0078 | 0.17 |
| Gross national income per 1000 capita | 0.08 | 0.27 | 0.0009 | 0.04 | 0.07 | -0.15 | -0.0001 | -0.01 |
| Age standardized obesity in adults | -0.41 | 0.14 | 0.0005 | 0.02 | 0.41 | -0.04 | -0.0001 | -0.01 |
| Urbanization level (%) | 0.38 | 0.24 | 0.0012 | 0.10 | -0.67 | -0.16 | 0.0077 | 0.17 |
| Residual | - | 0.0137 | 0.29 | - | 0.0123 | 0.37 | ||
| Total | - | 1.00 | - | 1.00 | ||||
a Elasticity; to determine the amount of variance that associated to change in one explanatory variable.
5. Discussion
The results of this study showed that in 2012, 298 102 new cases of TC were detected around the world. However, the percentages of detected cases for females was greater than that of males (77.1% versus 29.9%), and consequently the mortality rate in females was 2.5 times higher than males. This finding is intended to confirm the female gender role as one of the risk factors for TC, which has been proven by many studies (3, 21). This huge difference between genders is due to hormonal and reproductive factors in females, especially when females are fertilized and then postmenopausal. Female hormones, especially estrogen, is likely to play an important role in cancer occurrence, yet the mechanism for creating it needs to be further explored (22). As the results show, the incidence of cancer in areas with very high and high levels of HDI is considerably higher than in other areas, and in fact, mortality rate in developed regions is lower than less developed regions. Similar results have been obtained in studies that examined the role of socioeconomic status in the detection and incidence of TC (23, 24). The difference in incidence rates in developed and less developed regions may be due to better medical and diagnostic facilities, such as thyroid ultrasonography in developed regions, and greater access to these facilities. Also, due to the availability of more effective medical facilities and treatments in developed regions and experienced and capable medical team in these areas, the treatment process for people with this type of cancer is better. Furthermore, due to improved diagnosis, management, and treatment of the disease, survival is in fact extremely good; as a result, mortality rates in developed regions are lower compared to underdeveloped areas.
Based on the results of this study, the impact and relevance of the main components of HDI, including life expectancy at birth, gross national income per capita, mean and expected years of schooling and level of urbanization, as well as its auxiliary elements, including age standardized obesity in adults, in the incidence of TC and its mortality is different, both in general and in terms of gender. Therefore, life expectancy clearly affects the incidence of cancer in both genders. In countries where life expectancy is high, people are expected to live longer, and consequently, this increases the likelihood of their exposure to cancer risk factors (25). Evidence shows that exposure to radiation as the potential risk factor of TC can be increased by increasing life expectancy (7); following this, the mortality rate will also increase. Following the increase in mean years of schooling, the level of literacy of individuals and, consequently, their level of health literacy increases; this tends to make people more sensitive to their health and more likely to participate in health programs related to screening and diagnosis of cancer. Therefore, it can lead to early detection in these individuals and, as a result, increase the incidence of cancer in literate individuals. In order to explain this finding, there are other points that can be mentioned. The high sensitivity of educated people to their health and various examinations and interventions to diagnose possible diseases, such as head and neck CT scan, dental X-rays, etc., are exposing them to one of the most important risk factors for TC, namely radiation (4). In less developed countries, there is a special situation. Thus, over the past two decades, there has been widespread reform of educational policies in these countries to increase mean years of schooling (26). Mean years of schooling is one of the components of HDI and is not considered as an indicator of development alone. On the other hand, suitable medical equipment, medicines, and medical facilities, as well as effective therapeutic processes, can reduce TC mortality rate. These mentioned items are not available in less-developed countries. Therefore, despite the high levels of education in many of these countries, a high mortality rate can be observed due to TC. Literate individuals, in developed countries, are expected to go through the treatment process more precisely and act more effectively on second-level preventive education to treat the disease. This trend will help them survive and reduce the mortality rate due to TC in developed regions.
Level of income is also associated with incidence and mortality from TC, so that the increase in income affects the incidence of TC. This finding is consistent with the results of other studies (10, 24). The high income level makes it possible for high-income individuals to easily access diagnostic facilities and participate in health-related issues, thus, increasing the incidence of TC. On the other hand, for high-income people, there is a possibility to use appropriate treatment facilities, which reduces mortality rate from TC. The results of this study indicate that adult obesity is associated with increase in the incidence of TC. This finding is consistent with the results of other studies that described obesity as one of the risk factors for TC (27, 28). The role of obesity and overweightness in the incidence of many cancers has been well-documented (29). Obesity is a health problem that has steadily increased with changes in diet and with populations leading a sedentary lifestyle, which could be one of the consequences of urbanization.
The impact of urbanization on the increase in new cases of TC may be due to the possibility of access to diagnostic facilities, including imaging and ultrasonographic facilities in urban areas. This finding is in line with the results of other studies (24). These findings largely confirm the role of access to diagnostic facilities in the rapid increase in the incidence of TC. On the other hand, urbanization may lead to an increase in the level of education and income and the role of these factors has been expressed by the increasing incidence of TC.
The present study was an ecological study; one of the main problems and constraints of these studies is a phenomenon called “ecological fallacy”. This problem occurs when the results obtained in this study and the observed relationships between the variables are generalized to the individual level. Regarding this, the current study also had this limitation. On the other hand, the quality of reports on incidence and mortality of thyroid cancer in various countries may be different. In some regions, especially in developing countries, these reports may not accurately reflect the actual situation. Therefore, it is suggested for similar studies to be conducted in smaller communities. It is also recommended for future studies to address other possible related causes of TC, such as ethnicity and race.
5.1. Conclusions
According to the findings of this study, global inequalities exist in the TC incidence and mortality rates; incidence rates of TC are more concentrated in countries with high HDI, yet inequality index showed that deaths occurred more in disadvantaged countries.


