


1. Background
Thyroid glands play an important role in the metabolism and growth of the human body by secreting thyroid hormones. Previous studies on thyroid-mediated regulation focused largely on patients with thyroid dysfunctions (1-4). Some studies have shown an association between thyroid hormone levels and body mass index (BMI), although the results are still controversial. In a 2006 study on 361 women and 40 men in the United Kingdom, Manji et al. reported lack of any relationship between either serum thyroid-stimulating hormone (TSH) or free thyroxine (FT4) level and BMI, since no difference was seen in the serum levels of either hormone between lean and obese subjects (5). In contrast, Sakurai et al. showed a significant positive relationship between serum TSH level and BMI among male subjects in a 2014 study on 1,044 men and 993 women in Japan (6). In contrast, Kitahara et al. found that TSH and FT3 were positively associated with BMI, while such an association did not exist for FT4 in neither gender in a study on 1623 men and 1491 women in the USA (7). Meng et al. reported a positive relationship between TSH level and BMI only among women in a study on 13,855 Chinese participants (8,532 men and 5,323 women) (8).
2. Objectives
To address this ambiguity, we collected data from a large euthyroid Chinese population (77,991 individuals aged 20 - 80 years) in an iodine sufficient area and analyzed the relationship between thyroid hormone levels and BMI, age and gender.
3. Methods
3.1. Study Population
In this cross-sectional study, 97,997 individuals were recruited at the health examination center of Sichuan Provincial People’s Hospital from October 2013 to April 2017. Essential demographic data like age, gender, height and weight and biochemical test results of TSH, FT3, FT4, thyroid peroxidase antibodies (TPOAb) and thyroglobulin antibodies (TgAb) were obtained from the patients’ medical records. In addition, body mass index (BMI) was calculated as weight in kilograms divided by height in square meters.
The euthyroid (with no thyroid disorders) participants were identified using the following exclusion criteria: (1) age < 20 years and > 80 years, (2) serum FT4 or FT3 levels not within the reference range (FT4: 9.01 - 19.05 pmol/L and FT3: 2.63 - 5.70 pmol/L), (3) serum TSH levels lower than 0.35 mIU/L or above 4.94 mIU/L (since such patients would have been under medical supervision and more likely to be ill, and (4) positive for thyroid antibodies (TgAb > 75 IU/ml and serum TPOAb > 30 IU/m) to obviate any influence of these antibodies.
The study was approved by the Ethics Committee of Sichuan Provincial People’s Hospital.
3.2. Laboratory Measurements
Standard laboratory quality evaluation procedures were used, and regular participation at inter-laboratory tests was also part of the quality control strategy. Serum TSH, FT3 and FT4 levels were measured by automated chemiluminescent immunoassays (Architect i2000SR; Abbott Laboratories, Chicago, US). The functional sensitivity of serum TSH was 0.0036 mIU/L. The intra-assay coefficients of variation (CV) of serum TSH, FT4, FT3, TPOAb and TgAb were 1.3% - 6.3%, and the inter-assay CV values were 2.0% - 6.6%. Our laboratory reference ranges provided by the manufacturer were as follows: TSH: 0.35 - 4.94 mIU/L, FT4: 9.01 - 19.05 pmol/L, FT3: 2.63 - 5.70 pmol/L, TPOAb < 30 IU/mL and TgAb < 75 IU/mL.
According to BMI, the participants were categorized into four groups, namely underweight with BMI 16 - 18.5 kg/m2, normal weight at 18.5 - 24 kg/m2, overweight at 24 - 28 kg/m2 and obese at 28 - 35 kg/m2. Age groups were categorized using 10-year intervals: 20 as 20 - 29 years old, 30 as 30 - 39 years old, 40 as 40 - 49 years old, 50 as 50 - 59 years old, 60 as 60 - 69 years old and 70 as 70 - 79 years old.
3.3. Statistical Analysis
Continuous variables were tested for normality by Kolmogorov-Smirnov test using histogram and Q-Q plot. Data with normal and nearly normal distributions are presented as mean ± standard deviation (SD), and those with non-normal distributions as median and inter-quartile range (IQR). The 25th and 75th percentiles were used for the definition of reference intervals and the medians. The 25th and 75th percentiles were calculated based on age/BMI groups in both genders. Independent t-test was used for parametric data and Wilcoxon rank sum test for non-parametric data when comparing age, BMI and TSH, FT3 and FT4 levels between men and women. The relationships between thyroid hormones and BMI with age and gender adjustment were generated using smoothing splines in generalized additive models (GAM) (9) by the “mgcv” package (version 1.8 - 24). All the statistical analyses were performed using R software (version 3.4.1) (10). P value less than 0.05 was considered statistically significant.
4. Results
Of the initial 97,997 participants, 12,568 (12.8%) were positive for thyroid antibodies, 9.01% (8,830) had thyroid hormone levels beyond the reference range, 0.4% (397) had BMI outside 16 - 35 kg/m2 and 1.07% (1,054) were not between 20 - 80 years of age, and thus were excluded. The remaining 77,991 participants comprised of 45428 (58.25%) males and 32563 (41.75%) females (Table 1). The TSH and FT3 levels were significantly different between male and female participants (P < 0.05), while there was no difference in FT4 level between the two genders.
| Women | Men | P Value | |
|---|---|---|---|
| Number | 32563 | 45428 | - |
| Age, y | 41 (31 - 50) | 44 (34 - 52) | < 0.001 |
| BMI, kg/m2 | 22.18 ± 3.03 | 24.53 ± 3.09 | < 0.001 |
| TSH, mIU/L | 2.20 (1.57 - 2.99) | 1.89 (1.36 - 2.58) | < 0.001 |
| FT3, pmol/L | 4.43 (4.09 - 4.78) | 4.39 (4.75 - 5.10) | < 0.001 |
| FT4, pmol/L | 12.69 ± 1.35 | 12.69 ± 1.43 | 0.810 |
Characteristics of the Study Population by Gendera
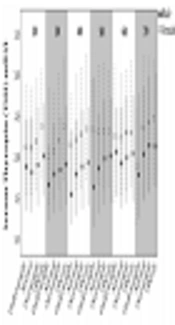
Figure 1 exhibits the percentiles (median, 25th and 75th) of TSH, FT3 and FT4 in the different BMI groups and age categories among male and female subjects. The median TSH levels were obviously higher in female participants compared to males in each age group (P < 0.05). The median FT3 levels were higher in males than in females before 60 years of age. However, the median FT4 levels showed no apparent difference between the two genders (Appendix 1 - 3 in Supplementary File).
, FT3 (pmol/L), FT4 (pmol/L) in age-BMI groups. Underweight: BMI within 16 - 18.5 kg/m<sup>2</sup>; normal: BMI within 18.5 to 24 kg/m<sup>2</sup>; overweight: BMI within 24 - 28 kg/m<sup>2</sup>; obesity: BMI within 28 - 35 kg/m<sup>2</sup>. The triangle and dashed line indicated female and square and solid line indicated male.")
25th, median, 75th Centiles of TSH (mIU/L), FT3 (pmol/L), FT4 (pmol/L) in age-BMI groups. Underweight: BMI within 16 - 18.5 kg/m2; normal: BMI within 18.5 to 24 kg/m2; overweight: BMI within 24 - 28 kg/m2; obesity: BMI within 28 - 35 kg/m2. The triangle and dashed line indicated female and square and solid line indicated male.
Figure 2 and Table 2 present the relationships of TSH, FT3 and FT4 hormones with BMI before and after adjusting for age and gender by GAM analysis. The smoothing spline suggested a non-linear relationship between TSH level and BMI (Figure 2A, e.d.f = 2.804, P < 0.001), with the TSH increasing after the inflection point of 25 kg/m2. After adjusting for age and gender, TSH showed a quadratic correlation with BMI (Figure 2B, e.d.f = 1.705, P < 0.001). FT3 and BMI had a positive relationship after the inflection point of 20 kg/m2 without adjustment (Figure 2C, e.d.f = 6.118, P < 0.001). After age and gender adjustment, the relationship between FT3 and BMI was altered dramatically (Figure 2D, e.d.f = 2.887, P < 0.001). Regardless of age and gender adjustment, FT4 and BMI showed a significant non-linear relationship (Figure 2E, e.d.f = 6.049, P < 0.001, Figure 2F, e.d.f = 6.030, P < 0.001).
| TSH | FT3 | FT4 | ||||
|---|---|---|---|---|---|---|
| Mod0 | Mod1 | Mod0 | Mod1 | Mod0 | Mod1 | |
| e.d.f | 2.804 | 1.705 | 6.118 | 2.887 | 6.049 | 6.030 |
| P | 0.009 | < 0.001 | < 0.001 | < 0.001 | 0.010 | < 0.001 |
 and thyroid hormones. A, relationship of TSH and BMI without adjustment; B, relationship of TSH and BMI with adjustment for age and sex; C, relationship of FT3 and BMI without adjustment; D, relationship of FT3 and BMI with adjustment for age and sex; E, relationship of FT4 and BMI without adjustment; F, relationship of FT4 and BMI with adjustment for age and sex. The shaded area of the trends are the 95% confidence intervals (95%CI) of the fitted smoothing splines.")
GAM assess the shape of relatioships between BMI (kg/m2) and thyroid hormones. A, relationship of TSH and BMI without adjustment; B, relationship of TSH and BMI with adjustment for age and sex; C, relationship of FT3 and BMI without adjustment; D, relationship of FT3 and BMI with adjustment for age and sex; E, relationship of FT4 and BMI without adjustment; F, relationship of FT4 and BMI with adjustment for age and sex. The shaded area of the trends are the 95% confidence intervals (95%CI) of the fitted smoothing splines.
5. Discussion
Our study aimed to determine the association of TSH, FT3 and FT4 with BMI in a large Chinese population. GAM revealed that after adjusting for age and gender, significant changes were seen pertaining to the relationship of TSH and FT3 with BMI, but not regarding FT4.
Several previous studies have investigated the relationship between TSH and BMI influenced by age and gender. In agreement with our findings, Svare et al. found a positive association between BMI and TSH in 9,954 women, but the association was slightly weaker in 5,066 men (11), Sakurai et al. found a significant relationship between TSH level and BMI exclusively in men (6), these studies indicated that sex could modify the association of BMI and TSH. However, Manji et al. found no evidence for the association between TSH and BMI using Spearman’s rank correlation coefficient and the results were identical for 40 euthyroid men and 361 euthyroid women (5). In that study, the number of subjects was quite small and limiting the ability to detect any association.
For the relationship of serum FT3 level and BMI, Kitahara et al. performed a study of 1,623 euthyroid men and 1,491 euthyroid women and found that BMI was positively associated with FT3 level but not with FT4 level (12). Moreover, they reported an increase in FT3 level with every one-quartile increase in BMI in men (1.0%) and women (1.3%), after adjusting for age and other factors. In our study, FT3 had an rising trend with increasing BMI in men and women, which was consistent with Kitahara et al. findings.
As it is well known, TSH is secreted in response to feedback from circulating thyroid hormone, thyroid hormone regulates body weight balance and body fat mass after its activation from the T4 to the active form T3 (13). A higher TSH concentration may be the result of a lower thyroid function (14), which may lead to a lower basal metabolic rate and obesity (15). However, other studies found that thyroid function and obesity may affect each other, such that adipose tissue secretes leptin, which contributes to the alterations in the secretion of thyrotropin-releasing hormone (TRH) and affects the secretion of TSH (16). Thus, future biomedical studies are needed to assess the relationship between thyroid system and obesity. Walrand et al. found FT3 increased energy expenditure in both young and the old rats, but old rats lost more weight than young ones (17). Ortega et al. found FT3 was associated with absolute and annual percentage of changes in weight (r = -0.27, P = 0.02) in 89 euthyroid Indians, and the association remained significant (r = -0.28, P = 0.009) after adjusting for age and gender (18). These findings were consistent with our results regarding the fact that the relationships of TSH and FT3 with BMI were influenced by gender and age.
The limitation of this study was that smoking status, ethnicity, alcohol intake, dietary habits, education, physical activity, menopause, insulin, which could modify the relationship between thyroid function and BMI, were not considered (7, 11, 12, 19-21). Compared to previous studies, our study was stronger on account of the large cohort of participants, which enabled us to determine the association between thyroid hormones and BMI relative to age and gender. In addition, GAM is a flexible and effective method to determine the nature of such relationships.
In conclusion, our findings suggested that TSH and FT3 had a positive non-linear relationship with BMI and their relationships remained strong after adjustment for age and gender. However, the non-linear negative relationship between FT4 and BMI was slightly effected by age and gender.
