


1. Context
Obesity is known as an epidemic in the 21st century (1-3). It is an important risk factor for chronic disease such as cardiovascular disease, hypertension, cancer, diabetes mellitus, and gallbladder disease (4-8). In 2016, more than 1.9 billion adults, 18 years and older, were overweight. Of these, over 650 million were obese (9). Considering the increasing rate of obesity prevalence in Iran (10-13) we need accurate data to design programs for preventive and treatment of obesity and determine relevant health policies to prevent health risks (14). Obesity is substantially unequal in various regions in Iran that are influenced by socio-economic status and demographic factors such as age, gender, difference in living classes, education, occupation, and marital status (15). There are several studies in many provinces of Iran that assess the association of obesity and related risk factors and report the prevalence of obesity among adults. However, there is the heterogeneity among these studies due to different culture, lifestyle, and socio-economic status (16-18). To account for this heterogeneity among studies and to achieve the greater precision we need to conduct a meta-analysis. Meta-analysis is a statistical procedure of synthesizing the available evidences from multiple studies. The marginal beta-binomial is a new statistical method for meta-analysis that is more robust in comparison with existing models such as bivariate generalized linear mixed model and the Sarmanov beta-binomial model (19). This model, based on the composite likelihood approach, has several attractive features (18).
2. Objectives
The aim of this study is the estimation of overall obesity odds ratio (OR) in Iranian adults with particular attention to age, gender, place of residence, and smoking status using the marginal beta-binomial model.
3. Data Sources
3.1. Search Strategy
To identify the published literatures between 1990 - 2017 that assessed the obesity and related risk factors in Iranian adults, we systematically reviewed several national electronic databases including: SID (Scientific Information Database), Iran-Medex, and IranDoc. In addition, we also used international databases, such as PubMed, ISI (Institute of Scientific Information), and Scopus for extraction data. We used the medical subject heading (Mesh) “obesity” and “body mass index” combined with Iran and equivalent Persian keyword for Iranian database. We also used manually search to find literatures that were not found in the electronic search and checked the reference of the selected literature for maximization of the sensitivity of our search. There was no restriction on language.
3.2. Definition
The most prevalent and practical indicator for evaluation of overweight and obesity is the body mass index (BMI) (20). Obesity is a response variable in relevant studies that, according to the definition of the World Health Organization, is defined as BMI > 30 for adult populations (at least 18 years of age) (9). We included related studies based on anthropometric measure (height and weight) for determining obesity.
3.3. Study Selection
3.3.1. Inclusion and Exclusion Criteria
At first, all founded studies were review based on their title by two study investigators independently and non-relevant studies, duplications and studies that focused on female sex were deleted. Then, the remaining articles were reviewed by abstract in more detail and those who have small study populations (sample less than 100 people), nonrandom sample, did not have any information for applying our method, and those who did not report adjusted ORs were excluded from study. Our study also included studies that have attention to age, sex, place of residence, and smoking status or at least one of them. Every process was reviewed by one expert reviewer to decide on the case.
3.3.2. Data Extraction and Quality Assessment
We generated a simple checklist to assess the quality of included studies. The quality assessment form has three parts: General information regarding the study, sampling quality, and measurement quality.
Each study had a unique code and its general information, such as the name and name of the corresponding author, have been inserted at the top of the form. The sampling quality refers to sample size and sampling design and the measurement quality includes type of measurement tools and accuracy of measurement. The final decision was based on the total scores obtained by each paper in the ranking scale of: Excellent (13 - 19), good (6 - 12), or poor (≤ 5). Poor quality papers have been deleted and two other categories were considered for data extraction processes. All eligible papers have been reviewed and the required information have been extracted. We summarized data and extracted information such as name of first author, year of study, sample population, and reported obesity OR from eligible studies in Table 1. There was a variation in age group category and we selected five 10-year aged group ((20 - 30), (30 - 40), (40 - 50), (50 - 60), and (60+)) due to its abundance in the studies.
| Study | First Author | Year of Study | Sample Size | Related Factor | ||||||||||
|---|---|---|---|---|---|---|---|---|---|---|---|---|---|---|
| Age | Sex | Place of Residence | Smoking Status | |||||||||||
| 20 - 30 | 30 - 40 | 40 - 50 | 50 - 60 | +60 | Male | Female | Rural | Urban | Non-Smoker | Smoker | ||||
| 1 | Bakhshi (21) | 2000 | 27869 | 1 | 2.44 | 3.52 | 3.40 | 3.02 | 1 | 2.40 | 1 | 1.98 | 1 | 0.65 |
| 2 | Bakhshi (21) | 2007 | 26716 | 1 | 2.61 | 3.66 | 3.52 | 3.25 | 1 | 2.35 | 1 | 1.63 | 1 | 0.69 |
| 3 | Bakhshi (21) | 2009 | 20917 | 1 | 2.42 | 3.74 | 3.52 | 3.13 | 1 | 2.57 | 1 | 1.49 | 1 | 0.77 |
| 4 | Bakhshi (21) | 2011 | 8425 | 1 | 2.16 | 3.41 | 3.25 | 2.82 | 1 | 1.58 | 1 | 1.46 | 1 | 0.57 |
| 5 | Bakhshi (22) | 2016 | 26551 | 1 | 2.27 | 3.18 | 3.12 | 2.20 | 1 | 2.90 | 1 | 1.92 | 1 | 0.39 |
| 6 | Dalvand (23) | 2015 | 18990 | 1 | 1.95 | 2.73 | 2.73 | 2.30 | 1 | 2.85 | 1 | 1.57 | 1 | 0.37 |
| 7 | Ahmadi (24) | 2010 | 1000 | 1 | 3.00 | |||||||||
| 8 | Veghari (25) | 2006 | 2471 | 1 | 1.5 | |||||||||
| 9 | Khabazkhoob (26) | 2003 | 4565 | 1 | 2.29 | 3.93 | 4.36 | 3.55 | 1 | 2.27 | ||||
| 10 | Abdollahi (27) | 2005 | 5000 | 1 | 1.74 | |||||||||
| 11 | Moghimi-Dehkordi (28) | 2007 - 2008 | 3000 | 1 | 2.37 | 2.71 | 2.41 | 1.71 | 1 | 2.01 | ||||
| 12 | Hosseinpanah (29) | 1991 - 2001 | 4402 | 1 | 1.97 | 3.51 | 4.27 | 2.65 | 1 | 2.40 | ||||
| 13 | Hosseinpanah (29) | 2002 - 2005 | 4402 | 1 | 2.06 | 4.73 | 4.29 | 2.82 | 1 | 2.60 | ||||
| 14 | Hosseinpanah (29) | 2006 - 2008 | 4402 | 1 | 1.71 | 2.58 | 2.62 | 1.46 | 1 | 2.30 | ||||
| 15 | Janghorbani (30) | 2004 - 2005 | 89404 | 1 | 2.62 | 1 | 1.47 | 1 | 0.65 | |||||
| 16 | Azadbakht (31) | 1999 - 2001 | 9984 | 1 | 2.21 | 3.64 | 4.38 | 3.2 | 1 | 2.49 | ||||
| 17 | Rashidy-pour (11) | 2005 - 2006 | 3799 | 1 | 3.30 | 1 | 1.34 | |||||||
| 18 | Khabazkhoob (32) | 2009 - 2010 | 5190 | 1 | 3.23 | |||||||||
Characteristics of Studies Included in the Systematic Review of the Association Between Obesity and Related Factors in Iran
3.4. Statistical Analysis
Due to the heterogeneity between studies in a meta-analysis, statistical methods need to be designed to account for this problem. Among the existing model, marginal beta-binomial method proposed by Chen et al. (19) is based on the composite likelihood method.
3.4.1. Overview of the Marginal Beta-Binomial Approach
According to the method proposed by Chen et al. (19) for the ith study in a meta-analysis, let denote ni11, ni22, ni21, ni12, ni1, and ni2 be the numbers of true positives, true negatives, false positives, false negatives, obese subjects, and non-obese subjects, respectively, and Sei and Spi be the sensitivity and specificity, respectively.
The bivariate generalized linear mixed effects model, which is commonly used in meta-analysis (33), assumes that the numbers of true positives and true negatives are conditional independent and follow binomial distribution, which is,
(ni11, ni22) | (ni1, ni2, Sei, Spi) ∼ Bin (ni11 | ni1, Sei) × (ni22 | ni2, Spi)
The additional assumption for using the Sarmanov beta-binomial model is that the joint distribution of the Sei and Spi are assumed to follow the Sarmanov distribution family (34).
Then, the marginal distribution of (ni11, ni22) is specified and it is composition of the beta-binomial distributions are given by


Thus, the marginalized likelihood, as a function of (a1, b1, a2, b2, ρ), is specified.
By using the working independence assumption (19), the pseudo likelihood is obtained,

This pseudo likelihood can be specified by the marginal distribution of the Sei and Spi, and model is considered as a marginal beta-binomial model.
4. Results
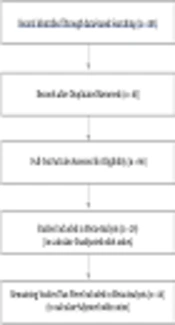
In the primary search, we found 105 full text articles based on the related keywords to our topic. After excluding duplications and considering the inclusion and exclusion criteria, finally, 18 studies were selected to enter our study. The number of primary research results and the detailed process to select appropriate studies are shown in Figure 1. These results attributed to 258283 individuals that were included in our study. Table 2 shows the frequency of studies and overall obesity OR with marginal beta-binomial model for each factor separately. Our results revealed an association between the overall obesity OR and sex, age, smoking, and place of residence among Iranian adults.
| Variable | Unadjusted | Adjusted | ||||
|---|---|---|---|---|---|---|
| Number of Studies | OR | 95% Confidence Interval | Number of Studies | OR | 95% Confidence Interval | |
| Age, y | 14 | 12 | ||||
| 20 - 30 | ||||||
| 30 - 40 | 2.81 | 2.61 - 3.04 | 2.13 | 2.02 - 2.24 | ||
| 40 - 50 | 3.34 | 2.97 - 3.76 | 3.33 | 2.9 - 3.81 | ||
| 50 - 60 | 3.25 | 2.87 - 3.68 | 3.15 | 2.76 - 3.66 | ||
| 60+ | 2.43 | 2.11 - 2.80 | 2.33 | 2.03 - 2.71 | ||
| Female sex | 28 | 2.55 | 2.15 - 2.81 | 17 | 2.35 | 2.01 - 2.74 |
| Residence in an urban area | 13 | 1.61 | 1.47 - 1.76 | 9 | 1.53 | 1.42 - 1.67 |
| Smoker | 7 | 0.48 | 0.41 - 0.56 | 7 | 0.48 | 0.41 - 0.56 |
The Overall Obesity Odds Ratio Estimates from the Meta-Analysis, Using the Marginal Beta-Binomial Model

Flow chart of studies assessed and selected for meta-analysis
4.1. Age
Based on our age group category, 12 studies included age factor. By increasing age to up to 40 - 50 years old, the odds of obesity increased and it decline thereafter. This range of peak is almost equal in the included studies. With using the marginal beta-binomial model and using the age group of 20 - 30 years as the reference, obesity ORs for 30 - 40, 40 - 50, 50 - 60, and +60 were 2.13 (95% CI: 2.02 to 2.24), 3.33(95% CI: 2.91 to 3.81), 3.15 (95% CI: 2.76 to3.66), and 2.33 (95% CI: 2.03 to 2.71), respectively.
4.2. Sex
A total of 17 studies had reported the prevalence of obesity both in men and women. There was a strong association between sex and obesity and also a variation in reported obesity OR due to sever heterogeneity among studies. The minimum and maximum of obesity OR for women was 1.58 and 3.30, respectively. The overall obesity OR for women with marginal beta-binomial model is estimated as 2.35 (95% CI: 2.01 - 2.74), that is, women have 2.35 times higher odds of obesity in comparison with men.
4.3. Place of Residence
A total of nine studies had reported the prevalence of obesity for urban and rural individuals separately. The range of obesity OR was varied between 0.95 and 2.16. Totally, 19.86% of urban and 13.96% of rural people were obese. The overall obesity OR for urban peoples was 1.53 (95% CI: 1.42 to 1.67), compared with rural.
4.4. Smoking
There were seven studies on the association between smoking and obesity in eligible studies. The range of obesity OR for smoker subjects varied between 0.37 and 0.77 compared with nonsmokers. The overall obesity OR for smokers with marginal beta-binomial is 0.48 (95% CI: 0.41 to 0.56).
5. Conclusions
The increasing rate of overweight and obesity is a serious public health problem in the world. A study of global burden in 2005 projected that the number of overweight and obese people in 2030 will reach to 1.35 billion (7). For this reason, the researcher and policy-makers must plan to prevent obesity and determine a health policy for reliable data. To find a study on obesity in Iranian adults we systematically reviewed all related studies from 1990 to 2017 in Iran. However, there was a large variation obesity rate that is due to the populations more than 75 million living in 31 provinces by different socio-economic factors, such as cultural and lifestyles (35, 36) with a different distribution of age and sex. In a recent systematic review in Iranian adults the range of obesity prevalence in national studies was 12.6% - 25.9% (37). In our study, we estimate the overall obesity OR by age, sex, place of residence, and smoking status for Iranian adults using the marginal beta-binomial model. Our findings show that here is a positive association between obesity and age, which is similar to other studies in Iran (38-40) and other countries (41). Changes in food intake, energy expenditure, appetite, and body composition that occurs with ageing attributed to this relationship, as well as, decrease in physical activities, poorer lifestyle, and nutritional behaviors are important reasons for increasing obesity with aging (42). However, in earlier ages, up to 50 years, the obesity reached its maximum rate and then began declining steadily thereafter. This decline of obesity in older age is in association with change in lifestyle, change in diet (43), and decrease in survival rate due to less physical activities and developing diabetes and cardiovascular disease. In all included studies, the joint frequency of obesity in women was considerably higher than men in all aged groups. In our study, 25.71% of woman and 11.66% of men were obese and the odds of obesity in women is 2.3 times higher in men. Our results agree with other studies in Iran (44, 45) as well as neighboring countries including Saudi Arabia (46, 47), Turkey (48, 49), Bahrain (50), and Lebanon (51), however, magnitude of the difference between the sexes varies significantly by countries (52). There were dissimilar results in developed countries such as U.S and many European countries that report higher obesity for men (53). In addition, in some developed country such as France, the prevalence of obesity is similar in both genders. This discrepancy between sexes can likely be related to less physical activity, less smoking, secretion of sex hormones, sedentary lifestyle, unhealthy diet, pregnancy, and menopause in women (54, 55). There are a few studies in Iran that evaluate the relation between obesity and urban and rural residence. In our study, 19.86% of urban and 13.96% of rural individuals were obese, which is similar to other studies where people in urban areas have a higher risk of obesity than rural area individuals. The main reason for this difference can be attributed to less physical activity (sedentary works), unhealthy lifestyle, and tend to eat full-fat food in urban people. It seems that urbanization phenomenon can be an important risk factor for increasing obesity in Iranian adults. Due to the lack of job opportunities, rural residents tend to transition to provincial capital, which is a reason for growing the urban population and obesity. Our finding is similar to some studies in other countries (56). There are some studies with inconsistent results, such as a study in Iran (24) and Turkey, which reported the higher prevalence of obesity in rural areas in comparison to urban areas (57).
Our results show a negative association between smoking and obesity in Iranian adults. All included studies report that obesity is less frequent in smokers than non-smokers. Smoking can have an influence on body weight by increasing metabolism and reducing the consumption of sweet foods. Nicotine also increases energy expenditure, reduces appetite, and decreases the intake of food (58-60). Therefore, smoking can be related to lower body weight and reducing obesity (61). Studies from Australia (62) and Finland (63) did not find a significant deference in obesity between smokers and non-smokers. Our results are also consistent with some studies that used different methods to determine the obesity OR (39).
One of the limitations of our study is that the other risk factors including education, occupation, and marital status were not used in our investigation. Systematic review depends on the quality of the primary studies that are included, thus, being the main limitation of our study. We have excluded the papers that reported unadjusted ORs, which is a problem in our meta-analysis. Therefore, the number of papers were reduced, which is also another limitation of this study. The use of a new statistical method for estimating odds ratio is a major strength for our study.
