


1. Background
Childhood obesity is considered a major global health issue (1), which is mainly due to the sedentary lifestyle and inappropriate dietary habits in children and adolescents (2). The prevalence of childhood obesity has significantly increased in the last decades (3); however, it is reported to follow different trends in different populations (4, 5).
Most surveys have traditionally assessed obesity based on the body mass index (BMI) of their subjects. However, recent studies have shown abdominal obesity, evaluated by waist circumference (WC) or waist-to-height ratio (WHtR), is a better index for cardio-metabolic risk assessment (6). Moreover, children with normal BMI and abdominal obesity have shown to have a worse metabolic profile than individuals with high BMI and no abdominal obesity (6). The prevalence of abdominal obesity has also shown a faster increase than the prevalence of obesity based on BMI (7). Of the two indices for assessing abdominal obesity, WHtR has shown to be superior in detecting cardio-metabolic risk factors (8).
In this regard, we aimed to assess the trend of changes in the prevalence of abdominal obesity according to WHtR in Iranian children and adolescents. For this purpose, we used the age-period-cohort (APC) analysis, a method that looks upon the changes of a variable over time through three temporal dimensions. In this method, birth cohort effects reflect the changes in the variable in children who have gone through similar life events because of their common birth year. Age effects refer to the changes in the variable over an individual’s lifetime while period effects reflect the impact of environmental factors that affect the entire population simultaneously (9).
Although multiple studies have assessed the prevalence of obesity and its changes through time in different parts of the world, a few studies have evaluated all three age, period, and cohort effects simultaneously. Moreover, such assessments have not yet been done on the more clinically-relevant index of abdominal obesity, the WHtR.
2. Objectives
Accordingly, considering the importance of continuous surveillance on this health issue, particularly in children and adolescents, we aimed to evaluate the trend of changes in abdominal obesity among Iranian children and adolescents aged 6 to 19 years using the APC analysis.
3. Methods
3.1. Study Design and Setting
The effects of age, period, and birth cohort on the prevalence of abdominal obesity were evaluated in Iranian children and adolescents aged 5 to 19 years using the data gathered through four surveys of a national surveillance program in Iran, entitled the “Childhood and Adolescence Surveillance and Prevention of Adult Non-Communicable Disease (CASPIAN)” study. The methods of the four surveys (2003, 2007, 2011, and 2015) are briefly described in the following. Ethics committees and other relevant national regulatory organizations reviewed and approved the research protocols of these surveys. All the participants or their parents signed informed consent forms before recruitment in either of the four surveys.
3.2. Data
3.2.1. CASPIAN-I Study
The first CASPIAN study was conducted in 2003 on school students living in urban and rural areas of 23 provinces in the country. This multicenter survey used a multistage random cluster sampling method to include a nationally representative sample and eventually provided information on anthropometric measurements of 20,912 children and adolescents aged 5 - 19 years.
3.2.2. CASPIAN-III Study
In 2007, the second survey of surveillance gathered anthropometric data from 5,630 subjects aged 10 to 18 years. The survey recruited its sample population from all 31 provinces of Iran.
3.2.3. CASPIAN-IV Study
The fourth CASPIAN study was conducted in 2011 on students from elementary, intermediate, and high schools of urban and rural areas. They were selected by the multistage cluster sampling method from 30 provinces of the country. Clusters were determined at the level of schools, including 10 sample units in each cluster. The sampling was proportional to size with an equal number of subjects from each gender. Eventually, anthropometric measurements from 13,302 children and adolescents aged 7 to 19 years were extracted for use in our analysis.
3.2.4. CASPIAN-V Study
This study was conducted in 2015. It applied a multistage, stratified sampling method to include 7 to 18-year-old students from urban and rural areas of 30 provinces in Iran. Similar to previous surveys, each cluster included 10 students determined at the school level. The sample size calculated for each province was 480 students (48 clusters), which added up to a national sample of 14,400 subjects. For analysis in the present study, data were extracted from 14,118 subjects aged 7 to 18 years.
3.3. Height and Waist Circumference Measurements
In all four surveys, instruments were standardized before the examination. Height was measured with the subject standing upright, barefoot, and the knees fully extended, using a stadiometer with an accuracy of 0.1 centimeters. The WC was measured at a point in the middle of the lower border of the rib cage and the iliac crest with the subject at the end of normal expiration using a non-elastic tape. The WHtR was calculated by dividing the WC of the subject by his/her height. As proposed by previous studies, the cutoff value of WHtR ≥ 0.5 was considered as the criterion for abdominal obesity.
3.4. Statistical Analysis
The present study assessed the APC effect on the prevalence of abdominal obesity in Iranian children and adolescents using the “apc_ie” command statement in STATA version 14.0 software (Stata Corp., College Station, TX, USA). The main problem of analyzing the data was the dependency among age, period, and cohort, called identification problem. To overcome this difficulty, several famous solutions have been proposed, such as constrained coefficients GLIM estimator (CGLIM) (10), proxy variables approach (use of proxy variables as surrogates) (11), nonlinear parametric (algebraic) transformation approach (12), and median Polish analysis (13). Recently, a technique has been introduced called the intrinsic estimator (IE) method, which applies the principal component regression analysis to addresses the identification problem. However, similar to CGLIM, the IE method also imposes constraints on parameters. As the constraints are less subjective, they do not affect the estimation of regression parameters for age, period, or cohort. The robustness of the IE method has been confirmed by comparing the results from the IE analysis of empirical data with the findings from the analysis of the same data by a different family of models that do not use the same identifying constraint (14).
4. Results
Data from 53,962 children and adolescents aged 5 to 19 years were analyzed in the present study, including 27,508 (51.0%) boys and 26454 (49.0%) girls. The national survey conducted in 2003 comprised the greatest proportion of this sample size, with 38.8% of the total subjects, while the survey carried out in 2007 provided only 10.4% of the sample population (Table 1).
| Study Year | Boys | Girls | Total | Percentage of Total |
|---|---|---|---|---|
| 2003 | 10765 (51.5) | 10147 (48.5) | 20912 (100) | 38.8 |
| 2007 | 2828 (50.2) | 2802 (49.8) | 5630 (100) | 10.4 |
| 2011 | 6749 (50.7) | 6553 (49.3) | 13302 (100) | 24.6 |
| 2015 | 7166 (50.8) | 6952 (49.2) | 14118 (100) | 26.2 |
| Total | 27508 (51.0) | 26454 (49.0) | 53962 (100) | 100 |
Sample Sizes According to Study Year and Gendera
4.1. Prevalence of Abdominal Obesity
4.1.1. By Age
Table 2 presents the prevalence of abdominal obesity in the sample population by age and study periods. Although the prevalence of abdominal obesity shows considerable fluctuations with increasing age in all assessed periods, an overall trend can be noted for some of them. For instance, the prevalence follows a decreasing trend in the 2003 period for boys, while the corresponding trend for girls is increasing. On the other hand, the prevalence follows an increasing trend in boys evaluated in the 2007 period, while it follows a bell-shaped trend in girls. As for the 2011 period, the prevalence shows a bell-shaped curve for boys, while significant fluctuations are observed among girls. No obvious trend can be seen for either of the two genders in the 2015 period (Table 2).
| Age, y and Sex | Study Year | |||
|---|---|---|---|---|
| 2003 | 2007 | 2011 | 015 | |
| Boys | ||||
| 5 | 17 (11.8) | |||
| 6 | 393 (9.7) | |||
| 7 | 662 (11.5) | 406 (12.8) | 358 (19.6) | |
| 8 | 761 (9.3) | 806 (17.1) | 561 (17.5) | |
| 9 | 741 (8.5) | 592 (17.9) | 654 (16.8) | |
| 10 | 842 (10.5) | 96 (12.5) | 464 (20.9) | 767 (23.3) |
| 11 | 933 (12.0) | 211 (10.0) | 601 (21.5) | 669 (20.2) |
| 12 | 1030 (11.0) | 394 (11.9) | 668 (26.6) | 683 (22.7) |
| 13 | 1030 (9.1) | 316 (10.1) | 614 (24.6) | 788 (20.3) |
| 14 | 1221 (8.4) | 285 (11.9) | 456 (24.6) | 658 (20.4) |
| 15 | 1062 (6.7) | 381 (17.3) | 556 (20.7) | 464 (22.4) |
| 16 | 979 (6.9) | 288 (16.7) | 684 (19.9) | 644 (21.3) |
| 17 | 728 (8.2) | 325 (16.6) | 513 (19.9) | 591 (22.3) |
| 18 | 298 (6.4) | 532 (15.0) | 287 (15.3) | 329 (20.1) |
| 19 | 68 (8.8) | 102 (18.6) | ||
| Total | 10765 (9.2) | 2828 (13.6) | 6749 (21.3) | 7166 (21.4) |
| Girls | ||||
| 5 | 11 (6.5) | |||
| 6 | 384 (9.9) | |||
| 7 | 655 (11.6) | 356 (18.0) | 334 (20.7) | |
| 8 | 727 (7.8) | 631 (16.8) | 714 (17.6) | |
| 9 | 688 (8.3) | 584 (19.5) | 741 (18.1) | |
| 10 | 790 (8.9) | 63 (14.3) | 465 (17.0) | 656 (19.1) |
| 11 | 812 (8.1) | 165 (14.5) | 542 (18.3) | 606 (17.7) |
| 12 | 1066 (10.7) | 412 (18.4) | 643 (16.8) | 734 (20.0) |
| 13 | 899 (9.0) | 351 (20.8) | 551 (18.0) | 780 (19.9) |
| 14 | 1026 (9.1) | 303 (15.5) | 543 (14.4) | 618 (18.8) |
| 15 | 1040 (8.7) | 325 (16.6) | 734 (18.3) | 428 (19.6) |
| 16 | 1028 (9.4) | 295 (13.2) | 692 (21.4) | 522 (21.8) |
| 17 | 660 (9.1) | 388 (13.9) | 426 (18.5) | 436 (19.0) |
| 18 | 289 (12.8) | 500 (14.4) | 269 (17.1) | 383 (19.3) |
| 19 | 72 (23.6) | 117 (11.1) | ||
| Total | 10147 (10.2) | 2802 (15.7) | 6553 (17.1) | 6952 (19.5) |
Prevalence of Central Obesity According to Age, Sex, and Study Yeara
4.1.2. By Survey Period
The prevalence of abdominal obesity follows an increasing trend in both genders, going from earlier periods to the recent ones. Among boys, the overall figure of abdominal obesity prevalence increases from 9.2% in 2003 to 13.6% in 2007, 21.3% in 2011, and eventually 21.4% in 2015. The prevalence among girls rises from 10.2% in 2003 to 15.7% in 2007, 17.1% in 2011, and 19.5% in 2015. Therefore, the prevalence of abdominal obesity was found to be higher among girls in the first two periods, while boys had a higher prevalence in the last two periods (Table 3).
| Cohort and Sex | Study Year | Total | |||
|---|---|---|---|---|---|
| 2003 | 2007 | 2011 | 2015 | ||
| Boys | |||||
| 1981 - 1985 | 7.4 | ||||
| 1986 - 1990 | 10.2 | 16.4 | 13.0 | ||
| 1991 - 1995 | 10.1 | 11.3 | 18.9 | 13.4 | |
| 1996 - 2000 | 23.6 | 21.5 | 22.7 | ||
| 2001 - 2005 | 21.4 | 21.4 | |||
| Total | 9.2 | 13.6 | 21.3 | 21.4 | 15.5 |
| Girls | |||||
| 1981 - 1985 | 12.7 | 12.7 | |||
| 1986 - 1990 | 9.2 | 14.5 | 11.5 | ||
| 1991 - 1995 | 8.8 | 16.7 | 17.3 | 14.3 | |
| 1996 - 2000 | 16.9 | 19.9 | 18.2 | ||
| 2001 - 2005 | 19.1 | 19.1 | |||
| Total | 10.2 | 15.7 | 17.1 | 19.5 | 14.9 |
Prevalence (%) of Central Obesity According to Birth Cohort, Study Year, and Sex
4.1.3. By Birth Cohort
Based on the findings presented in Table 3, except for the birth cohort of 1996 - 2000, the prevalence of abdominal obesity in boys increased from earlier cohorts to more recent ones, but it showed a slight decrease in the last cohort. For girls, the figures followed an increasing trend as well, except for the first cohort of 1981 - 85, which was found to be higher than its next cohort (Table 3).
4.2. Effects of Age, Period, and Cohort
As illustrated, the prevalence of abdominal obesity is affected by the three factors of age, period, and birth cohort. In this regard, the independent effect of each factor was assessed while controlling for the other two factors. The Akaike information criterion (AIC) and the Bayesian information criterion (BIC) of the full APC model are given in Table 3 where the three factors are simultaneously controlled.
4.2.1. Age Effect
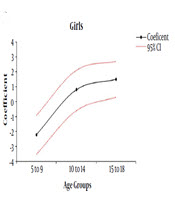
The coefficients of estimation for the effect of age on the prevalence of abdominal obesity are presented in Table 4 and Figure 1A and B, separately for each gender. As can be seen, the coefficient increased from -2.1 in the age group of 5 - 9 to 1.1 in the age group of 10 - 14 and then decreased to 1.0 in the age group of 15 - 19 among boys. The figures followed an increasing trend in girls from -2.2 to 0.8 and 1.5, respectively (Table 4).
| Age, Period and Cohort | Boys | Girls | ||||||
|---|---|---|---|---|---|---|---|---|
| Coefficienta | 95% CI | P | Coefficient | 95% CI | P | |||
| Age, y | ||||||||
| 5 - 9 | -2.1 | -3.3 | -0.9 | 0.001 | -2.2 | -3.5 | -0.9 | 0.001 |
| 10 - 14 | 1.1 | -0.2 | 2.3 | 0.092 | 0.8 | -0.6 | 2.1 | 0.265 |
| 15 - 19 | 1.0 | -0.1 | 2.1 | 0.084 | 1.5 | 0.3 | 2.7 | 0.018 |
| Period | ||||||||
| 2000 | -4.6 | -5.8 | -3.3 | < 0.001 | -4.1 | -5.4 | -2.8 | < 0.001 |
| 2005 | -2.5 | -4.1 | -1.0 | 0.002 | 0.6 | -1.1 | 2.2 | 0.519 |
| 2010 | 3.1 | 1.7 | 4.6 | < 0.001 | 1.2 | -0.4 | 2.7 | 0.137 |
| 2015 | 4.0 | 2.3 | 5.6 | < 0.001 | 2.4 | 0.6 | 4.2 | 0.009 |
| Cohort | ||||||||
| 1981 - 1885 | -3.3 | -5.1 | -1.6 | < 0.001 | 0.5 | -1.4 | 2.4 | 0.607 |
| 1986 - 1990 | 1.4 | -0.6 | 3.5 | 0.166 | -2.2 | -4.4 | -0.1 | 0.044 |
| 1991 - 1995 | 0.5 | -1.3 | 2.2 | 0.618 | 0.2 | -1.7 | 2.1 | 0.823 |
| 1996 - 2000 | 3.1 | 1.5 | 4.7 | < 0.001 | 0.03 | -1.7 | 1.8 | 0.969 |
| 2001 - 2005 | 0.1 | -1.5 | 1.6 | 0.948 | 1.5 | -0.2 | 3.1 | 0.089 |
| 2005 - 2010 | -1.7 | -4.6 | 1.3 | 0.261 | 0.03 | -3.1 | 3.2 | 0.987 |
| Constant | 14.3 | 13.4 | 15.2 | < 0.001 | 14.8 | 13.8 | 15.8 | < 0.001 |
| AIC | 5.3 | 5.5 | ||||||
| BIC | 309.5 | 388.3 | ||||||
Intrinsic Estimates for the Rate of Central Obesity of Iranian Boys and Girls

Prevalence of central obesity among boys and girls; A and B, age, C and D, period, and E and F, birth cohort effects.
4.2.2. Period Effect
The coefficients for the effects of the period on the prevalence of abdominal obesity followed an increasing trend in both genders: from -4.6 to -2.5, 3.1, and 4.0 in boys and from -4.1 to 0.6, 1.2, and 2.4 in girls (Table 4, Figure 1C and D).
4.2.3. Birth Cohort Effect
Considerable variations were observed in the coefficients calculated for the birth cohort effects on abdominal obesity prevalence in boys. The lowest coefficient was calculated for the 1981 - 1985 cohort, while the 1996 - 2000 birth cohort had the highest coefficient. Similar, but less extreme variations were found for girls, as well; the lowest coefficient was calculated for the 1986 - 1990 birth cohort while the highest coefficient was reported for the 2001 - 2005 cohort (Table 4, Figure 1E and F).
5. Discussion
The present study showed significant correlations between age, period, and cohort effects and the prevalence of abdominal obesity in children and adolescents. With increasing age, regardless of considerable fluctuations, the prevalence of abdominal obesity followed an overall increasing trend in both genders. As for the period effect, in both boys and girls, the prevalence of abdominal obesity followed an increasing trend when coming from the earlier periods to the recent ones. Likewise, the prevalence increased from earlier birth cohorts to the recent ones in both genders.
Although many studies have evaluated childhood obesity in different populations based on the traditional index BMI, a few studies have assessed the trends of childhood obesity according to the more clinically-valuable index WHtR. To the best of our knowledge, this is the first study that has looked upon the trends of abdominal obesity in children and adolescents through the three different temporal dimensions of age, period, and cohort. Most previous surveys have only evaluated the effects of age and period on this health issue.
Xi et al. (15) presented the trends of abdominal obesity among US children and adolescents during five time-periods of 2003 - 2004, 2005 - 2006, 2007 - 2008, 2009 - 2010, and 2011 - 2012. They assessed the trends of changes in the prevalence of abdominal obesity based on the criterion of WHtR ≥ 0.5 among US children and adolescents aged 6 to 18 years. According to their findings, the period had no significant effect on the prevalence of abdominal obesity and the figures showed no considerable changes between subsequent study periods. On the other hand, they reported the prevalence of abdominal obesity was significantly higher in the age group of 12 to 18 years than in the age group of 6 to 11 years (15). The most important issue with this study was the fact that the authors did not take into account all the three age, period, and cohort effects and they did not apply a specific analytical method such as IE to control for other effects while evaluating one of them.
In another study published in 2014, Rerksuppaphol and Rerksuppaphol (16) evaluated the WHtR values in a sample of Thai children aged 6 to 12 years in 2013. They compared their figures with data gathered from children of the same area in 2008. Based on their findings, in the 2013 period, the WHtR values showed no significant variations with age in both genders. However, when compared to the 2008 period, WHtR values were found to have increased consistently across all age groups and both genders (16). Although they did not use the cutoff value of 0.5 to report the prevalence of abdominal obesity in their sample population, the increase they observed in WHtR values confirmed the increasing prevalence of abdominal obesity and consequent cardiometabolic health issues in their population. These researchers also did not include the effects of the birth cohort in their analyses but only included two periods and overlooked the entangled correlation between these three temporal elements.
In 2017, Hardy et al. (17) included data from 27,808 subjects gathered through five cross-sectional surveys conducted in 1985 - 1997 - 2004 - 2010 - 2015 in New South Wales, Australia. Their analyses showed significant increases in the prevalence of abdominal obesity between 1985 and 2015 (17). These researchers only assessed the period effect and failed to include age and birth cohort effects in their analyses.
Although the APC analysis has been widely used for assessing the trends of different variables over time, as mentioned, this is the first study that applied this method to evaluate the changes in the prevalence of abdominal obesity in children and adolescents. Our results showed an increasing trend in the prevalence of abdominal obesity in both genders starting from the 1986 - 1990 period, which coincides with the post-Iran-Iraq war era. Such disasters could be the cause of major changes in the dietary habits of a population, subsequent to the compulsory lifestyle changes it brings about. As in this case, Iranian people turned to the consumption of high-fat and unhealthy diets (18), leading to an increase in the prevalence of abdominal obesity among children born in this period. The continuous growth in the prevalence of abdominal obesity could also be attributed to the transition that occurred in the contents of Iranian’s regular diet from dairy products, fruits, and vegetables towards fats, different oils, and sugars (19). Other than these nutritional factors, attention should also be paid to the utmost important role of lack of physical activity and the greater proportion of time spent in sedentary behaviors such as watching television or playing video games and computer use in the population of our children and adolescents.
5.1. Limitation
The present study has some limitations. First, the data used in the present study were entirely from observational studies in different years and therefore, possible biases such as assessment bias should not be ignored. Although the measurement of anthropometric parameters was similar in the CASPIAN surveys and waist circumference was assessed by the same method, different individuals contributed to data collection in four CASPIAN studies. Therefore, this is another limitation of the present study, which can introduce the possible bias in data collection.
5.2. Conclusions
Overall, the results of this study showed the prevalence of abdominal obesity is increasing in the population of Iranian children and adolescents. This alarming trend was found to be affected by the birth cohort that reflects various environmental factors and social stresses (e.g. Iran-Iraq war) occurring during the first years of a child’s life; the period effect reflects other environmental and social factors occurring later in the child’s life such as alterations in dietary habits (period effect); the age effect refers to the changes occurring due to the aging processes in an individual. The findings of this study emphasize the undeniable need for taking definitive actions against the childhood obesity epidemic.
