1. Context
Over the past century, obesity and chronic diseases appear as leading health concerns via shared environmental changes (1). Excess weight is major risks for cardiovascular disease (CVD), type-2 diabetes (T2DM) and mortality (2-4), factors favoring a positive energy balance and weight gain over several decades include increasing per capita high-calorie and palatable food consumption, substitution of occupational physical activities with sitting works with electronic devices, decreasing time spent in leisure-time physical activities and growing time for watching television, and growing use of medicines that have weight gain as a side effect (5, 6).
In this report, we aim to review the 20 year findings of the Tehran Lipid and Glucose Study (TLGS) on obesity and overweight.
2. Evidence Acquisition
We searched MEDLINE (via PubMed) for articles published between Jan 1, 2000, and Jan 1, 2018, using the search terms (“obesity” OR “overweight” OR “waist circumference” OR “body mass index” AND “Tehran Lipid and Glucose Study”. All articles with the terms “obesity or overweight” in their title, subject or MeSh were included for initial review. Since studies with nutrition or chronic kidney diseases (CKD) issue as their main topic have been addressed elsewhere, we excluded all articles that have examined the relationship between obesity and nutrition or CKD from this review.
2.1. Definition of Overweight and Obesity
For adults, overweight is defined as 25.0 ≤ BMI ≤ 29.9 kg/m2, and obese is defined as BMI ≥ 30.0 kg/m2. Obesity is classified by grade as follows: 30 ≤ BMI ≤ 34.9 (class I), 35 ≤ BMI ≤ 39.9 (class II), and BMI ≥ 40 (class III) (7). By WHO definition obesity is defined as BMI-for-age > 2 SD and overweight is defined as 1 SD < BMI-for-age ≤ 2 SD in each gender for children (8).
On the other hand, waist circumference (WC) is used to classify excess adiposity which is also associated with increased cardiovascular risk. Iranian National Committee of Obesity defined WC ≥ 90 cm as at risk for CVD and WC ≥ 95 cm as high risk for CVD events for both sexes (9).
3. Results
3.1. Youth
3.1.1. Prevalence
In Phase I (1998 to 2001), in children and adolescents aged 3 - 19 years, the overall prevalence of excess weight (including overweight and obesity) was 20.8% based on value BMI-for-age ≥ 1 SD in each gender. The prevalence of excess weight for age group 2 to 5, 6 to 11 years and 12 to 19 years were 13, 19.2 and 23.5%, respectively. By gender, no significant differences have been reported in prevalence of excess weight.
In addition, obesity prevalence among adolescents with less educated parents was higher than adolescents with high educated parents.
According to data documented between 1998 - 2001 (Phase I), the prevalence of sever obesity which defined as BMI for-age ≥ 3 SD was 1.2% for children and adolescents (aged 3 to 19 years). This prevalence rose to 3% between 2013 - 2016 (Phase V).
3.1.2. Incidence
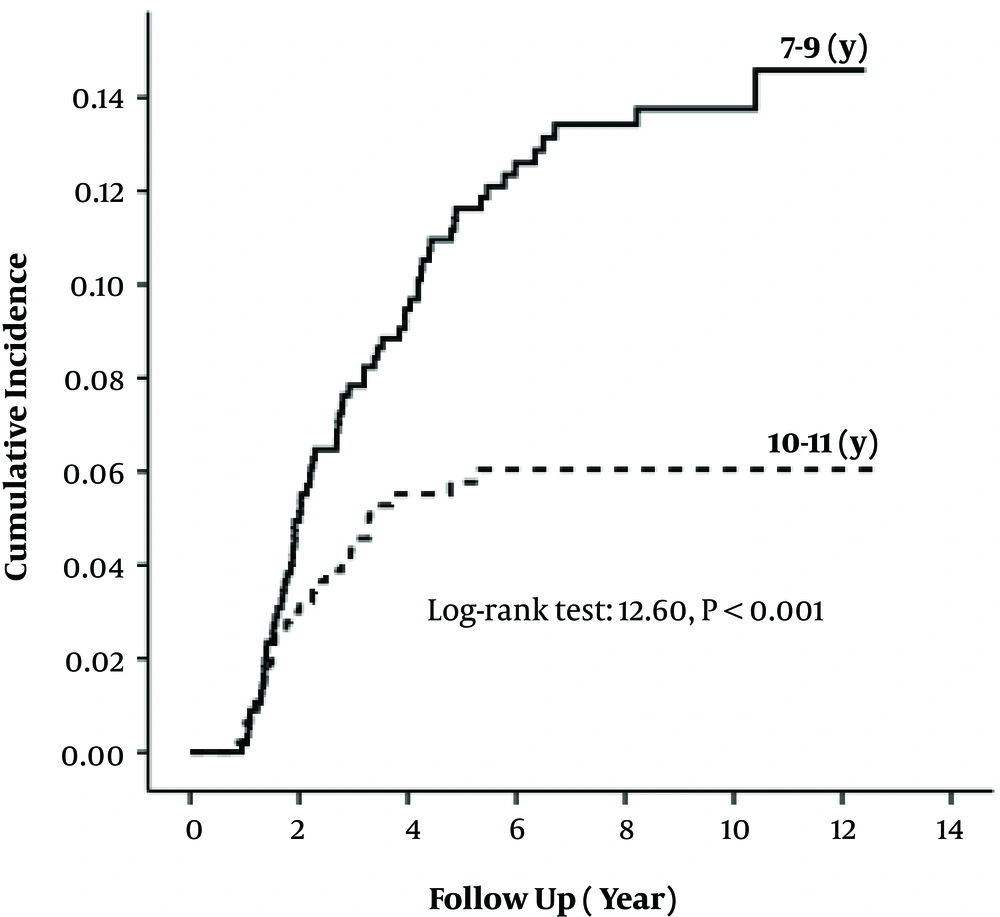
Another analysis of TLGS data, with a median 8.7 years of follow-up showed that among children, aged 7 - 11 years the incidence of obesity was 17% (CI: 14.7 - 20.3), which in boys was higher than girls [19.5% (CI: 15.4 - 24.8) vs. 14.5% (CI: 10.9 - 19.1)]. Compared to non-obese children 10 - 11 years old, 7 - 9 years old were at higher risk of obesity, supported by a cumulative incidence of obesity of 22% in the younger subgroup, compared with only 10.8% in older children (Figure 1). The best childhood obesity predictors were overweight, WC more than 95th percentile, hypertension, MetS, and parental obesity (10).
3.1.3. Trends
According to TLGS data, between Phases I (1999 - 2001) to Phase IV (2009 to 2011) overall obesity prevalence in youth, aged 3 to 11 years, was increased from 5.5% to 9.4%. Using GEE (generalized estimating equation) analysis, relative risk of obesity was calculated, comparing each phase to its previous phase: Phase II in reference to Phase I (RR = 1.06, CI: 1.04 - 1.08), Phase III in reference to Phase II (RR = 1.01, CI: 1.00 - 1.03) and Phase IV in reference to Phase III (RR = 0.96, CI: 0.94 - 0.98). Between group difference was significant in all subgroups (age, gender, parental obesity) except for parental education. For children aged below 7 years old in phase I, trend of obesity throughout the study was higher, compared to those ≥ 7 years of age in this phase.
3.1.4. Morbidity
According to TLGS data, the incidence of MetS during 6.6 years follow-up in 6 - 12-year-old children was 10.7% which was higher in boys compare to girls. Higher BMI and WC were associated with higher incidence and prevalence of MetS and both of these anthropometric indices had the similar power in predicting MetS. Among children aged 6 - 12-years the cut-off values to predict MetS for BMI were 16.5 kg/m2 and 16.3 kg/m2; for WC were 57.5 cm and 56.5 cm for boys and girls, respectively (11).
During a 10.2 year follow-up of 1100 participants with aged 11 - 18 years and without MetS at baseline, the cumulative incidence of MetS in early adulthood for men was 25.5% and for women was 1.8%. In boys, WC and waist-to-height ratio (WHtR) had the highest risk for the MetS. In age group 11 - 14-year, the results did not change after adjustment for BMI in addition to WC (OR for WC: 2.28 without BMI adjustment vs. 1.98 with BMI adjustment). Therefore, these results showed that beyond BMI, WC predict the risk of MetS. On the other hand, the anthropometric indices did not have significant associations with subsequent MetS risk in girls. Therefore we can conclude that in Tehranian male adolescents abdominal obesity (WHtR and WC) compare to BMI were better predictor for early adulthood MetS (12).
In another study, did not report any association with the risk of MetS in adulthood after adjustment for BMI in adult age, MetS in adolescent age and overweight or obesity. AUC was greater for obesity than MetS (0.619 vs. 0.589). Thus, it seems that independent of adult BMI, adolescent MetS or obesity did not predict early adult MetS (13).
Another analysis was done to explore the association between childhood BMI status (3 - 11 years) and adulthood dysglycemia over a median 9.3 years follow up. The results showed that considering individual and parental factors together, BMI status in early life stages is not associated with the incidence of adult dysglycemia.
3.2. Adults
3.2.1. Prevalence
In Phase I the overall prevalence of obesity was 23.3% (29.6 and 14.6% in women and men, respectively). Overweight was present in 38.3% of women and 42.4% of men. In both sexes, the highest rate of obesity was observed in the 50 - 59 year age group. The prevalence of obesity in both sexes increased with age up to 60 years (14).
The prevalence of abdominal obesity in women was greater than men (76.7 vs. 36.5%) (15).
3.2.2. Incidence
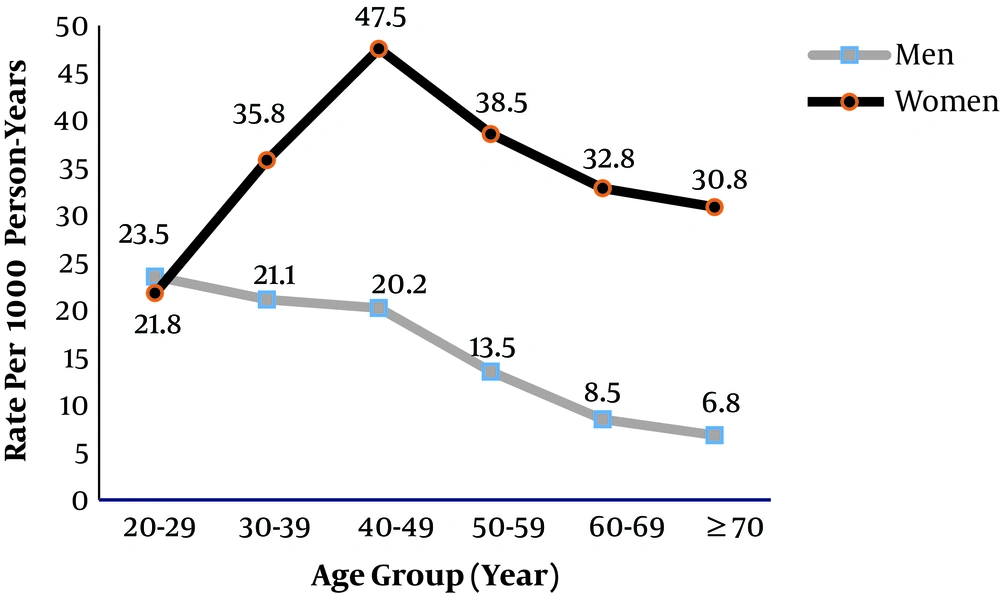
Cumulative incidence of obesity among Tehranian adults in a median 8 year follow up were 31.3, 38.1 and 23.4% for the whole population, women, and men, respectively. In both sexes, higher risk for development of obesity were higher BMI or WC, MetS and lower educational level at baseline. Men showed the highest incidence rate during their 20s and women during their 40s (Figure 2) (16).
In an investigation with a median 6 years of follow up, total cumulative incidence of abdominal obesity for total population was 76.0% (83.6% for men and 70.9%, for women).
3.2.3. Trends
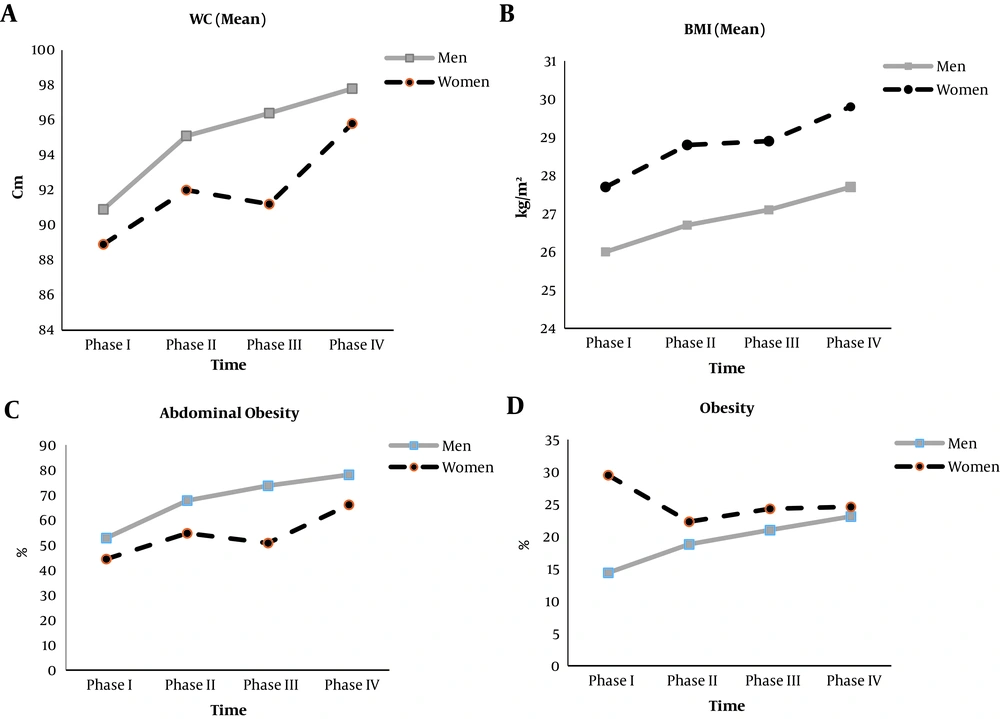
In both genders, obesity and abdominal had increasing trends across four phases of TLGS in all study subgroups of adults with using generalized estimating equation (GEE) models. The crude prevalence of obesity and abdominal obesity at baseline were 23.1 and 47.9 %, respectively. These values increased to 34.1 and 71.1 %, at the end of follow-up. Over the whole study period, risks of obesity increased for men and women (RR = 1.6, CI: 1.5 - 1.8 and RR = 1.2, CI: 1.2 - 1.3, respectively) and abdominal obesity for men and women (RR = 1.5, CI: 1.4 - 1.5 and RR = 1.2, CI: 1.2 - 1.3, respectively). Regardless of age, marital status and educational level, these rising trends were observed in all subgroups (Figure 3) (17).
3.2.4. Obesity Phenotype
Reports on risk factors for related health outcomes in different obesity phenotypes have yielded contradictory results. A combination of BMI groups and metabolic status developed to different obesity phenotypes; including metabolically obese but normal weight (MONW) and metabolically healthy but obese (MHO). These phenotypes have different risks for incidence of T2DM, CVD and mortality in further (18). Recently, some studies have also used waist circumference (WC) for definition of obesity phenotype.
Prevalence of MHO (based on having less than one component of metabolic syndrome) was 2% in the total population and 7.7% in the obese population (19).
Accordingly, the MHAO phenotype (based on abdominal obesity and having less than one component of metabolic syndrome) found in 12% and 23% of the total population and the abdominal obese population, respectively (20).
Our investigations showed the MHO phenotype is an unstable condition and half of the individuals developed to MetS during 10 years of follow-up (21). Moreover, after 10 years follow-up 43.3% of MHAO adults lost their metabolic health, of whom 42.1% developed MetS (22).
During 8.1 years of follow-up, normal-weight subjects with MetS or T2DM compared to overweight and obese subjects without MetS or T2DM had a significantly higher CVD event rate. Also, within the group with MetS or T2DM, a significant association between BMI and CVD events has been observed, whereas no significant association was shown within the group without MetS or T2DM (23).
Moreover, in another report during amount one decade, incident or cardiovascular events did not increase in MHOW and MHO compared to MHNW individuals; however all metabolically unhealthy phenotypes (having more than one metabolic components) showed increased risk of CVD events (Table 1) (19).
| Healthy Metabolic Status | Unhealthy Metabolic Status | |||||
|---|---|---|---|---|---|---|
| Normal Weight (MHNW) (n = 1218) | Overweight (MHOW) (n = 731) | Obese (MHO) (n = 147) | Normal Weight (MUNW) (n = 920) | Overweight (MUOW) (n = 2429) | Obese (MUHO) (n = 1722) | |
| Unadjusted HR (95% CI) | 1 | 0.8 (0.5 - 1.3) | 1.0 (0.5 - 2.3) | 2.8 (2.1 - 3.9)d | 2.9 (2.1 - 3.8)d | 2.5 (1.9 - 3.4)d |
| Model 1 (95% CI)b | 1 | 1.2 (0.8 - 1.9) | 1.8 (0.8 - 4.0) | 1.9 (1.4 - 2.7)d | 2.4 (1.8 - 3.2)d | 2.6 (1.9 - 3.6)d |
| Model 2 (95% CI)c | 1 | 1.2 (0.7 - 2.0) | 1.7 (0.7 - 4.4) | 1.7 (1.2 - 2.4)d | 2.0 (1.5 - 2.8)d | 2.4 (1.7 - 3.5)d |
Abbreviations: CVD, cardiovascular disease; MHNW, metabolically healthy normal weight; MHO, metabolically healthy obese; MHOW, metabolically healthy over weight; MUHOW: metabolically unhealthy overweight; MUNW, metabolically unhealthy normal weight; MUO: metabolically unhealthy obese.
aMetabolic health was defined as one or less of metabolic syndrome components.
bAdjusted for age and sex.
cAdjusted for model 1 plus smoking, education level, physical activity, family history of premature coronary artery disease and total cholesterol.
dCompared to reference group (MHNW), P < 0.001.
Our reports during a 10-year follow-up in different abdominal obesity phenotypes (having less than one metabolic component) showed that the risk for CVD was higher in MHAO and MUNAO compared to the reference group; metabolically healthily non-abdominal obese (MHNAO) (20). On the other hand, another study showed that in the MHAO phenotype all-cause mortality risk was not greater than reference group (HR = 1.3, CI: 0.9 - 2.0) (24).
Moreover, the association between different obesity phenotypes and incident T2DM was assessed in our cohort. Women with normal weight and MetS compared to healthy normal weight women had ORs for T2DM incidence of 8.8 (CI: 3.7 - 21.2). This values for men were 3.1 (CI: 1.3 - 7.0) (25).
In another report, during 12 years of follow-up the results of multivariate models showed that T2DM risk was increased in all unhealthy abdominal obesity phenotypes (having more than one metabolic component) except the metabolic unhealthy non-abdominal obesity (MUNAO) phenotype in men. Also, MHAO phenotype was associated with incident of T2DM in men (HR = 1.5 CI: 1.0 - 2.4) and in women (HR = 1.7 CI: 1.1 - 2.6) (26).
4. Conclusions
This review summarizes most of the key findings of the TLGS cohort related to obesity, including prevalence, incidence, trend, and obesity phenotype during 20 years. Overall, similar to other developing countries, we are faced with a high prevalence of obesity and abdominal obesity especially in adulthood. Moreover, the longitudinal nature of TLGS has provides an opportunity to confirm the simultaneous alarming rise of obesity and abdominal obesity, underscoring the urgent need for implement action of preventive strategies aimed of reducing the burden of the problem.
Although a prospective population based study such as TLGS, sheds more light on the various aspects of obesity and its related risk factors, there still remain a certain number of issues which should be resolved in future research. First, considering the limitations of anthropometric indices, we need to gather data regarding body compositions. Second, in order to assess the impact of socioeconomic status on different aspects of obesity, more information is needed to determine this variable. Third, to obtain a bigger picture of the problem at a national level, we can merge our findings with the results of other cohorts in Iran. Fourth, research on genetic causes of all types of obesity and related comorbidities must be conducted in the future. Also, in the context of assessing the impact of obesity during adolescence on cardiovascular outcomes in early adulthood, providing some surrogate endpoint such as intimal media thickness can overcome the problem of low event rate in this age category.


