


1. Background
Gestational diabetes mellitus (GDM) with the estimated global incidence of between 0.6% to 15% is one of the most important pregnancy complications (1). This metabolic disorder is diagnosed or first appears during the second or third trimester at phase (2, 3), in which it can be both harmful for the mother and its offspring (4). Some of which are delivery complications (premature delivery, caesarean birth, birth injury, preeclampsia) as well as developing type II diabetes mellitus in the future (1). Since the diagnosis and treatment approaches of many diseases such as GDM is hampered due to the lack of putative biomarkers of which, high throughput molecular studies seemed promising in this regard (5). In fact, molecular studies could broaden the horizons on disease management and advanced medical approaches including screening, diagnosis, and treatment through evaluating mechanisms, which has recently become of great interest (6, 7). Biomarkers with high sensitivity and specificity could be identified for early interventions and low-cost screenings. There is a variety of omics research in this regard that are presented as genomics, proteomics, and metabolomics, which has been carried out for this metabolic disorder analysis (3, 4, 8). In addition, small none-coding RNA known as microRNAs (miRNAs) associated with the disease state are also important to be explored for understanding the disease’s underlying mechanisms such as GDM. In a way, the aberrant expression of these elements could influence the target genes’ functions by degradation or translational inhibitions (9). The role of potential regulators and their target biomarkers is highlighted in the pathophysiology of gestational diabetes mellitus and could be applicable in early diagnosis of GDM and motherhood health improvements (10).
2. Objectives
To identify biomarkers for GDM, which may be useful in its diagnosis and/or treatment, we used two datasets of microRNAs and genes from the STRING db related to GDM to conduct a regulatory network analysis.
3. Methods
The current bioinformatics study is based on plasma miRNA expression profiling of GDM available online in gene expression omnibus (GEO) (www.ncbi.nlm.nih.gov/geo/). The dataset was assigned with GEO series accession number of GSE98043, which was based on the platform of GPL21575 (Agilent-070156 Human_miRNA_V21.0_Microarray 046064) using SurePrint human miRNA microarray (11). This dataset provides four samples that all were chosen for this in-silico analysis. Human samples of healthy controls and gestational diabetes mellitus were compared in terms of expression profiling of differentially expressed (DE)miRNA via GEO2R (http://www.ncbi.nlm.nih.gov/geo/geo2r/). Furthermore, the top 250 differentially expressed miRNAs in GDM were retrieved and those with the defined cut offs (P value (adj. P) of less than 0.05 and a fold change of at least 2 (> 2-fold change) as thresholds), were assigned for more analysis. Fold change measures the expression difference levels across the comparison of groups (12). In addition, miRNAs with IDs (67 differentially expressed miRNAs) were then considered for more study as regulatory network identifications. The fold change values were obtained by the application of the below formula available in the excel software.
Inverse Log = (base) ^ (number)
In which, base = 2 and number equals to the value of the log fold change.
On the other hand, a network of genes related to GDM was retrieved from STRING database considering the disease database search and assigning the cut of 0.4 confidence score (13). This protein-protein interaction (PPI) network is set for 100 most associated genes for GDM. The STRING db uses the Cytoscape version 3.7.0 (www.cytoscape.org) platform to construct a network of interest (14). Moreover, the disease score is one of the attributes obtained from the query. It indicates the association between the retrieved gene and the corresponding disease. The higher the score, the tighter the relationship of that node with the disease of query. The network of 100 related genes of GDM was then characterized for its central foundation known as hubs and bottlenecks. Genes with high centrality values of degree and betweenness centralities are called hubs and bottlenecks, respectively, whose two values are known as hub-bottlenecks. This approach was with the use of NetworkAnalyzer application in Cytoscape (15). Following the identification of hub-bottlenecks of the protein-protein interaction network, differentially expressed miRNAs and their possible targets were created as a map via Cytoscape and its plug-in CluePedia via CluePedia miRanda-miRNAs V5-2012-87-19.txt.gz file and mirecords.umn.edu.validated.miRNAs.2010-11-25.txt.gz. The score of 0.6 as the default one was assigned for the both predicted and validated interactions (16). The ClueGO and CluePedia plugins assessed the gene annotation based on biological processes for genes that were connected to the microRNAs (17). This plug-in provides a pie chart view of gene ontology terms in sets of groups. The criteria for grouping genes for each term here is set as default cutoff options: gene per term: 3, gene percentage per term: 4. The term grouping strength was calculated by kappa statistics and the assigned cutoff was 0.5, (This score is between 0 - 1). In addition, the min and max level of ontology were set to 3 and 8 as the default option, respectively. The corrected method for P value was Bonferroni step down. The adjusted P ≤ 0.05 was obtained for both terms and groups. The groups with highest numbers of terms and the related genes are known as highlighted groups for the dataset query. The enrichment/depletion test for terms was set to two-sided (enrichment/depletion) based on hypergeometric (16, 17).
4. Results
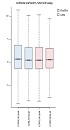
Cross-comparison is used to evaluate if the expression profiles for these two groups of control and GDM are comparable (see Figure 1).

Value distribution presented as boxplot for groups of two healthy and two disease samples. The blue boxes show controls and the pink ones refer to GDMs. Lateral axis: names of samples, longitudinal axis: the genes. The GSM is the identifier for the accession number of each sample. GDM, gestational diabetes mellitus.
As depicted in Figure 1, symmetric distribution of gene expression in each sample is matched with the other samples. This pattern in all samples indicates that there is no disturbance in any samples, and therefore the data are median-centered across samples, and the cross comparison is valid.
In other words, the analysis can proceed and data are valuable for further screening. A number of 87 differentially expressed miRNAs are obtained from the analysis with GEO2R. The next step was to evaluate PPI network analysis of GDM via STRING database (disease query), Cytoscape application. Numbers of 100 most related genes of GDM with the confidence score of 0.5 were queried (the data is not shown). To identify the hub-bottlenecks, the 20% of top central genes with the highest degree and betweenness were determined and the common nodes are list as a 24 hub-bottleneck genes in Table 1.
| Row | Display Name | Degree | BC | Disease Score |
|---|---|---|---|---|
| 1 | INS* | 58 | 0.2 | 3.5 |
| 2 | ALB | 44 | 0.1 | 1.3 |
| 3 | LEP | 41 | 0.04 | 2.5 |
| 4 | IGF1 | 39 | 0.03 | 1.4 |
| 5 | GCG | 38 | 0.05 | 1.5 |
| 6 | ADIPOQ | 38 | 0.04 | 2.5 |
| 7 | IL6 | 36 | 0.03 | 1.7 |
| 8 | PPARG | 35 | 0.04 | 1.6 |
| 9 | TNF | 32 | 0.05 | 1.7 |
| 10 | IRS1 | 28 | 0.01 | 5 |
| 11 | RETN | 28 | 0.01 | 1.9 |
| 12 | IGF2 | 23 | 0.02 | 1.3 |
| 13 | APOB | 22 | 0.008 | 1.1 |
| 14 | GCK | 22 | 0.03 | 5 |
The List of Hub-Bottleneck Elements of the Protein-Protein Interaction Network Analysis from STRING Database for GDM
Correlation between DEmicorRNAs and genes of GDM provides further essential knowledge about its mechanisms. The next step is to identify miRNA target hub-bottleneck genes through CluePedia analysis to explore their relationships. This is a way to get additional information on progression of GDM. A number of 67 microRNAs from 87 queried ones were retrieved in CluePedia and by adding the 14 hub-bottlenecks to these microRNAs together with the genes is 81 nodes and 18 interactions (the data is not shown). For understanding the relationship between these two types of datasets, a regulatory network was aimed to construct as clear in Figure 2 and Table 2.
 of nine genes and 12 microRNAs arrow in purple is validated. All scores are set to 0.6. MicroRNAs are highlighted in red labels and grey nodes while genes are the green nodes with black labels.")
Cooperative miRNAs and their nine common target genes arrow in orange is predicted. Among all the microRNAs and genes, only there are three clusters (A, B, and C) of nine genes and 12 microRNAs arrow in purple is validated. All scores are set to 0.6. MicroRNAs are highlighted in red labels and grey nodes while genes are the green nodes with black labels.
| Row | MicroRNAs | Target Gene | FC | EP |
|---|---|---|---|---|
| 1 | hsa-miR-371a-5p | IL6 | 7.56 | D |
| 2 | hsa-miR-374b-5p | IL6 | 57.30 | D |
| 3 | hsa-miR-365a-3p | IL6 | 16.33 | U |
| 4 | hsa-miR-146b-3p | IL6 | 46.52 | U |
| 5 | hsa-miR-568 | IL6 | 7.80 | U |
| 6 | hsa-miR-574-3p | IL6 | 10.62 | U |
| 7 | hsa-miR-325 | GCG | 10.05 | U |
| 8 | hsa-miR-520e | APOB | 11.47 | U |
| 9 | hsa-miR-145-5p* | APOB, IRS1, RETN, GCG | 37.53 | U |
| 10 | hsa-miR-609 | ALB, IGF2 | 20.40 | D |
| 11 | hsa-miR-583 | ALB | 11.15 | U |
| 12 | hsa-miR-875-5p | TNF, LEP, IRS1 | 14.52 | D |
The List of Differential Expressed MicroRNAs and Their Target Genes (P ≤ 0.05)
FC, EP, D, and U in Table 2, refer to fold change, expression pattern, down-regulation, and up-regulation, respectively. Differential expressed hsa-miR-145-5p, which is listed in the row 9 and assigned with asterisk, is associated with IRS1 with the score of 68 and validated via western blot, qPCR, and reporter assay is based on miRTarBase database as well.
To gain a better insight of hub-bottleneck genes corresponding to these miRNAs, gene annotation and action view was performed via ClueGO + CluePedia (See Figure 3).

A pie chart view of biological processes associated with the query genes. Frequency of each groups is shown based on percentage. **P ≤ 0.001.
5. Discussion
Decoding the molecular mechanisms underlying diseases such as GDM is necessary for the diagnosis and treatment approaches (18). MicroRNAs as a class of noncoding small RNAs with some features of steadiness and flexibility have shown potential in the biomarkers category (19, 20). They are reported to be putative for shedding light into the etiopathogenesis in different disease conditions (21). Linkage between miRNA modification expression and diabetes complications has been suggested by many studies (22-24). In view of this fact, the miRNAs that have crucial influence in GDM pathogenesis are explored by this study in terms of interaction features. Additionally, GDM related genes are also evaluated via network analysis and consequently the relationships between both molecular profiles (DEMs and associated genes) are investigated in terms of interaction properties known as regulatory networks. GEO2R and R statistical analyzer examined the dataset of non-coding RNA profiling by array. The cross-comparison by boxplot indicated that the data are statistically approved for determinations of differential expression profiles of miRNAs between normal and GDM cases. Among the top 250 differentially expressed miRNAs, 87 ones were characterized which were used for more analysis to be included in the regulatory network construction. The genes for the regulatory network analysis, were obtained from protein-protein interaction network analysis of disease query study of GDM from STRING database. The network was analyzed based on topology features, degree and betweenness centrality and a list of the most central ones are obtained as the Table 1. In this table, INS, assigned with asterisk, as the most central gene in the network is also highly related to GDM. These essentials were then analyzed together with DE-miRNAs in CluePedia. It was found that nine genes from 14 hub-bottlenecks of protein-protein interaction network were in relationship with RNAs. Of the 67 miRNAs, 12 ones are in connection with genes, including hsa-miR-371a-5p, hsa-miR-374b-5p, hsa-miR-365a-3p, hsa-miR-146b-3p, hsa-miR-568, hsa-miR-574-3p, hsa-miR-325, hsa-miR-520e, hsa-miR-145-5p, hsa-miR-609, hsa-miR-583, hsa-miR-875-5p. Therefore, not all of the genes showed interactions with the DE-miRNAs. The interacting genes are shown in Figure 2, as three clusters of A, B, and C. In cluster A, IL6 is the gene that is the target of 6 miRNAs. Cluster B, 6 genes namely RETN, IRS1, APOB, GCG, TNF, and LEP are present with 4 miRNAs. In this sub-network, both validated and confirmed interactions exists. In cluster 3, 2 genes of ALB and IGF2 interact with two miRNAs. These genes and miRNAs together may play important role in GDM. Expression modifications of these miRNAs in these three cluster could have impact on the target genes. Based on Table 2, eight of these 12 miRNA are down-regulated whereas four are up-regulated. Besides, the most common DEmiRNAs are hsa-miR-374b-5p, hsa-miR-146b-3p, and hsa-miR-145-5p which are highlighted in light blue. The latest one is targeting the highest number of hub-bottlenecks in the regulatory cluster. The first two, both interacting with IL6. The expression pattern of which is down-regulated for the first one and up-regulation for the two last ones, respectively. In addition, two miRNAs (hsa-miR-875-5p and hsa-miR-145-5p) have the highest numbers of target genes. The first one is down regulated (14.52) and the last one is up regulated (37.53). The fold change measures show that the alterations are high and with great P values (P = 0.008 and P = 0.0008), respectively. To get a more resolution of nominated genes of GDM, a literature survey of the ones of interest was followed. IL6, GCG, APOB, and AlB are selected for further evaluations since they are the most targeted genes in the regulatory network. Among them, ALB as indicated in Table 1, is the most central gene in the network. IL6 is a chemokine that has been reported to be increased in GDM that is the indication of activation of the immune system in this disease (25, 26). GCG as another target for miRNAs, known as glucagon-like-peptide 1 protein, has a validated contribution in GDM. In this disease, GCG as an important insulin regulator, decreases significantly (27). APOB as the other important gene in our category has a potential effect in diabetes risk. Its increment has a link with type 2 diabetes and GDM as an indicator for a later risk of heart disease (28, 29). ALB, the last gene, the low levels of which in serum and increment in urinary of patients with type 2 diabetes has been reported (30, 31). Moreover, the linkage of the hub-bottlenecks of the regulatory network with the four over-significant biological processes groups shows that the query critical genes are involved in more than 80% biological terms which are associated with metabolism especially carbohydrates and lipids. On the whole, most of the miRNAs with differential expression in GDM are up-regulated. Among them, those with highest numbers of targeting (miR-145-5p and hsa-miR-875-5p) in the constructed regulatory network (DE miRNAs + genes associated with GDM) could be more essential. Furthermore, the most targeted hub-bottlenecks known as IL6, GCG, APOB, and ALB in the regulatory network are also crucial. Therefore, the introduced panel of hub-bottlenecks and DEmiRNAs could be the suitable nominees for investigating as biomarkers (as drug targets and diagnostic agents) related to GDM. This analysis is a valuable criterion to validate the screened miRNAs and genes.
5.1. Conclusions
In summary, DE-miRNAs (hsa-miR-145-5p and hsa-miR-875-5p) and targeted genes of IL6, GCG, APOB, and AlB were identified as the key contributors of the regulatory network. These candidates can provide deeper understanding of underlying mechanisms of GDM and can be the significant parts of development and progression of GDM. Consequently, these possible biomarker signatures could be applicable for clinical and medication interventions after applying further validation studies.
