1. Context
Conditions associated with nonalcoholic fatty liver disease (NAFLD) range from hepatic steatosis to nonalcoholic steatohepatitis (NASH), and NAFLD may progress to hepatocellular carcinoma. As the hepatic manifestation of metabolic syndrome (MetS), NAFLD is closely associated with decreased liver cell function, abnormal liver enzymes, lipid profile, and blood glucose level; and increased inflammatory and oxidative stress reactions (1). NAFLD is a risk factor for various chronic diseases, including cardiovascular disease mortality (2).
Vitamin D (VD) is a fat-soluble vitamin, and its active form, 25-hydroxy vitamin D, plays an essential role in human activities. The VD receptor (VDR) is widely distributed in human tissues and organs, including liver tissue (3). In particular, hepatic cells exhibit extensive VDR expression, which is negatively correlated with the histological severity of NAFLD (4). Bjelakovic et al. (5) studied the relationship between VD and chronic liver disease, but because of the small number of experiments and the low quality of evidence, the advantages and disadvantages of VD supplementation were not determined. Sharifi et al. (6) described the effect of VD supplementation in patients with NAFLD, but only qualitatively analyzed the relationship between them. A study found a close association between low serum 25-hydroxyvitamin D concentration and NAFLD severity (7). Many randomized control trials (RCTs) have focused on the effects of VD supplementation in patients with NAFLD (8-18). However, no consensus has been reached on whether VD is effective in improving indicators in patients with NAFLD. Of the conducted RCTs, some have reported improvements in liver histology in patients with NAFLD (10, 12, 14, 15), and some have reported no such beneficial effects (8, 18). Motivated to determine the potential association between VD and NAFLD, we conducted this meta-analysis to investigate the effect of VD supplementation on NAFLD. The primary outcome measures were changes in liver enzymes. we also evaluated the effects of VD supplementation on blood glucose and blood lipids in NAFLD.
2. Methods
2.1. Search Strategy
We searched for relevant articles from inception to May 2019 in PubMed, EMBASE, and the Cochrane Library databases using the following search terms: (1) “Nonalcoholic Fatty Liver Disease” OR “NAFLD” OR “Nonalcoholic Fatty Liver Disease” OR “Fatty Liver, Nonalcoholic” OR “Fatty Livers, Nonalcoholic” OR “Liver, Nonalcoholic Fatty” OR “Livers, Nonalcoholic Fatty” OR “Nonalcoholic Fatty Liver” OR “Nonalcoholic Fatty Livers” OR “Nonalcoholic Steatohepatitis” OR “Nonalcoholic Steatohepatitides” OR “Steatohepatitides, Nonalcoholic” OR “Steatohepatitis, Nonalcoholic” AND “Vitamin D” OR “VD” OR “cholecalciferol” OR “25-Hydroxyvitamin D3.” In addition, we examined the references from the retrieved articles to obtain other missed relevant articles. The task was implemented independently by 2 researchers.
2.2. Inclusion and Exclusion Criteria
We included RCTs published in the English language with a parallel or crossover design in which the studied patients were ≥ 18 years of age with NAFLD. RCTs were included only if the experimental group received VD supplements and the control group did not, with the other conditions being the same between the 2 groups. The exclusion criteria were (1) insufficient data and (2) nonoriginal research (reviews, editorials, or commentaries), abstracts, unpublished studies, and duplicated studies.
2.3. Data Extraction and Quality Assessment
Data were extracted separately by 2 authors, and any inconsistency was resolved through mutual negotiation. Information extracted included (I) general study information (first author’s name, publication year, and study location); (II) detailed information about the study population (sample size, body mass index, age of individuals, presence of other diseases); (III) relevant information about intervention and comparison, including study design, duration, dose, frequency, administration of other supplements, and delivery methods; (IV) outcome variables, including hepatic steatosis, liver enzymes, insulin sensitivity, blood glucose, and lipid profile. Additionally, the outcome data were converted into a mean ± standard deviation.
The Cochrane Collaboration’s tool was used to assess the risk of bias in each RCT. Studies were rated as having low, high, or unclear risk of bias in each of the 7 domains of this method.
2.4. Statistical Analysis
Statistical analysis was performed using STATA software V12.0 (Texas, USA). Standard mean difference (SMD) and 95% CI were used to compare effect sizes between trials with different measurement units. If the scales of outcomes indicated no difference or could be transformed easily, the weighted mean difference (WMD) was used to analyze the differences between the pooled data. Specifically, the result was considered significant at P ≤ 0.05. Heterogeneity between studies was evaluated with the I2 statistic; I2 > 50% suggested significant heterogeneity between the selected studies, and consequently, the random-effects model was used for data analysis. Otherwise, the fixed-effects model was used (19). Egger’s test and Begg’s funnel plots were used to assess potential publication bias (20).
3. Results
3.1. Search Results and Study Characteristics
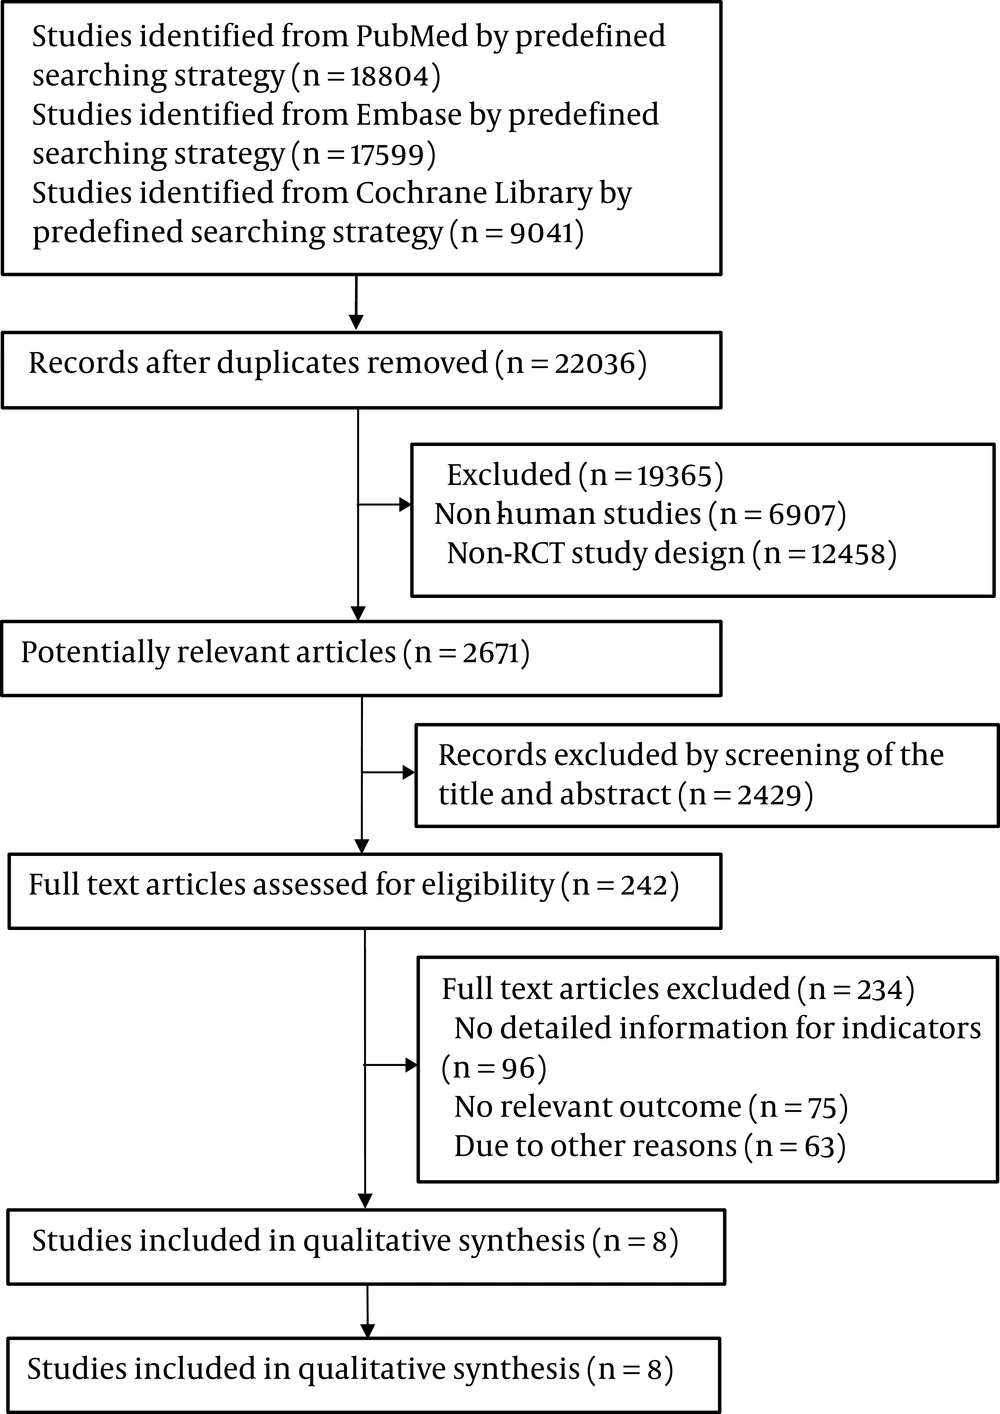
The selection procedure is shown in Figure 1. After screening and selection, eight RCTs met the inclusion and exclusion criteria. An itemized table was used to record relevant data from the trials. The detailed features of the included studies are presented in Table 1. The quality assessment results are presented in Table 2. The eight RCTs were published from 2014 to 2019 and were conducted in different countries. All RCTs administered VD orally once a day, week, or fortnight, with doses ranging from 2,000 IU to 50,000 IU. Two RCTs also administered VD (600,000 IU) by injection. The time of intervention varied from 4 to 48 weeks. The NAFLD was detected through ultrasound echography, magnetic resonance, or biopsy.
| Study | Year | Country | Design | Population, I/C | Age | Time, wk | Intervention | Method | Dose | Frequency | Outcome |
|---|---|---|---|---|---|---|---|---|---|---|---|
| Barchetta et al. (8) | 2016 | Italy | R, D, P | 26/29 | 49 - 69 | 24 | VD3 | Oral | 2000 IU | Daily | HFF, AST, ALT, FBG, lipid profile, HOMA-IR |
| Dabbaghmanesh et al. (9) | 2018 | Iran | R, D, P | 31/28/32 | 20 - 75 | 12 | VD3/calcitriol | Oral | 50000 IU/25 µg | Daily | AST, ALT, FBS, lipid profile |
| Foroughi et al. (11) | 2014 | Iran | R, D, P | 30/30 | 30 - 70 | 10 | VD3 | Oral | 50000 | Weekly | AST, ALT, lipid profile |
| Geier et al. (12) | 2018 | Switzerland | R, D, P | 8/10 | 23 - 63 | 48 | VD3 | Oral | 2100 IU | Daily | ALT, AST, HDL, LDL, FBG, NAS |
| Lorvand Amiri et al. (14) | 2017 | Iran | R, D, P | 37/37/36 | 18 - 65 | 12 | calcitriol | Oral | 25 µg | Daily | Fatty liver grade, AST, ALT, FBG, Insulin, lipid profile, HOMA-IR |
| Mansourian Hosseini et al. (15) | 2018 | Iran | R, P | 37/38 | 29 - 41 | 4 | VD3 | Injection | 600000 IU | Once | Fatty liver grade, AST, ALT, ALP, HOMA-IR, FBG |
| Sakpal et al. (17) | 2017 | India | R, P | 51/30 | 37 - 40 | 24 | VD3 | Injection | 600000 IU | Once | ALT, HOMA-IR, Insulin |
| Sharifi et al. (18) | 2014 | Iran | R, D, P | 27/26 | 18 - 70 | 16 | VD3 | Oral | 50000 IU | Biweekly | AST, ALT, fatty liver grade, FBG, HOMA-IR |
Abbreviations: ALP, alkaline phosphatase; ALT, alanine aminotransferase; AST, aspartate aminotransferase; C, control group; D, double blinding; FBG, fasting blood glucose; HFF, hepatic fat fraction; HOMA-IR, homeostatic model assessment of insulin resistance; I, intervention group; NAS, NAFLD activity score; R, randomized control trail; P, parallel; VD3, vitamin D3.
| Study | Random Sequence Generation | Allocation Concealment | Blinding | Observation Bias | Loss to Follow-Up | Selective Reporting | Other Bias |
|---|---|---|---|---|---|---|---|
| Barchetta et al. | Yes | Yes | Yes | No | Yes | No | Yes |
| Dabbaghmanesh et al. (9) | Yes | Yes | Yes | No | Yes | No | No |
| Foroughi et al. (11) | Yes | Yes | Yes | No | Yes | No | Unclear |
| Geier et al. (12) | Yes | Yes | Yes | No | Yes | No | No |
| Lorvand Amiri et al. | Yes | Yes | Yes | No | Yes | No | Unclear |
| Mansourian Hosseini et al. (15) | Yes | No | No | No | Yes | No | Yes |
| Sakpal et al. (17) | Yes | No | No | No | Yes | No | Yes |
| Sharifi et al. | Yes | Yes | Yes | No | Yes | No | No |
3.2. Effects of VD Supplementation on Hepatic Steatosis
Five trials investigated the effect of VD supplementation on hepatic steatosis. Because of the small number of articles, with most of them being written descriptions without data, the meta-analysis was not conducted. Changes in hepatic steatosis were evaluated using liver biopsy in 2 studies (2, 10). The pooled results reported that VD supplementation reduced the NAFLD activity score (NAS) and improved liver histology (10, 12). Ultrasound echography was used to measure the grade of fatty liver in 4 studies (8, 14, 15, 18). Two of four studies found the grade of NAFLD decreased in patients with NAFLD who received VD supplementation (14, 15).
3.3. Effects of VD Supplementation on Liver Enzymes
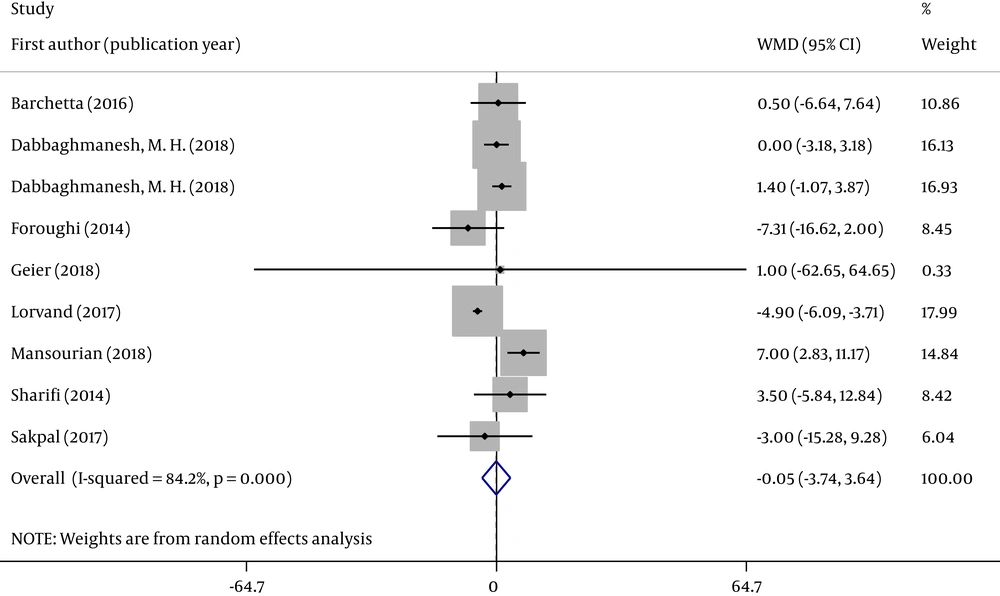
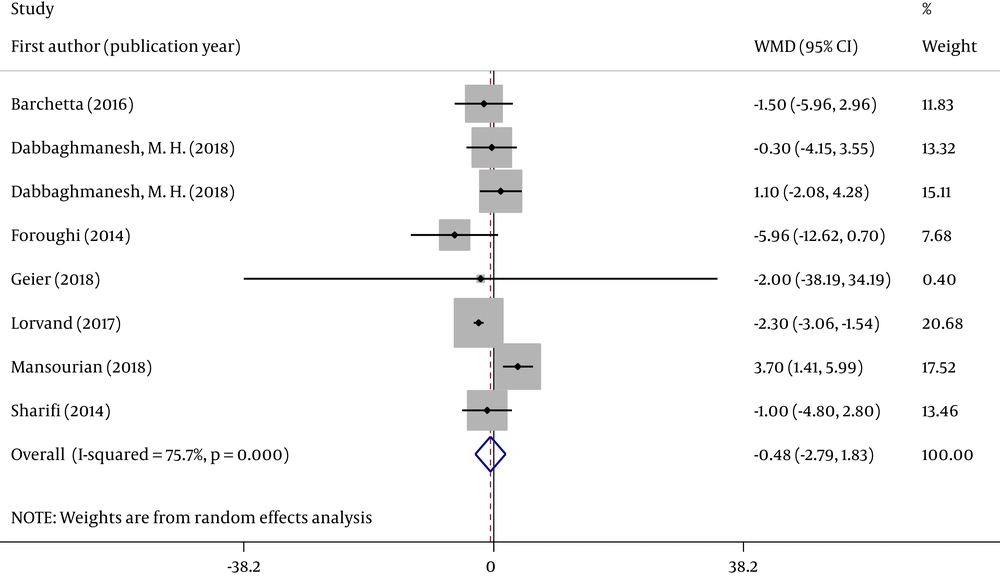
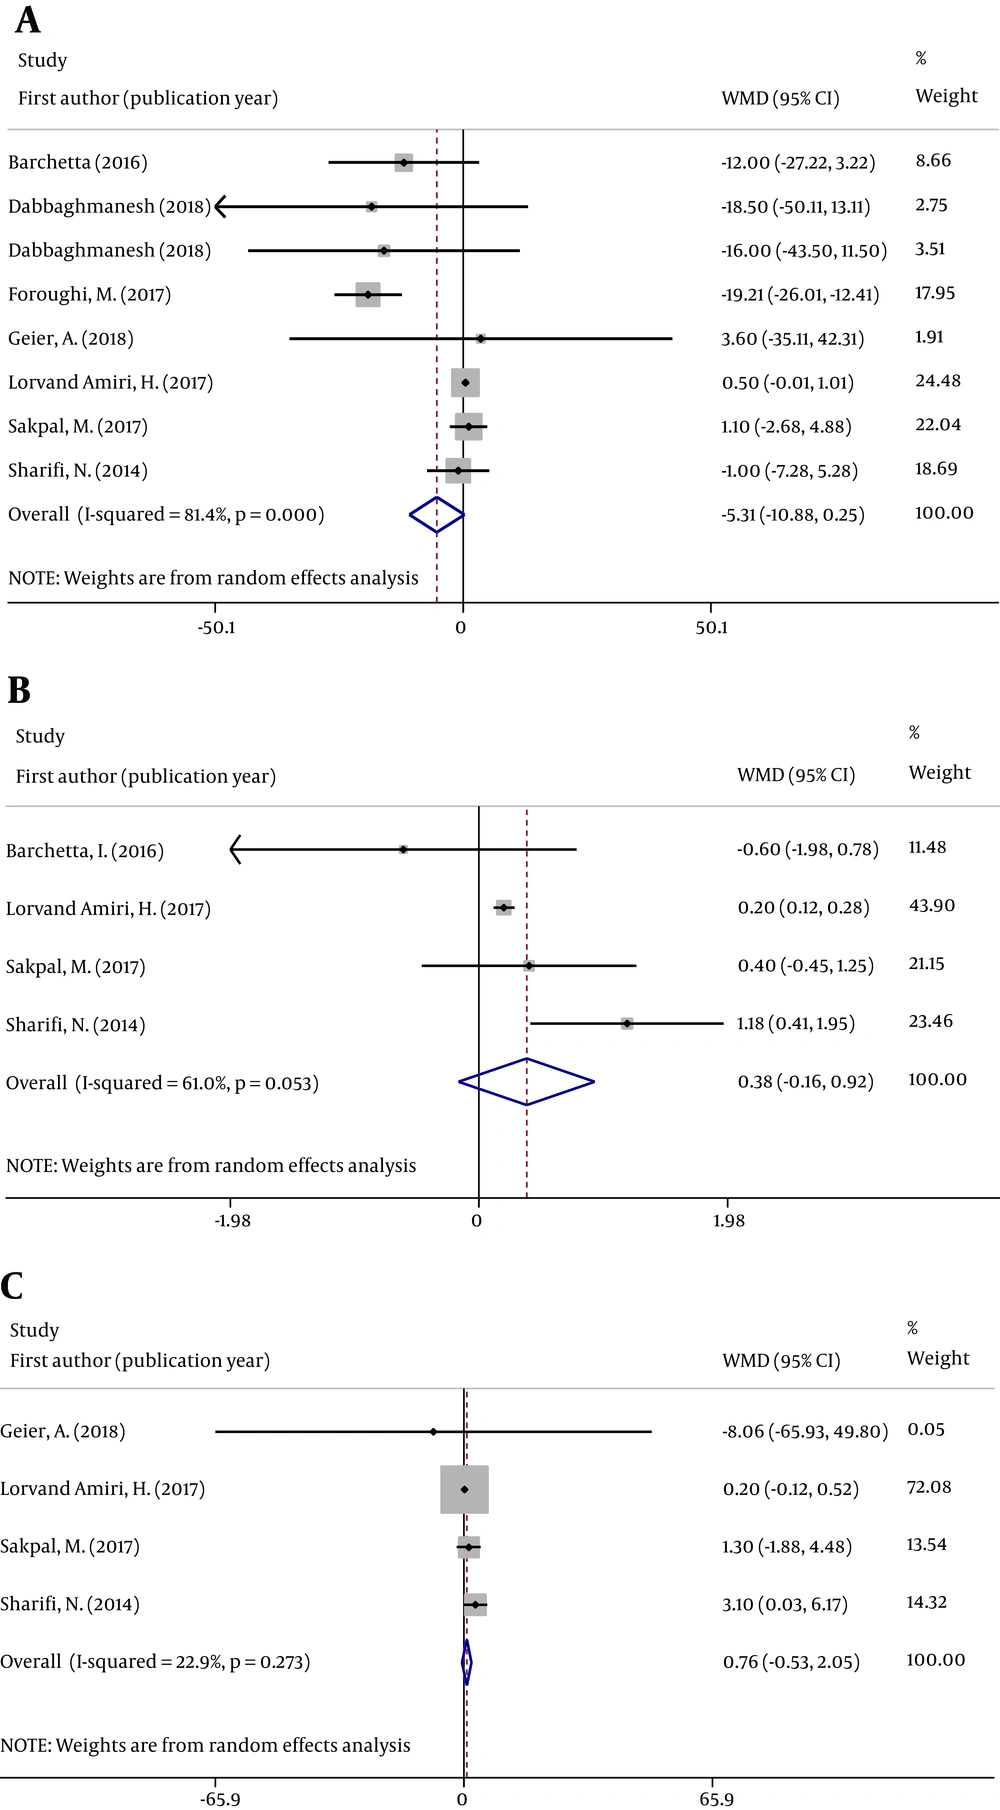
We analyzed the concentration of two serum liver enzymes (ALT and AST). Forest plots were used to assess the effects of oral VD supplementation (Figures 2 and 3).
All eight RCTs analyzed changes in serum ALT and AST concentrations in individuals with NAFLD between groups. Figures 2 and 3 reveal that the pooled ALT (WMD = -0.052; 95% CI: -3.740, 3.636; P = 0.978) and AST (WMD = -0.479; 95% CI: -2.791, 1.833; P = 0.685) results were no significantly different between the 2 groups. The tests for heterogeneity were highly significant [ALT (I2 = 84.2%, P < 0.001) and AST (I2 = 75.7%, P < 0.001)].
Sensitivity analysis indicated that the effect of VD supplementation on ALT and AST was not changed by removing any one of the studies at a time. When studies with ≥ 1 high risk of bias were excluded, the overall effect size was not significantly changed for two indicators (Appendix 1 in Supplementary File).
Subgroup analysis revealed no differences in the types of VD supplementation; supplementation duration; the number of individuals with VD deficiency; and the dose, frequency, and route of administration of VD supplements (Table 3).
| Subgroup | ALT | AST | ||||
|---|---|---|---|---|---|---|
| Number | WMD (95% CI) | I2, % | Number | WMD (95% CI) | I2, % | |
| VD type | ||||||
| Cholecalciferol | 7 | 1.164 (-2.655, 4.982) | 48.7 | 6 | -0.277 (-3.190, 2.636) | 59.3 |
| Calcitriol | 2 | -1.847 (-8.018, 4.324) | 95.1 | 2 | -0.964 (-4.219, 2.290) | 76 |
| Population deficient in VD | ||||||
| Yes | 7 | 0.649 (-3.608, 4.907) | 87.7 | 6 | 0.201 (-2.544,2.946) | 81.5 |
| No | 2 | -2.811 (-10.375, 4.754) | 41.2 | 2 | -3.018 (-7.160, 1.124) | 15.9 |
| Intervention time, wk | ||||||
| > 12 | 5 | -0.320 (-4.855, 4.215) | 91.7 | 5 | -0.285 (-3.400, 2.831) | 86.1 |
| ≤ 12 | 4 | 0.798 (-4.337, 5.933) | 0.0 | 3 | -1.215 (-4.098, 1.668) | 0.0 |
| Dose, IU | ||||||
| > 2100 | 5 | 1.164 (-2.655, 4.982) | 0.0 | 4 | -0.135 (-3.759, 3.490) | 72.4 |
| ≤ 2100 | 2 | 1.048 (-3.798, 5.894) | 65.5 | 2 | -1.507 (-5.936, 2.921) | 0.0 |
| Frequency | ||||||
| Daily | 3 | 0.085 (-2.817, 2.986) | 0.0 | 3 | -0.820 (-3.727, 2.087) | 0.0 |
| Not daily | 4 | 0.983 (-6.157, 8.123) | 66.3 | 3 | -0.352 (-5.420, 4.716) | 79.9 |
| Method | ||||||
| Oral | 7 | -1.735 (-5.178, 1.708) | 77.6 | 7 | -1.753 (-2.835, -0.671) | 9.9 |
| Injection | 2 | 6.417 (2.606, 10.229) | 0.0 | 1 | 3.700 (1.410, 5.990) | 0.0 |
3.4. Effects of VD Supplementation on Insulin Resistance, Glucose Metabolism, and Lipid Profile
In seven articles, parameters of glucose metabolism were described for patients with NAFLD receiving VD supplementation. Forest plots and result analyses were conducted independently according to different research methods.
There was a neutral effect on fasting blood glucose (FBG), homeostatic model assessment of insulin resistance (HOMA-IR), and serum insulin concentrations between the VD and placebo groups. Figure 4 displays the effects of VD supplementation on the pooled results in patients with NAFLD with respect to FBG (WMD = 0.466; 95% CI -5.313, -10.879; P = 0.061), HOMA-IR (WMD = 0.380, 95% CI: -0.162, 0.923; P = 0.169), and serum insulin concentration (WMD = 0.760; 95% CI: -0.532, 2.052; P = 0.249).
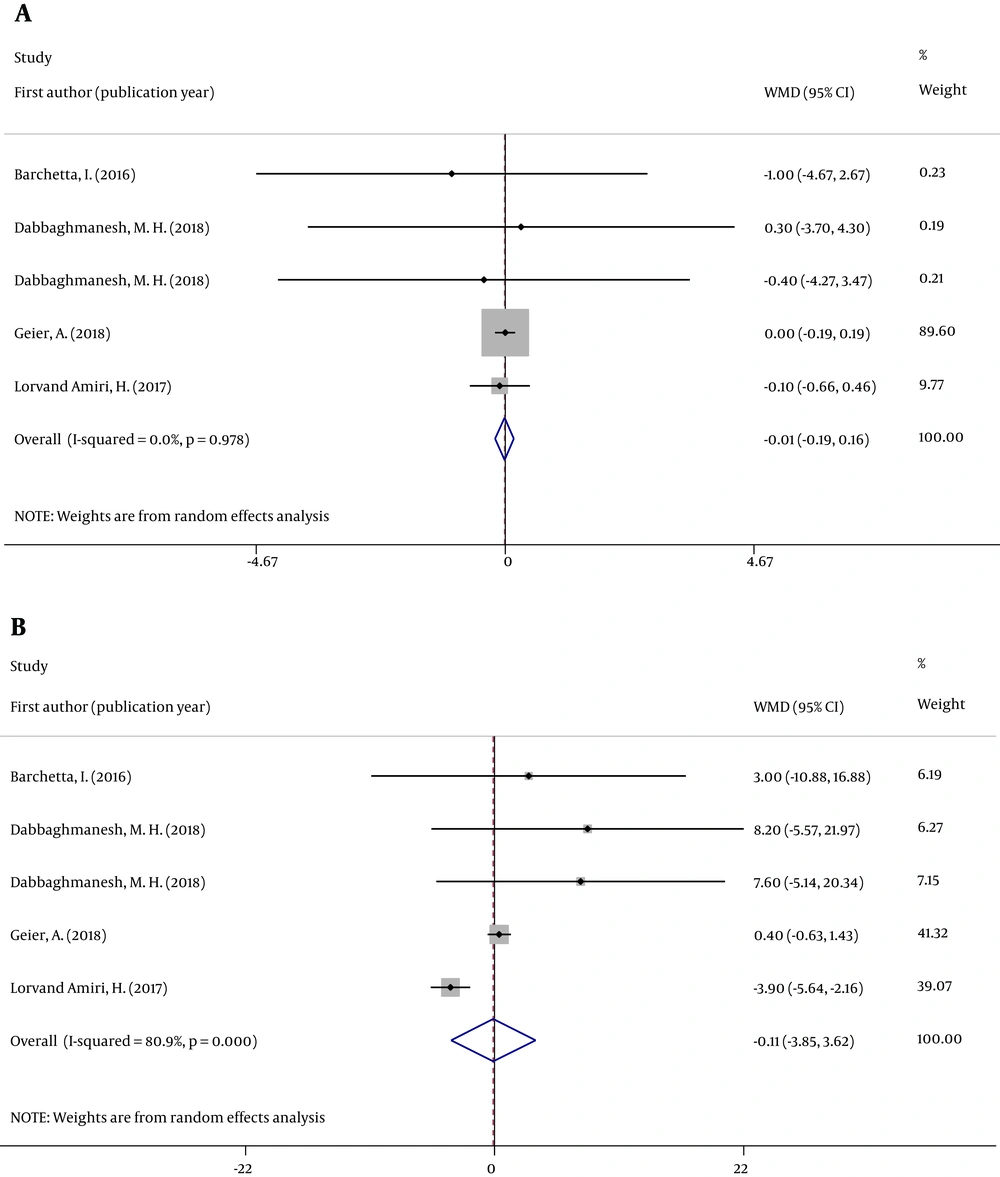
The pooled high-density lipoprotein (HDL) (WMD = -0.012; 95% CI: -0.188, 0.164; P = 0.891) and low-density lipoprotein (WMD = -0.115; 95% CI: -3.849, -3.620; P = 0.952) values were not significantly different between the groups (Figure 5).
4. Discussion
This meta-analysis evaluated the effects of VD supplementation on patients with NAFLD by measuring changes in 4 indicators before and after treatment: hepatic steatosis, liver enzymes, glucose metabolism parameters, and lipid profile. We found that none of these parameters were significantly different in patients with NAFLD between the intervention and control groups.
Low 25-hydroxyvitamin D concentration is closely associated with NAFLD, and a previous meta-analysis indicated that serum 25-hydroxyvitamin D concentrations in individuals with NAFLD/NASH were lower than those in individuals without NAFLD/NASH (21, 22). However, the levels of the liver enzyme, lipid profile, and glucose metabolism parameters were not significantly different between patients with NAFLD with VD deficiency (< 20 ng/mL), receiving VD supplementation and those receiving placebo based on our meta-analysis. The selected studies had employed different criteria regarding serum concentration of VD in patients with NAFLD, ranging from 15 ng/mL to 30 ng/mL. No relationship was found between the changes in the VD level and the changes in other outcome parameters. This might suggest that VD supplementation is more effective when the serum VD concentration is relatively low and plays a minor role when the level returns to normal. Because of the small number of participants, the subgroup analysis did not confirm this speculation, and more experiments are needed to verify it. Some studies did not evaluate the stage of NAFLD in enrolled patients at the outset of the study. It is possible that VD supplementation is more effective in the early stages of liver fibrosis but not in the later stages (10). Of the included studies, only 1 investigated differences between the sexes in both the inclusion criteria and the analysis (18). We speculated that the effects of VD supplementation may also differ with respect to sex, but we could not analyze the differences because of inadequate data. In addition, the treatment duration ranged from 4 weeks to 48 weeks, the dose ranged from 800 IU to 600,000 IU, and the route and frequency of VD administration were also different among studies. However, subgroup analysis of the treatment duration and dose revealed no differences. Because of various metabolic activities, even when the same amount is administered, the amount of active VD entering the bloodstream varies depending on the route of administration. From the perspective of using VD as an adjuvant treatment for NAFLD, future studies should explore the relationship between the change in the amount of active VD in blood with respect to the outcome parameters.
Ultrasound echography was used to diagnose NAFLD and hepatic steatosis in seven trials, two of which identified decreasing hepatic steatosis and grades of fatty liver in the VD supplementation group. Two trials were performed on liver biopsies to evaluate the condition of patients with NAFLD and found that liver histology and NAS improved in patients with NAFLD after oral VD supplementation. Liver biopsy is an approach for semiquantitative assessment of NAFLD and precise evaluation of steatosis, but its application in RCTs is limited (23). Elastography techniques are widely popular in the diagnosis of chronic liver diseases, but they are not as precise as liver biopsy because of the inherent subjectivity in the detection of the levels of liver inflammation and fibrosis (24). Liver biopsy remains the gold standard of diagnosing NAFLD or NASH. We recommend using liver biopsy to definitively diagnose NAFLD and assess the level of hepatic steatosis as far as possible.
Notably, Lorvand et al. (14), in another study, administered 25 µg/day calcitriol plus 500 mg/day calcium supplements. Although this study was not included in this meta-analysis, the results revealed that triglycerides (TG), HDL, FBG, HOMA-IR, and serum insulin concertation changed significantly after the intervention. Lipid profile and glucose metabolism parameters and HOMA-IR levels play a critical role in the development of NAFLD and are generally used as the secondary outcome measures for assessing NAFLD severity (25). Epidemiological studies have indicated that a decrease in serum calcium concentration leads to a decrease in the number of patients with MetS (26). Therefore, the significant difference between the intervention and control groups might be due to VD and Ca co-administration and not VD alone (14).
Della Corte et al. (10) conducted a 48-week RCT that enrolled 41 patients with NAFLD and VD deficiency; the patients randomly received 800 IU VD plus 500 mg docosahexaenoic acid (DHA) or placebo daily following a lifestyle intervention program comprising a reduction of 25 - 30 Kcal/kg/day and engagement in physical activity for 1 h twice per week. They found improved NAS, reduced hepatic stellate cells (HSC) activation, and a near-significant decrease in TG and HOMA-IR in patients with VD plus Ca supplementations (10). Omega-3 fatty acids can lower liver fat percentage and improve liver fibrosis biomarker scores in patients with NAFLD (27). Scorletti et al. (27) reported that 15 - 16 months of supplementation with the omega-3 fatty acid DHA and eicosatetraenoic acid (EPA) significantly decreased serum TG concentration in patients with NAFLD. Thus, VD supplementation in combination with omega-3 fatty acids might be a potential therapeutic strategy for NAFLD.
Mansourian Hosseini et al. (15) conducted a 4-week RCT that enrolled 82 patients with NAFLD who were randomly assigned to the intervention group receiving a single intramuscular injection of 600,000 IU cholecalciferol or the control group receiving pearl of vitamin E (VE) 400 IU/day. Liver enzymes, NAFLD severity, HOMA-IR, FBG, and adiponectin were significantly different between the two groups. The effectiveness of VE, a powerful antioxidant, has been demonstrated extensively in the treatment of NAFLD; it can improve hepatic steatosis and inflammation in patients with NASH (28). Also, VE improved FBG, HOMA-IR, and insulin in another RCT (29). We expect that the combination of VD and VE supplements can lead to a better effect in the treatment of NAFLD.
A systematic review and meta-analysis on NAFLD was published in 2017 by Tabrizi et al. (30). We have some strengths compared with their study. We included many studies that were published in the last 3 years, which were from different countries. We revealed that VD plus other nutritional elements (calcium, omega-3 fatty acids, or VE) might be beneficial in the treatment of NAFLD, which should be evaluated by future studies. A limitation of our study is that the results showed high heterogeneity; sensitivity analysis was conducted to explore the source of heterogeneity. The total number of patients included was small, which indicates that more trials are warranted to examine the relationship between VD and NAFLD-related indicators.
5. Conclusions
The present meta-analysis indicates that VD supplementation has no effects on liver enzymes, glucose metabolism parameters, and lipid profile in patients with NAFLD. However, we found potential benefits in patients with NAFLD when VD supplementation was combined with Ca, VE, or omega-3 fatty acid supplementation or lifestyle intervention. More RCTs on VD supplements alone or in combination with other therapies need to be designed to explore the effects of VD in patients with NAFLD.
