


1. Background
Addiction, as a pleasure-seeking dysfunction characterized by tolerance and relapse, is one of the most pervasive and enduring health problems in societies (1). Confronting denial as the first obstacle to such an intangibly contagious phenomenon spreading in the underbelly of society is not possible without constant active surveillance. Yet, not only is there no such routine procedure in the Iranian national health system, there has not been a single independent epidemiological report for a decade. The two latest reports were conducted almost simultaneously in 2013, both surveying university students and revealing the lifetime prevalence of hookah (24.0% and 14.9%), cigarettes (17.0% and 26.3%), alcohol (13.0% and 19.9%), and marijuana (5.2% and 7.1%) in Jahrom and Tehran, respectively. The first article reported only the age of first consumption for all types of substances (16.5 ± 3.6 years for males and 17.3 ± 3.6 years for females with P > 0.05), and the second article reported two ages of first consumption for cigarettes (18.33 years) and alcohol (18.6 years) without standard deviation and gender distinction. The reported frequency of consumption is ambiguous and misclassified. In the first study, the frequency is differentiated by the two titles of occasional and sustained usage without specifying quantitative criteria that are considerable for hookah (5.1% and 4.1%), cigarettes (2.5% and 4.1%), and alcohol (2.3% and 2.9%). The other article noted an everyday prevalence which is considerable for cigarettes (8.5%), alcohol (3.1%), and marijuana (0.5%). In addition, the second article mentioned the gender similarity for cigarettes and alcohol (2, 3).
The prevalence of addictive substances consumption, usually referred to as lifetime prevalence, is an inadequate concept that includes all individuals who have used a substance at least once in their whole life. While this broad concept is informative as it indicates the penetration coefficient of a substance, it does not reflect the addictive aspect of consumption at all. The frequency of consumption repetition, which is pivotal for capturing the social conditions of addictive behavior, was omitted from lifetime prevalence, and attempts to conceptualize it led to vague results. A misunderstanding of reality can be avoided by asking a single quantitative Likert-scale question about the frequency of consumption in a given period. Using the last month as an achievable time period for estimating consumption frequency, this study attempts to discriminate between three cumulative definitions for addictive substance consumption prevalence:
- Lifetime prevalence: Includes whoever has used a substance at least once in their whole life.
- Last month prevalence: Includes whoever has used a substance at least once in the last month.
- Excessive prevalence: Includes levels higher than the cut-off in a Likert-scale variable that measures the last month consumption frequency.
2. Materials and Methods
People were invited to participate in the research through non-probabilistic voluntary sampling by distributing flyers containing a brief explanation, the weblink and associated barcode to the online questionnaire, and a request to share. The preservation of anonymity and the necessity for the participation of nonusers were also noted in the flyers. In the fall of 2023, 5,000 flyers were distributed on university campuses among students of the University of Tehran (UT) and Tehran University of Medical Sciences (TUMS), and 3,000 flyers were distributed among people in public parks from different socioeconomic areas in Tehran (two sampling biases were excluded: Special parks that are illustrious centers for consumer gatherings were intentionally avoided, and older people were ignored with an excuse). In the fall of 2024, 4,500 flyers were distributed in the same way in public parks, and 3,000 flyers were distributed among the general population at subway entrances from different socioeconomic areas in Tehran.
| Variables | Lifetime Prevalence | ||||
|---|---|---|---|---|---|
| Last Month Prevalence | |||||
| Excessive Prevalence | |||||
| Hookah | No consumption | Once | Two to four times | Up to eight times | More than eight times |
| Cigarettes | No consumption | Less than a pack | Up to three packs | Up to ten packs | More than ten packs |
| Alcohol | No consumption | Once | Two or three times | Up to ten times | More than ten times |
| Marijuana | No consumption | Once | Two or three times | Up to ten times | More than ten times |
| Psychiatrics | No consumption | Once or twice | Up to five times | Up to ten times | More than ten times |
| Opium | No consumption | Once | Two or three times | Up to ten times | More than ten times |
| Hashish | No consumption | Once | Two or three times | Up to ten times | More than ten times |
An online questionnaire designed by the researcher, surveyed three demographic items (gender, year of birth, and university/occupation); one to three questions depending on the first answer for each of the seven substances: Hookah, cigarettes, alcohol, marijuana, hashish, opium, and psychiatrics (any effective drug on the mind, taken without prescription, such as Tramadol, Zolpidem, Ritalin, Clonazepam, Diazepam, etc.), including lifetime experience, the year of first consumption, and a Likert-scale question about the last month consumption frequency (Table 1); and only one question on lifetime experience with each of the four substances: The LSD, ecstasy, crystal, and heroin. The preservation of anonymity, the necessity for the participation of nonusers, and the ethical approval of the research were expressed on the first page of the questionnaire and concluded with obtaining informed consent. The study protocol was approved according to the code of ethics IR.KAUMS.MEDNT.REC.1401.015. To prepare the results, rows with inconsistent data, such as the start of consumption before birth, were completely excluded. Furthermore, when comparing gender-specific differences, the category "others" beyond the binary categories "females" (F) and "males" (M) was excluded, as the number of this group is very small, which makes statistical analysis meaningless.
2.1. Participants
1. The UT and TUMS students (Fall 2023): 1,105 Persons (898 UT, 207 TUMS), (gender: Fifty percent females, 49% males, 1% others; age = 17 - 42 years; mean ± SD = 22 ± 3.5 years)
2. Public parks (Fall 2023): 252 Persons (gender: Forty percent females, 58% males, 2% others; age = 15 - 46 years; mean ± SD = 25 ± 7.8 years), ((includes 89 university students (gender: Sixty percent females, 37% males, 3% others; age = 16 - 39 years; mean ± SD = 22 ± 3.4 years))
3. Public parks (Fall 2024): 451 Persons (gender: Thirty-six percent females, 63% males, 1% others; age = 14 - 45 years; mean ± SD = 25 ± 6.1 years), ((includes 118 university students (gender: Fifty-two percent females, 46% males, 2% others; age = 18 - 36 years; mean ± SD = 22 ± 3.1 years))
4. Subway entrances (Fall 2024): 375 Persons (gender: Fifty-seven percent females, 42% males, 1% others; age = 15 - 61 years; mean ± SD = 26 ± 8.9 years), ((includes 164 university students (gender: Fifty-four percent females, 46% males, 0% others; age = 18 - 35 years; mean ± SD = 22 ± 3.0 years))
2.2. Statistical Analysis
Prevalence rates were compared between groups using chi-squared test with Yates' continuity correction. The age of first consumption was compared between groups using the Welch Two Sample t-test. All procedures were performed with R.
3. Results
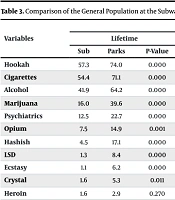
The results are presented in six tables: Based on each substance (Table 1), results from university students sampled on campus and the general population sampled at the subway entrances (Table 2), comparison of the general population at the subway entrances and the public parks sample (Table 3), longitudinal comparison of the public parks results (Table 4), results comparing gender differences (Table 5), and results from university students from different sample groups (Table 6).
| Variables | UT and TUMS Students (Fall 2023) | General Population at Subway Entrances (Fall 2024) | ||||||
|---|---|---|---|---|---|---|---|---|
| Lifetime | Last Month | Excessive | Start Age | Lifetime | Last Month | Excessive | Start Age | |
| Hookah | 45.4 | 12.5 | 1.5 | 17 ± 4 | 57.3 | 17.6 | 2.7 | 18 ± 6 |
| Cigarettes | 50.9 | 34.2 | 10.7 | 18 ± 3 | 54.4 | 32.0 | 8.5 | 19 ± 6 |
| Alcohol | 37.8 | 20.5 | 3.6 | 18 ± 3 | 41.9 | 20.5 | 2.7 | 20 ± 6 |
| Marijuana | 15.3 | 5.3 | 1.3 | 20 ± 3 | 16.0 | 4.3 | 1.9 | 22 ± 5 |
| Psychiatrics | 10.0 | 2.8 | 1.0 | 19 ± 4 | 12.5 | 3.7 | 1.6 | 24 ± 8 |
| Opium | 2.5 | 0.4 | 0.0 | 19 ± 7 | 7.5 | 2.9 | 0.5 | 22 ± 6 |
| Hashish | 2.4 | 0.5 | 0.2 | 20 ± 3 | 4.5 | 0.5 | 0.3 | 21 ± 4 |
| LSD | 1.1 | - | - | - | 1.3 | - | - | - |
| Ecstasy | 0.2 | - | - | - | 1.1 | - | - | - |
| Crystal | 0.4 | - | - | - | 1.6 | - | - | - |
| Heroin | 0.2 | - | - | - | 1.6 | - | - | - |
Abbreviations: UT, University of Tehran; TUMS, Tehran University of Medical Sciences.
a Values are expressed as prevalence (%) or mean ± SD.
| Variables | Subway Entrances vs. Public Parks (Fall 2024) | |||||||||||
|---|---|---|---|---|---|---|---|---|---|---|---|---|
| Lifetime | Last Month | Excessive | Start Age | |||||||||
| Sub | Parks | P-Value | Sub | Parks | P-Value | Sub | Parks | P-Value | Sub | Parks | P-Value | |
| Hookah | 57.3 | 74.0 | 0.000 | 17.6 | 28.9 | 0.067 | 2.7 | 4.9 | 0.379 | 18 ± 6 | 16 ± 5 | 0.000 |
| Cigarettes | 54.4 | 71.1 | 0.000 | 32.0 | 53.1 | 0.000 | 8.5 | 28.4 | 0.000 | 19 ± 6 | 17 ± 5 | 0.000 |
| Alcohol | 41.9 | 64.2 | 0.000 | 20.5 | 40.7 | 0.004 | 2.7 | 10.7 | 0.004 | 20 ± 6 | 18 ± 5 | 0.000 |
| Marijuana | 16.0 | 39.6 | 0.000 | 4.3 | 18.2 | 0.012 | 1.9 | 12.4 | 0.003 | 22 ± 5 | 19 ± 5 | 0.002 |
| Psychiatrics | 12.5 | 22.7 | 0.000 | 3.7 | 7.8 | 0.705 | 1.6 | 4.2 | 0.434 | 24 ± 8 | 20 ± 5 | 0.009 |
| Opium | 7.5 | 14.9 | 0.001 | 2.9 | 4.2 | 0.305 | 0.5 | 2.4 | - | 22 ± 6 | 20 ± 6 | 0.125 |
| Hashish | 4.5 | 17.1 | 0.000 | 0.5 | 4.4 | - | 0.3 | 1.1 | - | 21 ± 4 | 19 ± 6 | 0.165 |
| LSD | 1.3 | 8.4 | 0.000 | - | - | - | - | - | - | - | - | - |
| Ecstasy | 1.1 | 6.2 | 0.000 | - | - | - | - | - | - | - | - | - |
| Crystal | 1.6 | 5.3 | 0.011 | - | - | - | - | - | - | - | - | - |
| Heroin | 1.6 | 2.9 | 0.270 | - | - | - | - | - | - | - | - | - |
a Values are expressed as prevalence (%) or mean ± SD.
| Variables | Public Parks (Fall 2023 vs. Fall 2024) | |||||||||||
|---|---|---|---|---|---|---|---|---|---|---|---|---|
| Lifetime | Last Month | Excessive | Start Age | |||||||||
| 2023 | 2024 | P-Value | 2023 | 2024 | P-Value | 2023 | 2024 | P-Value | 2023 | 2024 | P-Value | |
| Hookah | 68.4 | 74.0 | 0.183 | 17.2 | 28.9 | 0.005 | 3.6 | 4.9 | 0.878 | 17 ± 9 | 16 ± 5 | 0.150 |
| Cigarettes | 67.2 | 71.1 | 0.291 | 46.0 | 53.1 | 0.215 | 22.8 | 28.4 | 0.018 | 17 ± 11 | 17 ± 5 | 0.275 |
| Alcohol | 58.0 | 64.2 | 0.141 | 30.8 | 40.7 | 0.055 | 5.2 | 10.7 | 0.055 | 18 ± 10 | 18 ± 5 | 0.799 |
| Marijuana | 29.6 | 39.6 | 0.011 | 12.0 | 18.2 | 0.463 | 8.0 | 12.4 | 0.671 | 20 ± 5 | 19 ± 5 | 0.384 |
| Psychiatrics | 20.8 | 22.7 | 0.718 | 6.4 | 7.8 | 0.858 | 2.0 | 4.2 | 0.269 | 22 ± 6 | 20 ± 5 | 0.157 |
| Opium | 13.2 | 14.9 | 0.701 | 3.2 | 4.2 | 0.936 | 0.8 | 2.4 | - | 22 ± 6 | 20 ± 6 | 0.089 |
| Hashish | 14.4 | 17.1 | 0.475 | 2.0 | 4.4 | 0.275 | 1.2 | 1.1 | - | 20 ± 5 | 19 ± 6 | 0.306 |
| LSD | 7.2 | 8.4 | 0.757 | - | - | - | - | - | - | - | - | - |
| Ecstasy | 5.2 | 6.2 | 0.807 | - | - | - | - | - | - | - | - | - |
| Crystal | 4.0 | 5.3 | 0.646 | - | - | - | - | - | - | - | - | - |
| Heroin | 2.8 | 2.9 | 1 | - | - | - | - | - | - | - | - | - |
a Values are expressed as prevalence (%) or mean ± SD.
| Variables | Lifetime | Last Month | Excessive | Start Age | ||||||||
|---|---|---|---|---|---|---|---|---|---|---|---|---|
| F | M | P | F | M | P | F | M | P | F | M | P | |
| UT and TUMS Students (Fall 2023) | ||||||||||||
| Hookah | 45.4 | 12.5 | 1.5 | 17 ± 4 | ||||||||
| 41.4 | 49.6 | 0.008 | 10.1 | 15.1 | 0.157 | 1.3 | 1.7 | - | 17.1 | 16.1 | 0.008 | |
| Cigarettes | 50.9 | 34.2 | 10.7 | 18 ± 3 | ||||||||
| 50.8 | 50.2 | 0.884 | 30.3 | 37.3 | 0.000 | 6.9 | 14.7 | 0.000 | 18.3 | 17.7 | 0.047 | |
| Alcohol | 37.8 | 20.5 | 3.6 | 18 ± 3 | ||||||||
| 37.3 | 37.1 | 1 | 19.5 | 20.9 | 0.465 | 3.1 | 4.1 | - | 18.9 | 17.8 | 0.001 | |
| Marijuana | 15.3 | 5.3 | 1.3 | 20 ± 3 | ||||||||
| 11.7 | 18.3 | 0.003 | 3.4 | 6.7 | 0.411 | 0.7 | 1.7 | - | 20.2 | 19.9 | 0.587 | |
| Psychiatrics | 10.0 | 2.8 | 1.0 | 19 ± 4 | ||||||||
| 9.2 | 10.1 | 0.694 | 3.2 | 2.2 | 0.206 | 1.1 | 0.9 | - | 19.5 | 18.6 | 0.307 | |
| Opium | 2.5 | 0.4 | 0.0 | 19 ± 7 | ||||||||
| 1.3 | 3.9 | 0.010 | 0.2 | 0.6 | - | 0.0 | 0.0 | - | 17.9 | 18.8 | 0.812 | |
| Hashish | 2.4 | 0.5 | 0.2 | 20 ± 3 | ||||||||
| 0.9 | 3.7 | 0.003 | 0.2 | 0.6 | - | 0.2 | 0.2 | - | 20.2 | 19.4 | 0.632 | |
| Public Park (Fall 2023) | ||||||||||||
| Hookah | 68.4 | 17.2 | 3.6 | 17 ± 9 | ||||||||
| 62.4 | 73.1 | 0.100 | 15.8 | 18.6 | 1 | 3.0 | 4.1 | - | 16.6 | 16.9 | 0.862 | |
| Cigarettes | 67.2 | 46.0 | 22.8 | 17 ± 11 | ||||||||
| 64.4 | 68.3 | 0.614 | 40.6 | 49.7 | 0.257 | 12.9 | 29.7 | 0.002 | 17.6 | 15.8 | 0.332 | |
| Alcohol | 58.0 | 30.8 | 5.2 | 18 ± 10 | ||||||||
| 57.4 | 58.6 | 0.956 | 29.7 | 31.7 | 0.912 | 2.0 | 7.6 | 0.101 | 18.2 | 17.5 | 0.699 | |
| Marijuana | 29.6 | 12.0 | 8.0 | 20 ± 5 | ||||||||
| 19.8 | 36.6 | 0.007 | 7.9 | 14.5 | 1 | 3.0 | 11.7 | 0.244 | 20.9 | 19.9 | 0.517 | |
| Psychiatrics | 20.8 | 6.4 | 2.0 | 22 ± 6 | ||||||||
| 12.9 | 26.9 | 0.013 | 5.9 | 6.9 | - | 1.0 | 2.8 | - | 20.8 | 21.8 | 0.608 | |
| Opium | 13.2 | 3.2 | 0.8 | 22 ± 6 | ||||||||
| 3.0 | 20.7 | 0.000 | 1.0 | 4.8 | - | 0.0 | 1.4 | - | 17.3 | 22.3 | 0.020 | |
| Hashish | 14.4 | 2.0 | 1.2 | 20 ± 5 | ||||||||
| 3.0 | 22.8 | 0.000 | 0.0 | 3.5 | - | 0.0 | 2.1 | - | 22.7 | 20.3 | 0.661 | |
| Subway entrances (Fall 2024) | ||||||||||||
| Hookah | 57.3 | 17.6 | 2.7 | 18 ± 6 | ||||||||
| 52.3 | 63.5 | 0.040 | 13.5 | 22.6 | 0.163 | 1.4 | 3.8 | - | 18.2 | 17.7 | 0.507 | |
| Cigarettes | 54.4 | 32.0 | 8.5 | 19 ± 6 | ||||||||
| 48.1 | 62.3 | 0.009 | 23.8 | 42.1 | 0.013 | 2.8 | 15.7 | 0.000 | 20.6 | 18.1 | 0.002 | |
| Alcohol | 41.9 | 20.5 | 2.7 | 20 ± 6 | ||||||||
| 34.1 | 52.2 | 0.001 | 13.6 | 29.6 | 0.052 | 1.9 | 3.8 | - | 21.5 | 18.0 | 0.000 | |
| Marijuana | 16.0 | 4.3 | 1.9 | 22 ± 5 | ||||||||
| 10.3 | 22.7 | 0.002 | 2.3 | 6.3 | - | 0.9 | 2.5 | - | 22.0 | 21.8 | 0.824 | |
| Psychiatrics | 12.5 | 3.7 | 1.6 | 24 ± 8 | ||||||||
| 9.8 | 15.1 | 0.165 | 3.3 | 3.8 | 0.775 | 1.4 | 1.3 | - | 25.5 | 22.5 | 0.255 | |
| Opium | 7.5 | 2.9 | 0.5 | 22 ± 6 | ||||||||
| 1.9 | 14.5 | 0.000 | 0.5 | 6.3 | - | 0.0 | 1.3 | - | 23.8 | 21.5 | 0.653 | |
| Hashish | 4.5 | 0.5 | 0.3 | 21 ± 4 | ||||||||
| 2.3 | 6.9 | 0.057 | 0.0 | 0.6 | - | 0.0 | 0.0 | - | 21.4 | 20.9 | 0.851 | |
| Public parks (Fall 2024) | ||||||||||||
| Hookah | 74.0 | 28.9 | 4.9 | 16 ± 5 | ||||||||
| 69.8 | 76.1 | 0.179 | 22.8 | 31.7 | 0.144 | 2.5 | 6.0 | 0.198 | 16.1 | 15.5 | 0.347 | |
| Cigarettes | 71.1 | 53.1 | 28.4 | 17 ± 5 | ||||||||
| 66.7 | 73.2 | 0.174 | 42.0 | 59.2 | 0.001 | 19.1 | 33.5 | 0.005 | 18.2 | 17.2 | 0.102 | |
| Alcohol | 64.2 | 40.7 | 10.7 | 18 ± 5 | ||||||||
| 61.7 | 65.5 | 0.487 | 36.4 | 43.0 | 0.330 | 6.2 | 13.0 | 0.047 | 18.4 | 17.1 | 0.057 | |
| Marijuana | 39.6 | 18.2 | 12.4 | 19 ± 5 | ||||||||
| 25.3 | 47.9 | 0.000 | 6.8 | 24.7 | 0.001 | 3.7 | 17.3 | 0.016 | 20.0 | 19.4 | 0.506 | |
| Psychiatrics | 22.7 | 7.8 | 4.2 | 20 ± 5 | ||||||||
| 16.0 | 26.4 | 0.017 | 4.3 | 9.5 | 0.546 | 2.5 | 4.9 | - | 19.4 | 20.4 | 0.436 | |
| Opium | 14.9 | 4.2 | 2.4 | 20 ± 6 | ||||||||
| 5.6 | 20.1 | 0.000 | 1.2 | 5.6 | - | 0.6 | 3.2 | - | 18.2 | 20.0 | 0.406 | |
| Hashish | 17.1 | 4.4 | 1.1 | 19 ± 6 | ||||||||
| 4.9 | 23.9 | 0.000 | 1.2 | 6.0 | - | 0.6 | 1.1 | - | 17.9 | 19.5 | 0.460 | |
Abbreviations: UT, University of Tehran; TUMS, Tehran University of Medical Sciences.
a Values are expressed as Prevalence (%) or mean ± SD.
| Variables | Lifetime | Last Month | Excessive | Start Age |
|---|---|---|---|---|
| UT and TUMS Students (Fall 2023) | ||||
| Hookah | 45.4 | 12.5 | 1.5 | 17 ± 4 |
| Cigarettes | 50.9 | 34.2 | 10.7 | 18 ± 3 |
| Alcohol | 37.8 | 20.5 | 3.6 | 18 ± 3 |
| Marijuana | 15.3 | 5.3 | 1.3 | 20 ± 3 |
| Psychiatrics | 10.0 | 2.8 | 1.0 | 19 ± 4 |
| Opium | 2.5 | 0.4 | 0.0 | 19 ± 7 |
| Hashish | 2.4 | 0.5 | 0.2 | 20 ± 3 |
| Students from public parks (Fall 2023) | ||||
| Hookah | 62.9 | 12.4 | 0.0 | 17 ± 4 |
| Cigarettes | 67.4 | 44.9 | 16.9 | 18 ± 3 |
| Alcohol | 49.4 | 23.6 | 4.5 | 18 ± 4 |
| Marijuana | 23.6 | 11.2 | 5.6 | 20 ± 4 |
| Psychiatrics | 14.6 | 5.6 | 1.1 | 19 ± 3 |
| Opium | 2.2 | 1.1 | 1.1 | 18 ± 0 |
| Hashish | 4.5 | 2.3 | 1.1 | 18 ± 1 |
| Students from Subway Entrances (Fall 2024) | ||||
| Hookah | 47.0 | 11.6 | 0.0 | 16 ± 3 |
| Cigarettes | 47.6 | 25.6 | 4.9 | 18 ± 3 |
| Alcohol | 33.5 | 14.0 | 1.2 | 18 ± 4 |
| Marijuana | 11.6 | 4.3 | 0.6 | 19 ± 2 |
| Psychiatrics | 7.3 | 2.4 | 0.6 | 18 ± 3 |
| Opium | 1.8 | 1.2 | 0.0 | 20 ± 8 |
| Hashish | 1.8 | 0.6 | 0.0 | 19 ± 5 |
| Students from public parks (Fall 2024) | ||||
| Hookah | 64.4 | 26.3 | 2.5 | 15 ± 4 |
| Cigarettes | 63.6 | 39.0 | 18.6 | 17 ± 3 |
| Alcohol | 49.2 | 28.8 | 5.1 | 17 ± 3 |
| Marijuana | 24.6 | 7.6 | 4.2 | 19 ± 2 |
| Psychiatrics | 11.0 | 4.2 | 2.5 | 19 ± 4 |
| Opium | 3.4 | 0.0 | 0.0 | 19 ± 1 |
| Hashish | 4.2 | 0.0 | 0.0 | 17 ± 3 |
Abbreviations: UT, University of Tehran; TUMS, Tehran University of Medical Sciences.
a Values are expressed as Prevalence (%) or mean ± SD.
4. Discussion
Different prevalences sort different criteria for prioritizing problematic consumption. Although lifetime prevalence ranks hookah higher than tobacco cigarettes, there is no competitor for cigarettes when looking at last month and excessive prevalence. Compared to illicit substances, social acceptance and legal endorsement are likely the causes of pervasive consumption of cigarettes, but compared to hookah, accessibility and ease of preparation lead to the high last month and excessive prevalence of cigarettes. An international comparison of World Health Organization (WHO) data for current tobacco consumption in the whole world and Eastern Mediterranean regions, which are 20.9% and 17.9% respectively (4), with our comparable last month prevalence, which is 32.0%, raises serious caution and calls for a cross-cultural investigation to determine the causes of this large discrepancy between our society and global averages. Looking at the medical consequences of excessive consumption, tobacco cigarettes are the most malignant problem in the health system, accounting for 8.5%.
The next three priorities after tobacco are alcohol, marijuana, and psychiatrics. Comparing our data for lifetime and excessive prevalence of alcohol, which are 41.9% and 2.7%, respectively, with the WHO figures for the whole world and Eastern Mediterranean regions, which are 80.0%, 38.0%, 2.3%, and 0.3% for lifetime prevalence and dependence on alcohol, respectively (5), raises concerns about excessive alcohol consumption in our population if excessive prevalence is a reasonable equivalent for dependence. Despite the lower prevalence of marijuana compared to cigarettes and alcohol, the accelerated increase in the use of marijuana is at the forefront of challenges that require immediate solutions and action. An international comparison of cannabis prevalence seems absurd due to the rapidly evolving conditions and diverse sociopolitical struggles over legalization. This worldwide ambiguity, reflected in systematic reviews (6, 7), specifies the requirements for plural indigenous action plans for an irregular multifaceted approach to the world's most commonly used drug, which accounts for an estimated 41% of drug use disorder cases globally (8). Regarding the third priority after tobacco, addictiveness is the salient feature of psychiatrics. The ratio of excessive to lifetime prevalence sorts substances according to the likelihood of progression from initial consumption to addiction. Addictiveness of substances among the general population lies with cigarettes (16%), psychiatrics (13%), marijuana (12%), alcohol (6%), and hookah (5%).
Even though the sampling avoided specific parks that are illustrious centers for consumer gatherings, highly significant differences between the public parks sample and the general population sampled at subway entrances leave no doubt that public parks are high-risk environments. The statistical test for the one-year follow-up indicates the most significant increase for marijuana as a flagship (10 percentage points increase for lifetime prevalence in just one year with P = 0.011), but the apparent pattern of alteration for all substances depicts the efficiency and prosperity of the market. The role of public parks as the base of the illicit substance market may be the expected consequence of similar incentives for park visits and substance consumption to reduce anxiety and seek pleasure. The common rewards have already lost the unfair economic competition with addictive substances, especially in environmental contexts where drug supply is abundant and cheap, while alternative reinforcers are scarce, expensive, or weak (9). The accomplished supply chain from suppliers and consumers to the securities and officials who are either incompetent or profitable confirms the necessity for the legalization of addictive behaviors to prevent a social catastrophe (10). Neither criminalization nor decriminalization is a solution to restrain the avidity tolerance of addiction within the framework of supply and demand. Only market preemption, advertisement prohibition, harm reduction, self-monitoring promotion, and continuous manipulation to establish an enclosed, controlled market might interpret legalization as a cure, which are paternalistic taboos in a free market economy. But the poor spirits need to belong within their society, not just trade in its markets; they need the wise sovereignty of justice (11).
The behavior of university students is similar to that of the general population sampled at subway entrances, except for the lower prevalence of hard drugs, including opium, hashish, crystal, heroin, and ecstasy, but not LSD, and the lack of gender difference for cigarettes, alcohol, and psychiatrics. The same, albeit less gender-specific similarity, is evident in the sample of public parks for cigarettes and alcohol. Substance use was found to be primarily a male problem (12). Gender differences in rates of substance consumption have been consistently observed in the general population and treatment-seeking samples, with men exhibiting significantly higher rates of substance use, abuse, and dependence (13). The gender gap in the prevalence of substance use and onset of substance use disorders has significantly narrowed lately and may be attributable to social and cultural factors, while women are more vulnerable to the functional consequences and side effects (14, 15). The astonishing and tight gender similarity among students in our society signals a cultural reformation rooted in universities that reflects how the misperception of equity jeopardized femininity. Another observation regarding students is that although the differences between park visitors and the general population are the same among students from different sample groups, the longitudinal alteration for the public parks sample disappears among students, which can be inferred as immunity or delayed influenceability.
Finally, for hard drugs, there are three remarkable alterations in the comparison between the public parks sample and the general population: First, the shift in priority of opium and hashish; second, the dissociation of crystal and heroin, which are joint substances among the general population, while crystal outpaces in public parks; and third, the amazing boost of LSD followed by ecstasy among the public parks sample. All three indicate changing attitudes through the market. Basically, there is no agreement as to which psychoactive substances should be regarded as hard or soft drugs (16). Although such blurred terminology should be avoided in a scientific context, the hardness of a substance based on the subjective attitude of society might be an appropriate term to justify the difference in the prevalence of marijuana (16.0%) and hashish (4.5%), while both have almost the same pharmacological effects. By the way, the first remark may be the predictable consequence of the rise of cannabis; the second could be due to the changing cultivation policies in Afghanistan (8) or, together with the third, can be interpreted as an enthusiasm towards stimulants. In general, investigating hard drugs with such a subjective conceptualization requires a deep, comprehensive research design that integrates dynamic analysis of economic alternatives, psychosocial predictors, detailed interviews with consumers, trade transport conditions, political considerations, and official reports.
