


1. Background
Measurement of fetal pulmonary artery acceleration time (PAAT) and acceleration time - to - ejection time ratio (AT/ET) by Doppler echocardiography is important as robust predictive indicators of major pulmonary lung diseases in the fetus (1-7). There are several investigations on Doppler waveforms of fetal PA and aorta, however, studies with simultaneous evaluation of Doppler parameters of PA with aorta are very scarce (8, 9). As is known, cardiac hemodynamic studies are more reliable and informative if the parameters of the right heart and the left heart are measured simultaneously and interpreted in comparison with each other. The relation between PAAT and PA pressure (PAP) has been well - described during childhood and adulthood, i.e. the period of life during which the PAP is normally much lower than the aortic pressure (10, 11). However, fetal period, as the only period of life that PAP is physiologically at the same level of aorta, is unique. Thus, comparative study of AT and AT/ET of PA and aorta is of particular importance during this unique time span of human life.
The aim of this study was twofold. Firstly, to obtain the reference values and Z scores of peak systolic velocity (PSV), pulsatility index (PI), acceleration time (AT), ejection time (ET) and acceleration time - to - ejection time ratio (AT/ET) of PA and aorta in healthy fetuses of singleton pregnancies. Secondly, to compare these values between PA and aorta in order to find out whether the role of PAP in determination of PAAT, is as important as in children and adults. Based on the current literature in children and adults, the null hypothesis was if the pressure of PA and aorta is the same in the fetus, the AT of PA and aorta are not expected to be statistically different.
2. Methods
2.1. Study Design and Study Population
We carried out a cross - sectional study on 146 consecutive women with singleton pregnancies, referred to the Fetal Echocardiography Division of the Children’s Medical Center, between September 2016 and December 2016. Accurate gestational age was defined either by first trimester ultrasound or by last menstrual period confirmed by ultrasound examination of second - trimester. Mothers were referred by the obstetricians or perinatalogists for further evaluation after detection of echogenic intracardiac focus, history of congenital heart disease in the parents or offspring’s or advanced maternal age. Inclusion criteria for mothers and fetuses were as follow. Inclusion criteria for mothers were: singleton pregnancy, having normal fetal ultrasound and absence of maternal diabetes, hypertension, febrile disease and infection. Mothers who consumed corticosteroids or any medication that could affect fetal heart or lung, such as antihypertensive drugs or corticosteroids were excluded (12-14).
Because of the effect of increasing gestational age on Doppler parameters, we categorized the fetuses into seven gestational age periods (14 - 18, 19 - 22, 23 - 26, 27 - 38, 27 - 30, 31 - 34 and 35 - 38 weeks). However, at the end of the study, we realized that the latter three age categories did not include enough number of fetuses. Therefore, in order to avoid sparse data bias in our analysis, we merged these three subcategories and analyzed as 27 - 38 weeks (15).
Fetuses were included only if the complete fetal echocardiographic examination using segmental approach, performed by an experienced pediatric cardiologist, confirmed normal cardiac structure and function. Fetuses with growth retardation or any major extracardiac anomaly, poor acoustic window due to the obesity of the mother or poor position of the fetus and non-optimal Doppler tracings of PA or aorta were excluded.
2.2. Fetal Echocardiographic Examination
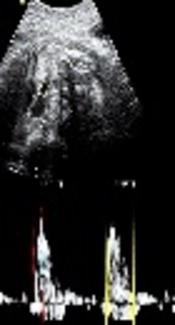
All fetal transabdominal echocardiographic examinations were performed by an experienced pediatric cardiologist using a Medison SonoAce X8 Ultrasound Machine (Samsung Medison Co., Korea) equipped with a C2-8 curved phased array transducer. Pulsed - Doppler sample volume (SV) was placed in the main PA, midway between the pulmonary valve and bifurcation, into right and left PA, according to the technique previously described (Figure 1 and Appendix 1 in Supplementary File) (2).

A: Fetal echocardiogram shows the pulmonary valve in a fetus. B: The Doppler of the pulmonary artery. The acceleration time was measured from the start of the Doppler waveform to its peak velocity. The ejection time was measured from the start of the Doppler waveform to its end.
For aorta, we placed the SV immediately beyond the aortic valve in the ascending aorta in the apical 5 - chamber view. The size of the sample volume was 2 millimeters in the smaller fetuses and 3 millimeters in the larger ones. In both measurements, the angle of insonation was less than 15 degrees and the sweep speed was set at 360 Hz. In each case, the scale and gain were adjusted to obtain the optimal Doppler tracing. Pulsatility index was automatically measured by the echocardiography machine after careful manual tracing of the Doppler waveforms of PA and aorta. Measurements of five optimal consecutive waveforms during the period of no gross fetal movement, were averaged. PA and aorta waveforms were obtained in less than 5 minutes apart.
2.3. Ethical Considerations
This study was performed in accordance with the latest revision of Helsinki declaration (16). The study was approved by Research Ethics Committee of Tehran University of Medical Sciences. Informed consent was obtained from all the participants.
2.4. Statistical Analysis
We described quantitative variables as mean ± standard deviation (SD), mean ± 2 SD, median, minimum and maximum, t - test and one-way analysis of variance (ANOVA) were used for comparison of Doppler parameters of PA and aorta according to fetal sex, gestational age and maternal age. We used fractional polynomial method to evaluate correlation between pulmonary AT, ET, AT/ET, PSV and pulsatility index (PI), and aortic AT, ET, AT/ET, PSV and PI and gestational age. The best - fitting model was chosen. Selection of the best - fitting model was based on the P value of the F - test, which compares the models with the lowest deviance (17). Shapiro - Wilk test was used to test the normality of data.
Using the Equation 1, Z score was calculated for fetal PA and aorta:
Version 12 of STATA data analysis and statistical software (Stata Corp LLC, USA) was used for analysis of data. P value of less than 0.05 was considered statistically significant.
3. Results
Basic characteristics of the study population are shown in Table 1.
| Variable | Number (%) |
|---|---|
| Female | 71 (48.63) |
| Male | 75 (51.37) |
| Gestational age (weeks) (Mean ± SD) | 21.41 ± 4.09 |
| Gestational age (weeks) | |
| 14 - 18 | 45 (30.61) |
| 19 - 22 | 62 (42.18) |
| 23 - 26 | 24 (16.33) |
| 27 - 38 | 16 (10.88) |
| Maternal age (year) (Mean ± SD) | 30.95 ± 4.54 |
| Maternal age (year) | |
| 20 - 25 | 18 (12.24) |
| 26 - 35 | 106 (72.11) |
| 36 - 45 | 23 (15.65) |
3.1. Reference Values of AT, ET, AT/ET, PSV and PI
We presented the reference values as:
Mean ± SD, mean ± 2 SD, minimum, maximum and median (Table 2)
5th, 25th, 50th, 75th, 95th and 99th percentiles according to gestational age and fetal sex (Tables 3 and 4)
 and the acceleration time/ejection time ratio (AT/ET) in the pulmonary artery and the aorta in 146 fetuses of singleton pregnancies according to gestational age.")
Z scores of the acceleration time (AT) and the acceleration time/ejection time ratio (AT/ET) in the pulmonary artery and the aorta in 146 fetuses of singleton pregnancies according to gestational age.
 and ejection time (ET) in the pulmonary artery and the aorta in 146 fetuses of singleton pregnancies, according to fetal sex.")
Z scores of acceleration time (AT) and ejection time (ET) in the pulmonary artery and the aorta in 146 fetuses of singleton pregnancies, according to fetal sex.
.")
Z scores of peak systolic velocity and pulsatiliy index in the pulmonary artery and the aorta of 146 fetuses of singleton pregnancies, according to fetal sex (95% CI: 95% confidence interval).
| Doppler Parameters | Pulmonary Artery | Aorta | ||||||||||
|---|---|---|---|---|---|---|---|---|---|---|---|---|
| Mean | SD | 2 SD | Min | Max | Median | Mean | SD | 2 SD | Min | Max | Median | |
| Sex | ||||||||||||
| Female | ||||||||||||
| PSV | 60.96 | 9.12 | 18.24 | 45.29 | 88.43 | 57.75 | 64.88 | 14.04 | 28.09 | 43.57 | 106.12 | 62.61 |
| PI | 1.40 | 0.27 | 0.54 | 0.87 | 1.99 | 1.4 | 1.52 | 0.28 | 0.55 | 1.04 | 2.9 | 1.5 |
| ET | 198.96 | 23.66 | 47.32 | 154 | 289 | 194 | 205.04 | 101.50 | 203.01 | 150 | 797 | 189 |
| AT | 34.24 | 9.36 | 18.73 | 17 | 61 | 32.5 | 44.04 | 11.13 | 22.26 | 19 | 69 | 44 |
| AT/ET | 0.17 | 0.05 | 0.10 | 0.07 | 0.32 | 0.17 | 0.23 | 0.07 | 0.13 | 0.05 | 0.40 | 0.24 |
| Male | ||||||||||||
| PSV | 60.82 | 11.39 | 22.79 | 42.33 | 98.35 | 57.8 | 65.90 | 1379 | 27.58 | 38.18 | 120.35 | 62.25 |
| PI | 1.45 | 0.27 | 0.55 | 1.01 | 2.14 | 1.42 | 1.50 | 0.24 | 0.47 | 1.02 | 2.19 | 1.49 |
| ET | 203.44 | 27.87 | 55.74 | 128.00 | 283 | 197 | 190.76 | 22.04 | 44.08 | 122.00 | 242 | 189 |
| AT | 36.29 | 12.72 | 25.44 | 17.00 | 83 | 33 | 44.40 | 9.47 | 18.94 | 26.00 | 81 | 44 |
| AT/ET | 0.18 | 0.07 | 0.14 | 0.09 | 0.41 | 0.17 | 0.24 | 0.06 | 0.12 | 0.13 | 0.52 | 0.23 |
| GA (week) | ||||||||||||
| 14 - 18 | ||||||||||||
| PSV | 57.50 | 7.63 | 15.25 | 43.04 | 76.57 | 56.08 | 60.20 | 8.66 | 17.31 | 44.97 | 89.29 | 60.39 |
| PI | 1.48 | 0.31 | 0.62 | 0.97 | 2.14 | 1.46 | 1.51 | 0.20 | 0.40 | 1.09 | 1.90 | 1.48 |
| ET | 203.58 | 26.63 | 53.27 | 172.00 | 283.00 | 197 | 202.38 | 92.11 | 184.22 | 150.00 | 797.00 | 189 |
| AT | 33.56 | 8.40 | 16.80 | 22.00 | 56.00 | 31 | 40.20 | 8.58 | 17.16 | 22.00 | 64.00 | 42 |
| AT/ET | 0.17 | 0.04 | 0.09 | 0.10 | 0.28 | 0.17 | 0.21 | 0.05 | 0.11 | 0.05 | 0.32 | 0.22 |
| 19 - 22 | ||||||||||||
| PSV | 58.81 | 8.50 | 17.01 | 45.73 | 82.18 | 56.72 | 61.99 | 11.47 | 22.94 | 38.18 | 96.63 | 59.53 |
| PI | 1.41 | 0.27 | 0.54 | 0.87 | 2.10 | 1.37 | 1.50 | 0.26 | 0.51 | 1.02 | 2.10 | 1.51 |
| ET | 199.05 | 24.41 | 48.81 | 154.00 | 289.00 | 195.5 | 189.06 | 18.44 | 36.88 | 153.00 | 239.00 | 189 |
| AT | 31.81 | 8.85 | 17.70 | 17.00 | 67.00 | 31 | 42.32 | 8.83 | 17.66 | 19.00 | 61.00 | 42 |
| AT/ET | 0.16 | 0.05 | 0.11 | 0.07 | 0.39 | 0.15 | 0.23 | 0.05 | 0.10 | 0.10 | 0.35 | 0.23 |
| 23 - 26 | ||||||||||||
| PSV | 63.61 | 11.96 | 23.91 | 42.33 | 98.35 | 61.71 | 70.61 | 13.30 | 26.60 | 47.24 | 106.12 | 69.55 |
| PI | 1.42 | 0.23 | 0.45 | 1.08 | 1.99 | 1.41 | 1.49 | 0.24 | 0.49 | 1.20 | 2.19 | 1.49 |
| ET | 204.67 | 27.49 | 54.98 | 168.00 | 275.00 | 194 | 219.63 | 123.43 | 246.85 | 156.00 | 792.00 | 200 |
| AT | 41.04 | 13.39 | 26.78 | 22.00 | 83.00 | 36 | 50.00 | 8.40 | 16.81 | 33.00 | 69.00 | 50 |
| AT/ET | 0.20 | 0.07 | 0.14 | 0.10 | 0.38 | 0.19 | 0.25 | 0.06 | 0.12 | 0.06 | 0.32 | 0.27 |
| 27 - 38 | ||||||||||||
| PSV | 74.39 | 9.58 | 19.17 | 53.38 | 88.43 | 74.41 | 85.44 | 15.69 | 31.38 | 58.67 | 120.35 | 80.09 |
| PI | 1.36 | 0.23 | 0.46 | 0.91 | 1.72 | 1.39 | 1.57 | 0.40 | 0.79 | 1.21 | 2.90 | 1.5 |
| ET | 198.06 | 28.34 | 56.68 | 128.00 | 264.00 | 195.5 | 185.63 | 27.12 | 54.24 | 122.00 | 242.00 | 184.5 |
| AT | 45.00 | 14.52 | 29.05 | 22.00 | 81.00 | 42 | 54.25 | 12.80 | 25.60 | 36.00 | 81.00 | 55.5 |
| AT/ET | 0.23 | 0.07 | 0.13 | 0.10 | 0.41 | 0.23 | 0.30 | 0.08 | 0.17 | 0.19 | 0.52 | 0.30 |
Abbreviations: AT, Acceleration time; AT/ET, ratio of acceleration - time/ejection - time; ET, Ejection time; GA, gestational age; HR, heart rate; PI, Pulsatility index; PSV, Peak systolic velocity; SD, standard deviation.
| GA (Weeks), Percentiles | Pulmonary Artery | Aorta | ||||||||
|---|---|---|---|---|---|---|---|---|---|---|
| PSV | PI | ET | AT | AT/ET | PSV | PI | ET | AT | AT/ET | |
| 14 - 18 | ||||||||||
| 5th | 46.16 | 1.01 | 175 | 22 | 0.11 | 48.31 | 1.17 | 158 | 28 | 0.13 |
| 25th | 53.49 | 1.25 | 183 | 28 | 0.13 | 53.06 | 1.39 | 181 | 33 | 0.18 |
| 50th | 56.08 | 1.46 | 197 | 31 | 0.17 | 60.39 | 1.48 | 189 | 42 | 0.22 |
| 75th | 62.12 | 1.72 | 217 | 39 | 0.19 | 66 | 1.67 | 203 | 44 | 0.24 |
| 90th | 66.86 | 1.93 | 239 | 47 | 0.23 | 70.53 | 1.78 | 208 | 50 | 0.28 |
| 95th | 71.72 | 2.05 | 253 | 47 | 0.25 | 71.18 | 1.8 | 214 | 53 | 0.28 |
| 99th | 76.57 | 2.14 | 283 | 56 | 0.28 | 89.29 | 1.9 | 797 | 64 | 0.32 |
| 19 - 22 | ||||||||||
| 5th | 49.18 | 1.05 | 172 | 19 | 0.10 | 47.57 | 1.06 | 164 | 28 | 0.15 |
| 25th | 52.2 | 1.2 | 183 | 25 | 0.13 | 54.35 | 1.31 | 178 | 36 | 0.19 |
| 50th | 56.715 | 1.37 | 195.5 | 31 | 0.15 | 59.53 | 1.51 | 189 | 42 | 0.23 |
| 75th | 64.71 | 1.58 | 211 | 36 | 0.18 | 69.02 | 1.67 | 200 | 47 | 0.28 |
| 90th | 70.34 | 1.81 | 231 | 42 | 0.24 | 75.49 | 1.81 | 211 | 53 | 0.29 |
| 95th | 77 | 1.96 | 247 | 47 | 0.26 | 83.57 | 1.87 | 219 | 56 | 0.30 |
| 99th | 82.18 | 2.1 | 289 | 67 | 0.39 | 96.63 | 2.1 | 239 | 61 | 0.35 |
| 23 - 26 | ||||||||||
| 5th | 51.12 | 1.08 | 172 | 31 | 0.13 | 50.47 | 1.21 | 161 | 39 | 0.16 |
| 25th | 55.87 | 1.24 | 187.5 | 31 | 0.15 | 60.39 | 1.275 | 183 | 44 | 0.22 |
| 50th | 61.71 | 1.41 | 194 | 36 | 0.19 | 69.55 | 1.49 | 200 | 50 | 0.27 |
| 75th | 69.56 | 1.58 | 215 | 48.5 | 0.24 | 76.68 | 1.62 | 206 | 56 | 0.30 |
| 90th | 75.42 | 1.68 | 244 | 56 | 0.32 | 87.89 | 1.76 | 225 | 64 | 0.31 |
| 95th | 84.66 | 1.75 | 264 | 61 | 0.32 | 88 | 1.82 | 242 | 64 | 0.31 |
| 99th | 98.35 | 1.99 | 275 | 83 | 0.38 | 106.12 | 2.19 | 792 | 69 | 0.32 |
| 27 - 38 | ||||||||||
| 5th | 53.38 | 0.91 | 128 | 22 | 0.10 | 58.67 | 1.21 | 122 | 36 | 0.19 |
| 25th | 68.16 | 1.25 | 190.5 | 36 | 0.20 | 78.19 | 1.38 | 176.5 | 42 | 0.24 |
| 50th | 74.41 | 1.39 | 195.5 | 42 | 0.23 | 87.09 | 1.5 | 184.5 | 55.5 | 0.30 |
| 75th | 82.23 | 1.5 | 205.5 | 54.5 | 0.25 | 95.55 | 1.65 | 201 | 64 | 0.33 |
| 90th | 86.71 | 1.67 | 239 | 61 | 0.29 | 97.49 | 1.8 | 211 | 67 | 0.40 |
| 95th | 88.43 | 1.72 | 264 | 81 | 0.41 | 120.35 | 2.9 | 242 | 81 | 0.52 |
| 99th | 88.43 | 1.72 | 264 | 81 | 0.41 | 120.35 | 2.9 | 242 | 81 | 0.52 |
| Sex, Percentiles | Pulmonary Artery | Aorta | ||||||||
|---|---|---|---|---|---|---|---|---|---|---|
| PSV | PI | ET | AT | AT/ET | PSV | PI | ET | AT | AT/ET | |
| Female | ||||||||||
| 5th | 49.5 | 0.98 | 172 | 22 | 0.10 | 47.45 | 1.15 | 164 | 28 | 0.11 |
| 25th | 54.0 | 1.18 | 183 | 28 | 0.14 | 54.57 | 1.34 | 179.5 | 36 | 0.19 |
| 50th | 57.75 | 1.4 | 194 | 32.5 | 0.17 | 62.61 | 1.5 | 189 | 44 | 0.24 |
| 75th | 67.08 | 1.59 | 208 | 42 | 0.20 | 71.18 | 1.67 | 200 | 53 | 0.28 |
| 90th | 75.42 | 1.75 | 219 | 47 | 0.24 | 85.2 | 1.78 | 208 | 56 | 0.30 |
| 95th | 78.15 | 1.93 | 250 | 50 | 0.26 | 96.52 | 1.87 | 219 | 64 | 0.33 |
| 99th | 88.43 | 1.99 | 289 | 61 | 0.32 | 106.12 | 2.9 | 797 | 69 | 0.40 |
| Male | ||||||||||
| 5th | 46.16 | 1.05 | 172 | 22 | 0.11 | 48.31 | 1.11 | 153 | 31 | 0.16 |
| 25th | 53.92 | 1.25 | 186 | 28 | 0.13 | 56.94 | 1.32 | 181 | 39 | 0.19 |
| 50th | 57.8 | 1.42 | 197 | 33 | 0.17 | 65.25 | 1.49 | 189 | 44 | 0.23 |
| 75th | 67.4 | 1.63 | 219 | 42 | 0.21 | 71.18 | 1.67 | 206 | 47 | 0.27 |
| 90th | 79.26 | 1.8 | 239 | 56 | 0.26 | 87.89 | 1.8 | 211 | 56 | 0.30 |
| 95th | 84.66 | 2.05 | 264 | 61 | 0.32 | 89.29 | 1.87 | 236 | 64 | 0.32 |
| 99th | 98.35 | 2.14 | 283 | 83 | 0.41 | 120.35 | 2.19 | 242 | 81 | 0.52 |
| Total | ||||||||||
| 5th | 46.91 | 1.05 | 172 | 22 | 0.10a | 48.31 | 1.15 | 158 | 28 | 0.15 |
| 25th | 53.92 | 1.24 | 184 | 28 | 0.13 | 54.78 | 1.34 | 181 | 36 | 0.19 |
| 50th | 57.8 | 1.41 | 197 | 33 | 0.17 | 63.14 | 1.49 | 189 | 44 | 0.24 |
| 75th | 67.29 | 1.59 | 211 | 42 | 0.21 | 71.18 | 1.67 | 203 | 50 | 0.28 |
| 90th | 76.57 | 1.8 | 239 | 50 | 0.25 | 87.89 | 1.8 | 211 | 56 | 0.30 |
| 95th | 81.96 | 1.97 | 253 | 56 | 0.28 | 93.18 | 1.87 | 225 | 64 | 0.32 |
| 99th | 88.43 | 2.1 | 283 | 81 | 0.39 | 106.12 | 2.19 | 792 | 69 | 0.40 |
aAll of the 5th to 95th percentiles are less than the “0.305” cutoff value provided by Moety et al. (2).
3.2. Effect of Gestational Age on AT, ET, AT/ET, PSV and PI of PA and Aorta
PSV, AT and AT/ET of PA increased with increasing gestational age (PSV: r = 0.52, P < 0.001; AT: r = 0.39, P < 0.001; AT/ET: r = 0.36, P < 0.001). Similarly, PSV, AT and AT/ET of aorta increased with increasing gestational age (PSV: r = 0.59, P < 0.001; AT: r = 0.47, P < 0.001; AT/ET: r = 0.42, P < 0.001). However, PI and ET of PA and aorta did not change significantly with GA (PA: PI: r = -0.09, P = 0.307; ET: r = -0.007, P = 0.933 and aorta: PI: r = 0.04, P = 0.656; ET: r = - 0.03, P = 0.755) (Table 5).
| Doppler Parameters | Pulmonary Artery | Aorta | ||
|---|---|---|---|---|
| Correlation Coefficient | P Value | Correlation Coefficient | P Value | |
| PSV | 0.52 | < 0.001 | 0.59 | < 0.001 |
| AT | 0.39 | < 0.001 | 0.47 | < 0.001 |
| AT/ET | 0.36 | < 0.001 | 0.42 | < 0.001 |
| PI | -0.06 | 0.307 | 0.04 | 0.656 |
| ET | -0.007 | 0.933 | -0.03 | 0.755 |
Abbreviations: AT, acceleration time; AT/ET, acceleration time/ejection time; ET, ejection time; PI, pulsatility index; PSV, peak systolic velocity.
The best-fitting model for correlation between gestational age and PI, AT, ET and AT/ET of PA and aorta was linear. For PSV, the best - fitting model was linear for PA and second - order polynomial for aorta.
3.3. Effect of Sex on AT, ET, AT/ET, PSV and PI of PA and Aorta
Comparison of mean ± SD of PSV, PI, AT, ET and AT/ET of PA and aorta, showed no statistically significant difference between female and male fetuses (Table 6).
| Doppler - Derived Parameters | Femalea | Malea | P Value |
|---|---|---|---|
| Pulmonary Artery | |||
| PSV | 60.96 ± 9.12 | 60.82 ± 11.39 | 0.938 |
| PI | 1.40 ± 0.27 | 1.45 ± 0.27 | 0.279 |
| AT | 34.24 ± 9.36 | 36.29 ± 12.72 | 0.267 |
| ET | 198.96 ± 23.66 | 203.44 ± 27.87 | 0.295 |
| AT/ET | 0.17 ± 0.05 | 0.18 ± 0.07 | 0.469 |
| Aorta | |||
| PSV | 64.88 ± 14.04 | 65.90 ± 13.78 | 0.656 |
| PI | 1.52 ± 0.28 | 1.50 ± 0.24 | 0.648 |
| AT | 44.04 ± 11.13 | 44.4 ± 9.47 | 0.833 |
| ET | 205.04 ± 101.50 | 190.76 ± 22.04 | 0.236 |
| AT/ET | 0.23 ± 0.07 | 0.24 ± 0.06 | 0.604 |
aValues are expressed as mean ± SD.
3.4. Comparison of Pulse - Doppler Parameters of PA and Aorta
We found statistically significant difference between all of the measured Doppler parameters (PSV, AT, AT/ET and PI) of PA and aorta (Table 7).
| Parameters | Pulmonary Artery | Aorta | P Value | ||
|---|---|---|---|---|---|
| Mean | SD | Mean | SD | ||
| PSV | 60.88 | 10.30 | 65.40 | 13.89 | < 0.001 |
| PI | 1.43 | 0.27 | 1.51 | 0.26 | 0.013 |
| ET | 201.24 | 25.90 | 197.76 | 72.86 | 0.584 |
| AT | 35.29 | 11.21 | 44.22 | 10.28 | < 0.001 |
| AT/ET | 0.18 | 0.06 | 0.23 | 0.06 | < 0.001 |
4. Discussion
This study provided almost simultaneous measurements of five Doppler - derived parameters of PSV, PI, AT, ET and AT/ET of PA and aorta in 146 healthy fetuses of singleton pregnancies, from 14 to 38 weeks of gestation. We provided reference values as Z scores, mean ± SD, mean ± 2 SD, minimum, maximum, median and 5th to 99th percentiles. Interestingly, despite equal pressures in the fetal PA and aorta, we found significantly lower values of PSV, AT and AT/ET in PA relative to those of aorta. Very few studies have compared the Doppler waveforms of both PA and aorta.
Machado and colleagues measured AT in the aorta and PA in 58 fetuses aged 16 to 30 weeks. Mean of AT in the PA and aorta was 32.1 and 43.7 milliseconds (msec), respectively (8). These values are very similar to our findings (mean of 35.29 msec for PA and 44.22 msec for aorta).
Moety and colleagues measured PSV, PI and AT/ET in 643 healthy fetuses, aged 34 to 38 + 6 weeks, without postnatal respiratory distress syndrome (2). They provided 0.305 as the cutoff value for prediction of postnatal RDS with 76.4% sensitivity and 91.6% specificity. Our results are in accordance with the findings of this study. As highlighted in Table 4, in our study, the values for 5th to 95th percentile of AT/ET of PA are all less than 0.305.
Kurihara and colleagues evaluated the AT, deceleration time and ET of PA and aorta in 327 fetuses, aged 17 to 38 weeks (9). They have not stated where they placed the Doppler sample volume for recording of Doppler waveforms of these arteries. They presented reference values as 2.5th, 50th and 97.5th percentiles. However, neither of the above studies has compared the Doppler values of PA with those of aorta.
4.1. Is the Relationship Between Fetal PAAT and PAP Similar to That of Childhood and Adulthood?
This study indicates that in the fetus, the relationship between PAAT and PAP is not similar to after birth.
Recently, in a cohort of 75 children, Levy et al. reported 97 % sensitivity and 95% specificity for PAAT of less than 90 msec and AT/ET of less than 0.31 for prediction of pulmonary hypertension and increased pulmonary vascular resistance (10). Using AT, they introduced two formulas for estimation of mean PAP and pulmonary vascular index (PVRi). Their formulas are as follow: Mean PA pressure = 48 - 0.28 × PA acceleration time and PVRi = 9 - 0.07 × PAAT. Considering our findings, it seems extremely unlikely that we may be able to estimate the mean PAP in the fetus by extrapolation of these formulas.
4.2. What Are the Determinants of Fetal PAAT?
By direct measurement of pressures, Johnson et al. showed equal systolic right and left ventricular pressures in the heart of seven healthy fetuses (18). Bearing the Levy’s formulas in mind that shows PAP could be estimated by a single parameter of AT, we expect that if the pressures are the same in PA and aorta, the acceleration time of PA be the same as aorta, whereas, our findings are to the opposite. This implicates that multiple parameters determine PAAT in the fetus.
As is shown in Figure 5, presence of placenta and non-aerated fetal pulmonary parenchyma markedly distinguishes fetal PA from the post - natal PA in children and adults, that only deals with aerated pulmonary vascular bed. The role of placenta should not be underestimated. Placenta, although not placed directly on the course of PA flow, can indirectly affect PA flow on its way to the descending aorta (19-21). Looking back to what Silverman inferred more than a decade ago, it seems that several complex variables influence the AT of the great arteries in the fetus (22). Pulmonary artery flow faces three different downstream resistances, shown as R1, R2 and R3 in Figure 5. These are the high - resistance - non - aerated fetal lungs, the lower resistance - aortic vascular bed (including descending aorta and its branches that supply the fetal body) and finally placenta vascular bed with the lowest resistance. There are intricate interactions between these three heterogeneous resistances facing the pulmonary artery.
, “lower - resistance” - descending aorta (shown as R2) and “lowest - resistance” - placenta (labeled as R3). The pressures of pulmonary artery and aorta in this diagram, are adopted from reference number 22.")
Pressures are equal in the pulmonary artery and aorta in the fetus, but the acceleration times are not. There are multiple and heterogeneous downstream resistances, facing the fetal pulmonary artery with intricate interaction: “high - resistance” - non - aerated, pulmonary vascular bed (represented as R1), “lower - resistance” - descending aorta (shown as R2) and “lowest - resistance” - placenta (labeled as R3). The pressures of pulmonary artery and aorta in this diagram, are adopted from reference number 22.
Jatavan et al., in a study of 20 fetuses with tetralogy of Fallot, stated: “High PSV shortened acceleration time in the pulmonary arteries” (23). Since PSV reflects ventricular systolic function, the lower the AT as a result of the higher PSV, may indicate the better fetal right ventricular systolic function. However, inexplicably, both PSV and AT of PA were lower than those of aorta in our study.
Yamamoto et al. studied Doppler waveforms of PA in 17 healthy fetuses of singleton pregnancies, before and after 30 weeks (24). They stated right heart function and the interaction between the resistance of vascular beds of PA, aorta and placenta influence the PAAT. Similar to our finding, they showed that AT/ET increases with GA.
Similar to our study, Guan et al., by study on 284 healthy singleton fetuses, inferred that there is positive correlation between GA and AT, AT/ET and PSV (25). This is an expected finding because PVR normally decreases with increasing GA and AT (i.e. the numerator of AT/ET ratio), increases with decreasing PVR.
We realized a second - order polynomial relationship between aortic peak velocity and gestational age. In the recent excellent fetal Doppler study of Gagnon et al., the same relationship has been noted (7).
A variety of factors and their intricate interactions may influence AT. These include ventricular function, pressure and resistance of PA, aorta and placenta and all parameters that directly or indirectly affect these latter variables (such as size of the great arteries, according to Poiseuille’s equation of resistance).
In summary, this study showed despite the presence of equal pressures of PA and aorta in the fetus, AT and AT/ET are lower in the PA relative to the aorta. This finding suggests that PAP is not the only determinant factor of fetal PAAT.
4.3. Limitations
We compared fetal Doppler waveforms of PA and aorta almost simultaneously. This allows better understanding of the fetal cardiac hemodynamics. However, we could not follow the same group of fetuses from early gestation up to after birth to get insight into the chronological evolution of these Doppler waveforms during gestation.
Despite merging the gestational age subcategories, the number of fetuses in the age group of 27 - 38 weeks was small. This may make the collection of meaningful normative data unlikely. However, it is not correct to judge about normality of data based in a single study. Normality of data should be based on large studies with random sampling from the population. We could not measure the flow, the pressure and the resistance of PA (pre-ductal and post-ductal), of ascending and descending aorta and of placenta to provide a comprehensive picture of fetal cardiovascular hemodynamics.
