


1. Background
Along with obesity epidemic in adults, the prevalence of childhood obesity is rapidly increasing worldwide. This alarming growth has affected both developed and developing countries, rendering Middle East a leading area in this regard (1-3). Besides the association of obesity with dyslipidemia, elevated blood pressure and insulin resistance in children (4, 5), it has been related to numerous complications like type 2 diabetes, metabolic syndrome, cardiovascular disease and mortality later in life (3, 6, 7).
BMI is the most commonly used index for defining overweight and obesity in children and a consensus exists on using it for clinical practice and epidemiological studies (8-10). Of the several reference data sets available as BMI cut-off values in children, three of the most widely used are: (1) World Health Organization (WHO), which provides growth charts for children, using Z-scores and standard deviations (SD) based on data from multicenter growth reference study conducted by the organization (11); (2) United States Center for Disease Control and Prevention (CDC 2000), which uses sets of age-sex specific percentiles of BMI, based on 5 nationally representative survey data sets (12); and (3) the International Obesity Task Force (IOTF), which proposes BMI cut-off points by matching childhood BMI percentiles to adult cut-off values of 25 and 30 kg/m2 at the age of 18, using the lambda, Mu, sigma (LMS) method on representative data sets of 6 different countries (9). Although the 85th and 95th percentiles of BMI are most frequently used for definition of childhood overweight and obesity, different cut-offs have been used for defining these conditions and no common consensus is available to date (10, 13).
The adverse effects of overweight and obesity need a long time to appear and strong evidence is lacking for use of best cut-off to predict short- and long-term morbidity risks. Hence most of the cut-offs used for this purpose are based on statistical definitions rather than prediction of the associated health risks (10, 13). Many studies have compared the prevalence of overweight and obesity using different cut-offs (e.g. WHO, CDC and IOTF) and have reported different prevalence estimations (10, 14, 15). A recent meta-analysis from 75 articles about prevalence of overweight or obesity among children and adolescents for different age groups in Iran provided that the prevalence of obesity and overweight did not vary significantly in gender and age categories, but different definitions provide different prevalence of overweight and obesity (16). However few studies have compared the ability of these different cut-offs in discrimination of cardiometabolic risk factors in children or in predicting future metabolic risk among them (17-20).
2. Objectives
We conducted the present study to develop local age- and sex-specific BMI cut-offs for overweight and obesity using the LMS method and IOTF criteria in a representative population of 5 - 18 year old children in Tehran, using data from Tehran Lipid and Glucose Study (TLGS). We also compared these local IOTF cut-offs with international IOTF values and corresponding local CDC cut-offs. Furthermore we aimed to compare the ability of these cut-offs in discriminating cardiometabolic risk factors in the population under study.
3. Methods
3.1. Selection and Description of Participants
Subjects were selected from participants of the Tehran Lipid and Glucose Study (TLGS), a prospective study conducted to determine risk factors and outcomes of non-communicable diseases (21). TLGS is an ongoing study comprised of a cross-sectional prevalence study of non-communicable disease and associated risk factors, Phase I (1999 to 2001), and prospective follow-up studies at about 3-year intervals; Phase II (2002 to 2005); Phase III (2006 to 2008); and phase IV (2009 to 2011). For the TLGS, 15,005 subjects aged ≥ 3 years were selected by a multistage cluster random sampling method from district 13 of Tehran, a district representative of the city population at the time. For the current study, 1555 participants, 803 boys and 752 girls, aged 5 - 18 years who had participated in phase IV (2009 - 2011) of TLGS study, were enrolled. Those participants for whom anthropometric and metabolic values were not present, and also those with extreme values of BMI (exceeding ± 3 SD) were excluded.
Written informed consent was obtained from all participants’ parents. The study was approved by the institutional ethics committee of the Research Institute for Endocrine Sciences, affiliated to Shahid Beheshti University of Medical Sciences, and was conducted in accordance with the principles of the declaration of Helsinki.
3.2. Study Design
Details of the TLGS protocol and all laboratory procedures have been published elsewhere (21). Briefly, trained interviewers collected information, using a pretested questionnaire including demographic data and anthropometric indices.
Weight was measured while the subjects were minimally clothed and without shoes using a digital electronic scale (Seca 707; range 0.1 - 150 kg, Hanover, MD, USA) and recorded to the nearest 100 g (the machine was regularly checked for precision after every 10 measurements). Height was measured in a standing position, without shoes, using a tape measure while the shoulders were in a normal position. A trained person performed all the measurements. BMI was calculated as weight in kilograms divided by square of height in meters (kg/m2). Obesity and overweight were assessed by local CDC and IOTF age and sex-specific cut-offs derived from the study population and also international IOTF cut-offs (9). Using the CDC growth curves, overweight was defined as a BMI ≥ 85th percentile and below the 95th percentile, and obesity was defined as a BMI ≥ 95th percentile (12).
Using a standard mercury sphygmomanometer, a qualified physician measured blood pressures twice, with the subjects in seated position, following one initial measurement for determining peak inflation level. The mean of two measurements was considered to be the participant’s blood pressure. Systolic and diastolic blood pressures (SBP and DBP) were defined as the appearance of the first sound (Korotkoff phase 1) and disappearance of the sound (Korotkoff phase 5) respectively, during deflation of the cuff at a 2- to 3- mm/s decrement rate of the mercury column. After overnight fasting, blood samples for the measurement of glucose and lipid concentrations were drawn. Fasting plasma glucose (FPG) was measured on the day of blood collection by the enzymatic colorimetric method using glucose oxidase. Serum total cholesterol and triglyceride (TG) concentrations were measured by commercially available enzymatic reagents (Pars Azmoon, Tehran, Iran) adapted to a Selectra autoanalyzer. High-density lipoprotein cholesterol (HDL-C) was measured after precipitation of apolipoprotein B–containing lipoproteins with phosphotungstic acid. Low-density lipoprotein cholesterol was calculated from serum total cholesterol, TG and HDL-C, except when TG concentration was 400 mg/dL.
3.3. Statistics
Continuous data are expressed as mean (SD) or median (IQ 25 - 75). Categorical data are presented as percentages. Chi-square (or Fisher’s exact) tests were used to compare differences between sex groups. We used three criteria to classify subjects as overweight or obese based on sex and age. First, age and sex-specific centile curves for BMI were developed using the LMS method, according to which the changing distributions of BMI were summarized by three curves including M (median), S (coefficient of variation) and L (skewness), while the latter was expressed as a Box-Cox power transformation used to normalize the data. Considering L, M and S values of the smoothed curves, which vary by age and sex, and also the z-scores corresponding to the required percentiles, any given point on each centile curve is defined as follows:
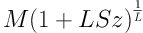
On the other hand the SD score zα corresponding to a given BMI value (e.g. 30) can be computed, using Equation 2:
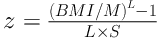
Thus the local cut-offs were computed using Equation 1 to obtain z-score for given BMI values (25 and 30 kg/m2) at age 18 by sex. Likewise, this z-scores and values obtained from this centile at different ages were substituted in Equation 2.
Second, the CDC percentiles were used to obtain obesity and overweight. Accordingly, the BMI ≥ 85th and < 95th CDC percentile of the reference population was considered as overweight and ≥ 95th percentile as obese. Finally, references proposed by the IOTF (9), i.e. percentile curves that corresponded to cut-off points of 25 and 30 kg/m2 for adults were used to define overweight and obesity in different age groups. The rate of agreement between the cut-off points was determined by calculation of kappa coefficients. We used Akaike’s information criterion (AIC) for crosschecking of coefficients from different regression models that evaluated the role of obesity on various cardiometabolic risk factors. The Equation 3 was used to compare the efficiency of parameter estimates from local IOTF and CDC.

If relative efficiency (RE) > 1, local CDC is more efficient than local IOTF; if RE < 1, local IOTF is more efficient than local CDC; and if RE = 1 they give the same results. All analyses were performed using SAS (version 9.1; 2002 - 2003, SAS Institute Inc., Cary, NA, USA), and the LMS Chart Maker software package (version 2.0, 2005, London University, UK) according to the method proposed by Cole and Green (22). Statistical significance was set at P < 0.05.
4. Results
Of our 1555 participants, aged 5 - 18 years, 803 (51.6%) were boys and 752 (48.4%) were girls. Baseline characteristics and cardiometabolic profiles of the participants are presented in Table 1. The overall prevalence of overweight was 22.2, 23.9 and 10.5% and that of obesity was 7.8, 9.0 and 4.2%, using international IOTF, local IOTF and CDC criteria, respectively. More children were classified as overweight or obese using local and international IOTF curves versus local CDC.
| Boys (n = 803) | Girls (n = 752) | Total | |
|---|---|---|---|
| Age (y) | 12.4 (3.7) | 12.6 (3.7) | 12.5 (3.7) |
| BMI (kg/m2) | 20.1 (4.7) | 20.4 (4.3) | 20.3 (4.5) |
| Obese, local IOTF (%) | 11.3c | 6.6 | 9 |
| Overweight, local IOTF (%) | 22.5c | 25.1 | 23.9 |
| Obese, international IOTF (%) | 9.5c | 6 | 7.8 |
| Overweight, international IOTF (%) | 20.6c | 23.9 | 22.2 |
| Obese, BMI ≥ CDC 95th percentile (%) | 3.7 | 4.6 | 4.2 |
| Overweight, CDC 85th ≤ BMI ≤ CDC 95th percentile (%) | 10.6 | 10.3 | 10.5 |
| FPG (mg/dL) | 93.4 (7.0)c | 91.1 (7.3) | 92.3 (7.3) |
| TC (mg/dL)b | 154 (136 - 172) | 157 (139 - 175) | 158 (137 - 154) |
| TG (mg/dL)b | 78 (60 - 108) | 79 (63 - 109) | 78 (61 - 108) |
| HDL-C (mg/dL) | 51.2 (11.4) | 51.2 (11.1) | 51.2 (11.2) |
| LDL-C (mg/dL) | 86.9 (25.8) | 88.8 (25.2) | 87.8 (25.5) |
| WC (cm) | 72.9 (14.7)c | 70.2 (12.4) | 71.6 (13.7) |
| SBP (mmHg) | 101.8 (13.2)c | 98.3 (11.4) | 100.1 (12.5) |
| DBP (mmHg) | 51.2 (11.4) | 51.2 (11.1) | 51.2 (11.2) |
Abbreviations: BMI, body mass index; CDC; center for disease control; DBP, diastolic blood pressure; FPG, fasting plasma glucose; HDL-C, high-density lipoprotein cholesterol; IOTF, international obesity task force; SBP, systolic blood pressure; TC, total cholesterol; TG, triglyceride; LDL-C, Low-density lipoprotein cholesterol; WC, waist circumference.
a Values are expressed as mean (SD), or percentage.
b Values are presented as median (IQ 25 - 75).
c Between sexes, P < 0.05 is considered significant.
We also used the LMS regression method to obtain age and sex-specific smoothed percentile curves for our data as shown in Figure 1. Age and sex-specific cut-off values for overweight and obesity were calculated for our population using CDC and IOTF criteria on our population and are presented in Table 2.

Local IOTF cut-offs derived from L, M, and S curves in 1555 children from Tehran
| Age (y) | Overweight | Obesity | ||||||
|---|---|---|---|---|---|---|---|---|
| IOTF | CDC | IOTF | CDC | |||||
| Boy | Girl | Boy | Girl | Boy | Girl | Boy | Girl | |
| 5 | 16.4 | 17.0 | 18.2 | 20.3 | 19.3 | 19.8 | 23.9 | 31.7 |
| 6 | 16.6 | 17.01 | 18.3 | 17.1 | 19.7 | 20.01 | 23.7 | 22.7 |
| 7 | 16.7 | 17.3 | 18.6 | 19.9 | 20.2 | 20.4 | 22.4 | 21.2 |
| 8 | 17.1 | 17.9 | 21.6 | 18.5 | 20.8 | 21.2 | 24.8 | 22.1 |
| 9 | 17.6 | 18.8 | 21.01 | 20.7 | 21.6 | 22.3 | 24.7 | 22.7 |
| 10 | 18.5 | 19.8 | 22.2 | 22.7 | 22.6 | 23.6 | 26.1 | 25.1 |
| 11 | 19.8 | 20.9 | 22.3 | 22.8 | 23.8 | 24.9 | 25.4 | 24.3 |
| 12 | 20.5 | 22.1 | 24.8 | 24.4 | 25.1 | 26.3 | 29.3 | 28.3 |
| 13 | 21.4 | 23.2 | 25.9 | 25.4 | 26.2 | 27.7 | 28.8 | 27.5 |
| 14 | 22.2 | 24.0 | 26.7 | 27.2 | 27.1 | 28.7 | 28.7 | 28.4 |
| 15 | 22.9 | 24.5 | 27.4 | 25.7 | 27.9 | 29.3 | 31.3 | 29.8 |
| 16 | 23.6 | 24.7 | 27.4 | 25.7 | 28.6 | 29.7 | 32.0 | 29.5 |
| 17 | 24.3 | 24.9 | 29.2 | 27.4 | 29.3 | 29.9 | 31.9 | 32.2 |
| 18 | 25.0 | 25.0 | 27.8 | 28.0 | 30.0 | 30.0 | 30.9 | 31.9 |
Abbreviations: CDC, Center for Disease Control; IOTF, International Obesity Task Force.
aIOTF criteria, defined to pass through body mass index 25 and 30 kg/m2 at age 18.
b CDC criteria, defined as BMI percentile ≥ 85th and 95th as overweight, and ≥ 95th as obesity.
The kappa correlation coefficient was 0.87 between local IOTF and international IOTF criteria, 0.41 between local IOTF and local CDC, and 0.47 between international IOTF and local CDC criteria.
RE was calculated for comparing international IOTF, local IOTF and CDC cut-offs in discrimination of cardiometabolic risk factors. Although AIC values were similar for all the three cut-offs- indicating a good fitness of all models -RE values were less than 1 for all the risk factors when comparing local IOTF and local CDC cut-offs. This showed that IOTF curves discriminate the presence of the cardiometabolic risk factors better in our participants, compared with local CDC ones (Tables 3 and 4). International and local IOTF cut-offs were similar in terms of AIC, and RE in discrimination of childhood risk factors (data not shown).
| IOTF | CDC | REb | |||||
|---|---|---|---|---|---|---|---|
| Normal | Overweight | Obese | Normal | Overweight | Obese | ||
| FPG (mg/dL) | |||||||
| Mean (SD) | 92.8 (6.9) | 94.4 (7.4) | 94.9 (6.1) | 93.1 (7.1) | 94.6 (6.3) | 97.2 (6.6) | |
| β | 1 | 1.64a | 2.11a | 1 | 1.44 | 3.97a | |
| SE | 0.60 | 0.82 | 0.82 | 1.37 | 0.43 | ||
| AIC | 2935.02 | 2935.86 | |||||
| TC (mg/dL) | |||||||
| Mean (SD) | 152 (28.5) | 161.5 (30.8) | 167.2 (31.6) | 154.3 (28.7) | 164.01 (35.2) | 176.4 (30.8) | |
| β | 1 | 9.49a | 15.23a | 1 | 9.74a | 22.13a | |
| SE | 2.51 | 3.45 | 3.47 | 5.81 | 0.42 | ||
| AIC | 5103.46 | 5110.22 | |||||
| TG (mg/dL) | |||||||
| Mean (SD) | 78.8 (35.6) | 102.9 (56.3) | 123.6 (57.9) | 84.5 (42.2) | 119.2 (61.4) | 134.9 (58.5) | |
| β | 1 | 24.16a | 44.8a | 1 | 34.68a | 50.37a | |
| SE | 3.81 | 5.23 | 5.31 | 8.89 | 0.42 | ||
| AIC | 5729.73 | 5752.29 | |||||
| HDL-C (mg/dL) | |||||||
| Mean (SD) | 53.1 (11.6) | 48.8 (10.7) | 46.2 (9.6) | 52.1 (11.5) | 46.6 (10.0) | 44.5 (7.5) | |
| β | 1 | -4.22a | -6.84a | 1 | -5.47a | -7.60a | |
| SE | 0.95 | 1.31 | 1.32 | 2.21 | 0.42 | ||
| AIC | 3642.72 | 3653.94 | |||||
| LDL-C (mg/dL) | |||||||
| Mean (SD) | 83.1 (24.5) | 92.01 (27) | 96.2 (27.0) | 85.3 (24.6) | 93.6 (33.1) | 105 (23.5) | |
| β | 1 | 8.88a | 13.12a | 1 | 8.27a | 19.65a | |
| SE | 2.17 | 2.98 | 3 | 5.02 | 0.42 | ||
| AIC | 4883.01 | 4891.07 | |||||
| WC (cm) | |||||||
| Mean (SD) | 66.3 (10.0) | 82.02 (11.7) | 91.9 (14.2) | 70.2 (12.2) | 89.3 (13.2) | 97.5 (14.2) | |
| β | 1 | 16.05a | 26.1a | 1 | 19.14a | 27.32a | |
| SE | 0.93 | 1.28 | 1.47 | 2.40 | 0.34 | ||
| AIC | 3757.46 | 3956.13 | |||||
| SBP (mmHg) | |||||||
| Mean (SD) | 98.5 (11.9) | 104.6 (11.9) | 114.3 (13.8) | 99.9 (11.9) | 113.7 (15.2) | 113.3 (10.3) | |
| β | 1 | 6.41a | 16.19a | 1 | 13.78a | 14.17a | |
| SE | 1.02 | 1.40 | 1.43 | 2.34 | 0.42 | ||
| AIC | 3891.18 | 3914.06 | |||||
| DBP (mmHg) | |||||||
| Mean (SD) | 64.7 (11.2) | 66.8 (10.9) | 73.6 (12.04) | 65.3 (11.1) | 71 (12.5) | 75.3 (11.7) | |
| β | 1 | 2.40a | 9.16a | 1 | 5.79a | 9.97a | |
| SE | 0.95 | 1.31 | 1.33 | 2.16 | 0.42 | ||
| AIC | 3782.25 | 3794.01 | |||||
Abbreviations: AIC, Akaike’s information criterion; CDC, center for disease control; DBP, diastolic blood pressure; FPG, fasting plasma glucose; HDL-C, high-density-lipoprotein; IOTF, international obesity task force; LDL-C, low-density-lipoprotein; RE, relative efficiency; SBP, systolic blood pressure; SE, squared error; TC, total cholesterol; TG, triglycerides; WC, waist circumference.
a P-value < 0.05 demonstrate significancy.
b RE < 1 indicates better discrimination ability of IOTF compared to CDC for detecting dependent variable.
| IOTF | CDC | REb | |||||
|---|---|---|---|---|---|---|---|
| Normal | Overweight | Obese | Normal | Overweight | Obese | ||
| FPG (mg/dL) | |||||||
| Mean (SD) | 90.4 (7.1) | 93.2 (7.1) | 91.9 (8.5) | 90.9 (7.2) | 93.4 (7.1) | 91.03 (8.3) | |
| β | 1 | 2.81a | 1.49 | 1 | 2.51a | 0.168 | |
| SE | 0.65 | 1.09 | 0.897 | 1.28 | 0.67 | ||
| AIC | 2836.73 | 2845.62 | |||||
| TC (mg/dL) | |||||||
| Mean (SD) | 155.9 (26.8) | 162.3 (30.2) | 171 (24.3) | 157.1 (27.6) | 163.4 (27.8) | 168.6 (28.2) | |
| β | 1 | 6.94a | 15.19a | 1 | 6.26 | 11.49a | |
| SE | 2.51 | 4.16 | 3.42 | 4.87 | 0.68 | ||
| AIC | 4766.02 | 4776.22 | |||||
| TG (mg/dL) | |||||||
| Mean (SD) | 82.8 (34.9) | 104.3 (45.4) | 129.8 (57.9) | 85.8 (37.9) | 114.8 (50.2) | 125.4 (49.3) | |
| β | 1 | 23.99a | 46.95a | 1 | 28.3a | 38.9a | |
| SE | 3.82 | 6.33 | 7.03 | 4.94 | 0.67 | ||
| AIC | 5367.93 | 5397.01 | |||||
| HDL-C (mg/dL) | |||||||
| Mean (SD) | 53.1 (10.9) | 47.1 (9.8) | 44.6 (8.8) | 52.3 (10.9) | 45.4 (9.3) | 44.5 (8.6) | |
| β | 1 | -6.17a | -8.47a | 1 | -6.80a | -7.7a | |
| SE | 0.96 | 1.59 | 1.33 | 1.89 | 0.67 | ||
| AIC | 3391.82 | 3411.34 | |||||
| LDL-C (mg/dL) | |||||||
| Mean (SD) | 86 (24.1) | 94.3 (26.2) | 100.4 (23.6) | 87.5 (24.7) | 95 (24.6) | 99 (26.6) | |
| β | 1 | 8.46a | 14.52a | 1 | 7.58a | 11.58a | |
| SE | 2.24 | 3.71 | 3.07 | 4.37 | 0.67 | ||
| AIC | 4588.71 | 4602.08 | |||||
| WC (cm) | |||||||
| Mean (SD) | 66.3 (10.1) | 79.1 (9.6) | 88 (12.2) | 68.1 (10.8) | 82 (10.2) | 90.3 (10.5) | |
| β | 1 | 12.56a | 21.69a | 1 | 13.63a | 22.48a | |
| SE | 0.92 | 1.52 | 1.31 | 1.89 | 0.61 | ||
| AIC | 3421.18 | 3500.9 | |||||
| SBP (mmHg) | |||||||
| Mean (SD) | 96.4 (10.9) | 102.6 (9.9) | 104.4 (13.9) | 97.5 (10.9) | 103.5 (12.2) | 103.1 (11.6) | |
| β | 1 | 6.18a | 7.97a | 1 | 5.99a | 5.64a | |
| SE | 0.996 | 1.65 | 1.35 | 1.96 | 0.66 | ||
| AIC | 3527.63 | 3554.02 | |||||
| DBP (mmHg) | |||||||
| Mean (SD) | 64.1 (10.5) | 66.9 (11.1) | 71.7 (10.7) | 64.7 (10.7) | 66.5 (11.8) | 71.9 (8.9) | |
| β | 1 | 2.92a | 7.33a | 1 | 1.75 | 7.31a | |
| SE | 0.97 | 1.61 | 1.32 | 1.91 | 0.68 | ||
| AIC | 3506.5 | 3517.02 | |||||
Abbreviations: AIC, Akaike’s information criterion; CDC, center for disease control; DBP, diastolic blood pressure; FPG, fasting plasma glucose; HDL-C, high-density-lipoprotein; IOTF, international obesity task force; LDL-C, low-density-lipoprotein; RE, relative efficiency; SBP, systolic blood pressure; SE, squared error; TC, total cholesterol; TG, triglycerides; ; WC, waist circumference.
a P-value < 0.05 demonstrate significancy.
b RE < 1 indicates better discrimination ability of IOTF compared to CDC for detecting dependent variable.
5. Discussion
This study provides local sex and age-specific cut-offs for overweight and obesity in a representative data of children from Tehran, using CDC and IOTF definitions. Obesity and overweight prevalence were highest when we used LMS-driven curves based on IOTF criteria. Furthermore we found that in our population, local and international IOTF curves discriminate the presence of cardiometabolic risk factors in children better, compared to local CDC curves. To our knowledge, this is the first study in Iran providing IOTF reference curves based on local data; neither has any prior study compared the ability of CDC and IOTF criteria in discriminating the cardiometabolic risk factors in children of the region.
Using international cut-offs like the one proposed by IOTF (9) can provide a common language for defining childhood overweight and obesity, making it possible to compare the results of different studies worldwide, although much concern exists about applicability of these cut-offs to different populations (13, 23). National and local BMI reference data may provide better and safer values for clinical practice, epidemiological use and national policy making (8, 24). On the other hand, using various cut-off values and reference curves leads to different estimations of overweight and obesity in a given population. For example, in a national study on Iranian children, Kelishadi et al. (15), reported that the prevalence of overweight was 8.8%, 11.3%, and 10.1%, and that of obesity was 4.5%, 2.9%, and 4.8%, based on the different cut-offs used (i.e CDC, IOTF and national percentiles, respectively).
IOTF curves and the method proposed by Cole et al. (9) give others the opportunity to develop population-specific cut-offs and curves for childhood overweight and obesity. Although some have argued the trends toward calculating new cut-offs and suggested that this may lead to a rush of new definitions (25), national references may suit better for use in a particular country and for public health purposes (10). Furthermore a common international language for defining obesity would not substitute for a functional definition (10) and clinical, rather than statistical, cut-offs are needed. We developed the first local cut-offs using IOTF definition and compared these with local CDC and international IOTF values and showed that although the prevalence of obesity and overweight is comparable using two IOTF cut-offs but there is a large discrepancy when local CDC values are used.
The long-term adverse effects of obesity and cardiovascular risk factors in children are hard to assess, therefore no clear risk-based cut-offs for childhood BMI exist and it is unclear what BMI for age value is associated with future health risks (10, 26). Childhood overweight and obesity are linked to adverse health effects both in childhood and adulthood. Strong evidence shows that childhood obesity is associated with clustering of cardiometabolic risk factors like high blood pressure, dyslipidemia, hyperinsulinemia, and insulin resistance in children (4, 27, 28). Furthermore obesity in childhood is associated with adulthood morbidity and mortality (29, 30). Given these facts, attention should be focused on best BMI cut-offs for discriminating childhood risk factors and ultimately predicting future risks, rather than merely defining overweight and obesity, which may be different in different populations (10).
A few studies have compared commonly used curves in discriminating the cardiometabolic risk factors in children (17-19). Although these studies were different in the reference curves and the methods they used, this kind of comparison may help researchers and clinicians in choosing the best curve in each population based on health risks. We showed that local IOTF cut-offs better discriminate all the cardiometabolic risk factors (e.g. FPG, lipid profile, BP, etc.) in comparison to local CDC cut-offs in children from Tehran. Moreover our local IOTF cut-offs for different ages were comparable to the international ones proposed by Cole et al. (9) using the data from 6 countries; and both these cut-offs led to similar values in discrimination of cardiometabolic risk factors indicating that local IOTF curves (and also international IOTF curves) may provide a better, clinically more useful definition for overweight and obesity in children from Tehran compared with CDC curves.
Regarding the limitations of this study, the present data are from Tehran, the metropolitan capital of Iran, and may not be representative of national data. We also assessed the risk factors in a cross-sectional manner while longitudinal outcomes later in life provide a stronger evidence for comparing different cut-offs. With adequate follow-up period these data can be used for future risk assessment of children in a longitudinal manner.
5.1. Conclusions
In conclusion our results show that local IOTF cut-offs for children from Tehran are in agreement with international IOTF values and better discriminate the cardiometabolic risk factors in children, when compared to local CDC cut-offs. These findings should raise the awareness that using CDC values may underestimate both the prevalence and the health burden of overweight and obesity in children from Tehran. Moreover, by using CDC definition some children with normal weight may still have considerable metabolic abnormalities. Further longitudinal data comparing different cut-offs may provide better insights into using the best criteria for our region.
