1. Background
The left ventricular hypertrophy (LVH) is a myocardial change, caused by several cardiovascular diseases. There are two major types of non-ischemic cardiomyopathy, which are responsible for LVH, including hypertrophic cardiomyopathy (HCM) and hypertensive heart disease (HHD) (1, 2). Amyloid cardiomyopathy (AC) is often misdiagnosed as HCM or HHD due to the lack of specific clinical manifestations (3). Therefore, it is often essential to make a differential diagnosis of these three conditions in the clinical setting.
Considering the limitations of endomyocardial biopsy (EMB), differential diagnosis usually relies on non-invasive examinations, such as electrocardiography (ECG), echocardiography, and cardiac magnetic resonance (CMR) imaging. In particular, late gadolinium enhancement (LGE)-CMR is a common method for diagnosis of myocardial fibrosis and myocardial extracellular deposition. However, there are some limitations to LGE-CMR. Patients with severe renal impairment or gadolinium allergy cannot benefit from gadolinium-based contrast agents (4-6). Besides, gadolinium administration is currently subject to controversy due to the detection of gadolinium deposits in the human brain despite normal renal function (7). Therefore, development of a gadolinium-free method for identifying the three mentioned diseases is essential.
Recently, native T1 mapping has been proposed as a gadolinium-free imaging technique with high diagnostic sensitivity and accuracy for detecting early myocardial disease and comparable diagnostic performance to LGE-CMR (8-14). Previous studies have shown that native T1 value can distinguish HCM, HHD, and AC patients from control healthy individuals (15-17). Evidence shows that the diagnostic performance of T1 mapping can be improved by using radiomics (18, 19); however, there is relatively scarce research in the literature. Therefore, this study aimed to explore the radiomics of T1 mapping for the differential diagnosis of HCM, HHD, and AC.
2. Objectives
This study aimed to investigate the diagnostic performance of radiomic analysis based on CMR native T1 mapping for the differential diagnosis of HCM, HHD, and AC.
3. Patients and Methods
3.1. Patients
This retrospective, case-control study was approved by the local institution review board (IRB). A total of 135 patients with LVH, caused by non-ischemic cardiomyopathy, were recruited from April 2018 to April 2019 in Tongji Hospital, Wuhan, China. The inclusion criteria for HCM were as follows: (1) maximum wall thickness of the left ventricle (LV) ≥ 15 mm in adults without a family history of HCM or ≥ 13 mm in adults with a family history of HCM, without other diseases causing LVH; and (2) a normal LV cavity size (19).
Besides, the inclusion criteria for HHD were as follows: (1) LV cavity dilation; (2) LV maximum wall thickness ≥ 12 mm; (3) diagnosis of arterial hypertension in the absence of severe chronic kidney disease; and (4) lack of other cardiac diseases, such as valvular heart disease or acquired cardiomyopathies (2, 20). Also, the inclusion criteria for AC were as follows: (1) diagnosis of multiple myeloma by pathology or amyloidosis in other organs shown by biopsy; (2) CMR indicating LVH and late myocardial enhancement (subendocardial enhancement or diffuse dusty enhancement); and (3) an echocardiogram suggesting cardiac involvement (21, 22).
On the other hand, the exclusion criteria were as follows: (1) lack of T1 mapping image or incomplete T1 mapping data; (2) poor image quality; and (3) ITK-SNAP application failure in delineating the regions of interest (ROIs). Finally, 77 patients were enrolled in this study (Figure 1). Besides, 14 consecutive healthy volunteers, without a cardiovascular disease history or positive findings on electrocardiography, echocardiography, or CMR, were enrolled as controls.
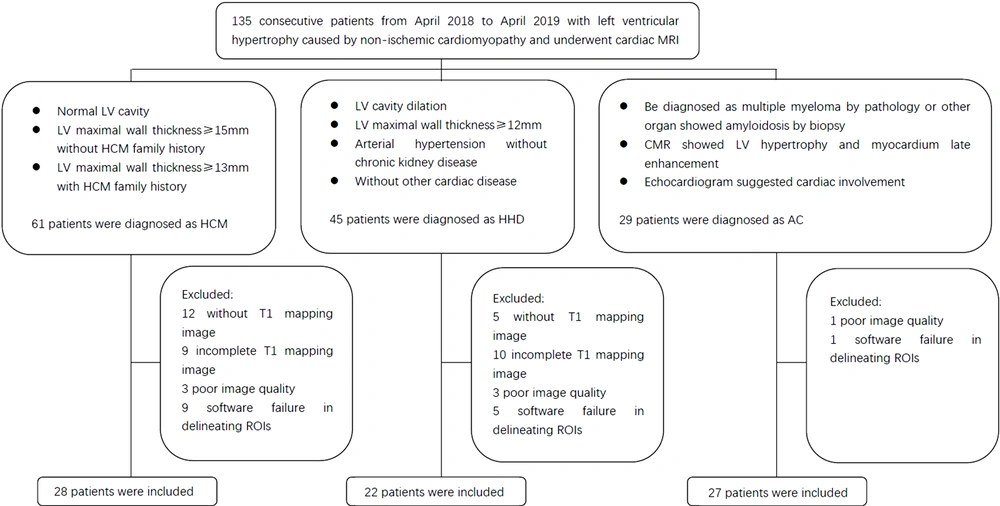
Figure 1.
The flowchart of patient enrollment
3.2. CMR T1 Mapping and LV Short-Axis Cine Sequence Imaging
Cardiac MRI was performed using a 3.0 T scanner (Skyra, 2013, Siemens Healthineers, Erlangen, Germany) with an 18-channel cardiac coil. Native T1 mapping was performed, using an ECG-gated pre-contrast modified look-locker inversion recovery (MOLLI) sequence. The detailed imaging parameters were as follows: echo time (TE), 1.07 ms; repetition time (TR), 2.58 ms; field of view (FOV), 320-360 mm; matrix size, 192 × 144; flip angle (FA), 35; slice thickness, 6 mm (72 segments); minimum inversion time (TI), 100 ms; TI increment, 80 ms; GRAPPA acceleration factor, 2; and imaging window, 136 ms.
The LV short-axis cine imaging was performed using a true fast imaging with steady-state precession (True-FISP) sequence from the apex to the base. The detailed imaging parameters were as follows: TE, 1.39 ms; TR, 2.50 ms; FOV, 320-360 mm; matrix size, 192 × 146; FA, 47°; slice thickness, 6 mm; and slice gap, 2 mm. The cardiac function and global T1 value derived from CMR were processed in cvi42. Version 5.10 (Circle Cardiovascular Imaging Inc., Calgary, Canada).
3.3. Segmentation
Three T1 mapping images at the apical, mid-chamber, and basal levels of the LV (apical T1 mapping, mid-chamber T1 mapping, and basal T1 mapping, respectively) were selected from each participant for further radiomic analyses. The ROIs of the LV myocardium in different slices were manually delineated ROIs in ITK-SNAP software. All ROIs were carefully drawn to distinguish the boundary between the endocardium and blood pool and between the epicardium and extracardiac fat and to exclude trabeculations and papillary muscles (Figure 2).
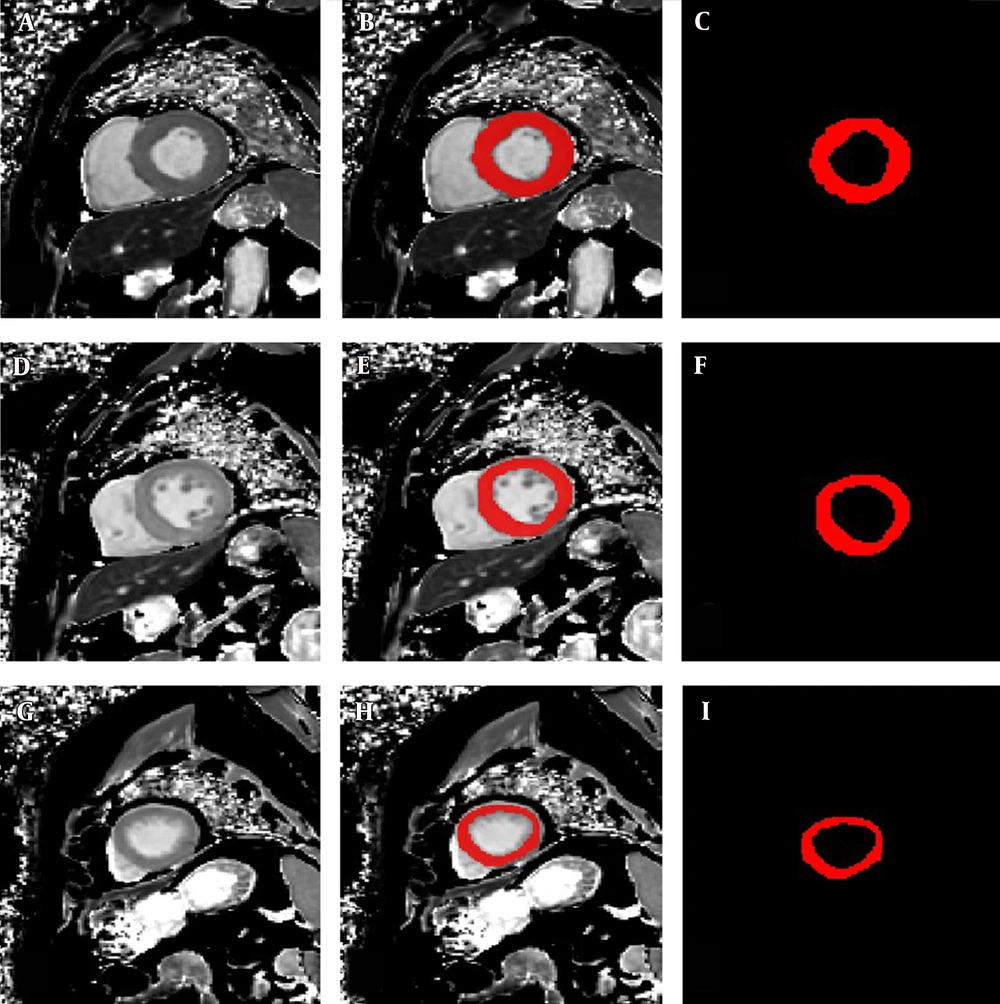
Figure 2.
The left panels show a set of cardiac MRI T1 mapping images in a 54-year-old patient diagnosed with HCM: A, Short-axis T1 mapping image at the basal level; D, Short-axis T1 mapping image at the mid-chamber level; and G, Short-axis T1 mapping image at the apical level. The middle panels show a set of regions of interest (ROIs) drawn manually on the same image: B, ROI and T1 mapping image at the basal level; E, ROI and T1 mapping image at the mid-chamber level; and H, ROI and T1 mapping image at the apical level. The right panels only show the corresponding ROIs: C, ROI in the base; F, ROI in the mid-chamber; and I, ROI in the apex.
3.4. Extraction of Radiomic Features
A radiomic analysis was performed in RadCloud platform (Huiying Medical Technology Co., Ltd., China). Owing to inconsistent pixel spacing for the participants, the images and contours were isotropically resampled. The radiomic features used in this study included 1033 two-dimensional descriptors extracted from each ROI automatically. These features can be categorized into first-order, shape- or size-based, texture, and higher-order statistics.
3.5. feature Selection
The dataset was split into two training and test datasets using a random seed, with 80% of data assigned to the training set (i.e., 17 HHD, 21 AC, and 22 HCM cases) and 20% to the test set. To reduce the redundancy and dimensionality of the features, the SelectKBest and the Least Absolute Shrinkage and Selection Operator (LASSO) algorithm methods were applied for selecting the best predictive features from the radiomic feature set. The relevance of the features and labels was evaluated by the SelectKBest method, and the top-K features were retained. Features with nonsignificant relevance (P>0.05) were removed to minimize the LASSO cost function and retain all significantly relevant features. The cost function used in the Lasso algorithm was as follows:
where X refers to the matrix of the radiomic feature, y is the vector of the sample label, n denotes the number of samples, w represents the coefficient vector of the regression model, and
Data processing was performed in the following steps. First, all radiomic features were standardized to a mean of zero with a variance of one. Second, a ten-fold cross-validation was carried out based on the abovementioned standardized features, and the optimal alpha value was determined according to the minimum mean square error after 2000 iterations. Finally, relevant features were selected based on the best α-value, and the coefficients were calculated for each feature.
3.6. Classification and Evaluation of the Models
The predictive performance of the models was assessed in the test dataset, with the same thresholds as the training dataset. Four radiomic-based models were established for each T1 mapping image (basal T1 mapping, mid-chamber T1 mapping, and apical T1 mapping), as well as a multi-module conjoint analysis in a random forest (RF) model, based on the corresponding set of radiomic features to predict the cause of cardiovascular disease. The native T1 value was also evaluated as a predictive model for the three diseases, with cut-off values from previous research (23). The area under the curve (AUC), precision, recall, and F1 score were calculated as follows:
Precisioncategory= TP/(TP+FP)
Recallcategory= TP/(TP+FN)
F1 scorecategory= 2 × Precision × Recall/(Precision+Recall)
where TP (true positive) represents positive cases, which are predicted as positive by the model; TN (true negative) represents negative cases, which are predicted as negative by the model; FP (false positive) represents negative cases, which are considered positive by the model; and FN (false negative) represents positive cases, which are considered negative by the model. Precision indicates the percentage of correct positive predictions, and recall indicates the percentage of actual positives identified by the model. The F1 score is the harmonic mean of precision and recall.
A receiver operating characteristic (ROC) curve analysis shows how well a model can classify binary outcomes. The ROC curve is generated by plotting the false positive rate of a model against its true positive rate for each possible cutoff value. The AUC is calculated and used as a metric to show how well a model can classify the data points. Different from a two-classifier model, the performance of multi-classifier models needs to be evaluated by using macro- or micro-average measures. The similar sample size of each class in our study made the macro- and micro-average measures applicable. In the study, the macro-average method was selected to evaluate the classification performance of the models. The macro-average of each indicator was calculated as the mean of each calculator for each category. For example, precision was measured as follows:
Precision = (PrecisionHHD + PrecisionAC + PrecisionHCM)/3
A similar measurement method was applied for the other three indicators.
3.7. Statistical Analysis
Statistical analysis was performed in SPSS Version 18.0 (IBM, Armonk, NY, USA). All quantitative variables are expressed as mean ± standard deviation (SD). All categorical variables are expressed as frequency and percentage. All variables were examined for a normal distribution using Shapiro-Wilk test. Also, all variables were assessed for homogeneity of variance using Levene’s test. Quantitative variables with homogeneity of variance (i.e., age, heart rate, systolic blood pressure, and LV end-diastolic volume) were analyzed using one-way ANOVA, with the post-hoc least significant difference (LSD) test. Kruskal-Wallis test was also performed for variables without homogeneity of variance (i.e., diastolic blood pressure, LV ejection fraction, and native T1 value). Moreover, Chi-square test was used for categorical variables (i.e., sex). P value less than 0.05 was considered statistically significant.
4. Results
The general characteristics of the patients are presented in Table 1. Comparison of the groups (two-by-two) is shown in Appendices 1 and 2. Comparison of sex distribution and mean age of the training and test datasets did not show any significant differences (mean age: 49.4 ± 15.1 and 52.4 ± 15.1 years, respectively, P = 0.305; male percentage: 44 [73%] and 14 [82%], respectively, P = 0.105). For the radiomic feature extraction, a total of 1033 radiomic features were successfully extracted for each ROI of the three groups from CMR T1 mapping images of the LV. Based on the LASSO method, 11, 28, 19, and eight features were retained for further modeling of basal T1 mapping, mid-chamber T1 mapping, apical T1 mapping, and multi-module conjoint imaging, respectively. The details of these features are shown in Table 2.
Table 1.
The General Characteristics and Cardiac MRI Findings of the Patients
| Total (N = 91) | HCM (N = 28) | HHD (N = 22) | AC (N = 27) | Controls (N = 14) | P Value | |
|---|---|---|---|---|---|---|
| Age (years), mean ± SD | 48 ± 13 | 42 ± 13 a | 47 ± 14 a | 57 ± 11 | 45 ± 10 a | 0.001 |
| Sex (male), No. (%) | 68 (75%) | 19 (68%) a | 20 (91%) a | 20 (74%) | 9 (64%) a | < 0.001 |
| Heart rate (beats/min), mean ± SD | 84 ± 14 | 90 ± 13 bc | 82 ± 12 | 84 ± 16 | 80 ± 9 | 0.088 |
| Systolic blood pressure (mmHg), mean ± SD | 137 ± 32 | 141 ± 24 bac | 175 ± 26 c | 117 ± 21 b | 114 ± 13 | < 0.001 |
| Diastolic blood pressure (mmHg), mean ± SD | 88 ± 19 | 88 ± 12 ba | 110 ± 20 c | 74 ± 12 bc | 83 ± 10 | < 0.001 |
| CMR | < 0.001 | |||||
| LV end-diastolic volume (mL), , mean ± SD | 143 ± 46 | 133 ± 26 b | 177 ± 45 c | 125 ± 57 b | 145 ± 21 | |
| LV ejection fraction (%),, mean ± SD | 55 ± 14 | 64 ± 8 ba | 48 ± 15 c | 47 ± 13 c | 65 ± 10 | |
| Native T1 (ms), mean ± SD | 1340 ± 93 | 1304 ± 42 ac | 1309 ± 62 ac | 1449 ± 68 c | 1243 ± 42 |
Abbreviations: CMR, Cardiac magnetic resonance; HCM, Hypertrophic cardiomyopathy; HHD, Hypertensive heart disease; AC, Amyloid cardiomyopathy; LV, Left ventricular; P value is calculated for the four groups; MRI, magnetic resonance imaging.
a Significant difference versus AC.
b Significant difference versus HHD.
c Significant difference versus the controls.
Table 2.
The Selected Radiomic Features in the Four Radiomic Models
| Model | Features | No. |
|---|---|---|
| Basal T1 mapping | Original_shape2D_MajorAxisLength, original_shape2D_MinorAxisLength, original_shape2D_MaximumDiameter, squareroot_firstorder_10Percentile, exponential_glcm_ClusterTendency, bp-2D_glcm_JointEntropy, exponential_glrlm_GrayLevelNonUniformity, exponential_glszm_SizeZoneNonUniformity lbp-2D_glrlm_RunLengthNonUniformity, wavelet-HH_firstorder_Kurtosis, original_glszm_ZoneEntropy | 11 |
| Mid-chamber T1 mapping | Original_shape2D_MajorAxisLength, original_shape2D_MinorAxisLength, gradient_glcm_Imc2 squareroot_gldm_LargeDependenceHighGrayLevelEmphasis, squareroot_glrlm_GrayLevelNonUniformity, square_glszm_LargeAreaHighGrayLevelEmphasis gradient_glszm_SmallAreaLowGrayLevelEmphasis, square_glszm_GrayLevelVariance square_glcm_Idmn, logarithm_ngtdm_Contrast, squareroot_glcm_InverseVariance, square_ngtdm_Contrast, gradient_ngtdm_Coarseness, square_firstorder_Skewness, square_firstorder_Range, gradient_glrlm_HighGrayLevelRunEmphasis, gradient_gldm_GrayLevelVariance, wavelet-HL_firstorder_Median, wavelet-HL_glcm_Imc1, wavelet-HL_firstorder_Mean, lbp-2D_firstorder_10Percentile, wavelet-LL_firstorder_Median, wavelet-LL_firstorder_Minimum, wavelet-LL_gldm_SmallDependenceLowGrayLevelEmphasis, wavelet-LH_glcm_Correlation, wavelet-LH_glrlm_RunEntropy, wavelet-LL_glszm_SmallAreaLowGrayLevelEmphasis, original_glszm_GrayLevelNonUniformityNormalized | 28 |
| Apical T1 mapping | Gradient_firstorder_Kurtosis, original_shape2D_MajorAxisLength, logarithm_firstorder_Uniformity, logarithm_glcm_JointEnergy, lbp-2D_glcm_JointEntropy, lbp-2D_glcm_DifferenceEntropy, lbp-2D_glcm_SumEntropy, gradient_glcm_Idmn, gradient_firstorder_RobustMeanAbsoluteDeviation, wavelet-LL_firstorder_10Percentile, lbp-2D_firstorder_Variance, wavelet-LL_glszm_GrayLevelNonUniformity, wavelet-LH_glcm_Imc1, wavelet-LL_ngtdm_Coarseness, lbp-2D_firstorder_Entropy, wavelet-LH_glcm_Idn, wavelet-LH_firstorder_Kurtosis, wavelet-HL_firstorder_Median, wavelet-HH_glcm_MaximumProbability | 19 |
| Multi-module conjoint | Gradient_firstorder_Kurtosis, original_shape2D_MinorAxisLength, original_shape2D_MajorAxisLength, squareroot_firstorder_Maximum, original_shape2D_MaximumDiameter, squareroot_firstorder_90Percentile, wavelet-LH_glcm_Idn, lbp-2D_glrlm_RunLengthNonUniformity | 8 |
The native T1 value showed a significant difference between the four groups (HCM: 1304 ± 42, HHD: 1309 ± 62, AC: 1449 ± 68, controls: 1243 ± 42; P < 0.001). The AUC for the performance of the native T1 model in the differential diagnosis of the three diseases was 0.72 (0.618-0.825). Also, precision was measured to be 0.61, recall was estimated at 0.63, and the F1 score was 0.62 (Table 3). The ROC curve is presented in Figure 3.
Table 3.
The Classification Performance of Different Models
| Model | AUC (95% CI) | Precision | Recall | F1 score |
|---|---|---|---|---|
| Conventional T1 value | 0.72 (0.618-0.825) | 0.61 | 0.63 | 0.62 |
| Basal T1 mapping | ||||
| Training | 1 (0.998-1.000) | 0.98 | 0.98 | 0.98 |
| Test | 0.96 (0.851-1.000) | 0.84 | 0.82 | 0.83 |
| Mid-chamber T1 mapping | ||||
| Training | 1 (0.991-1.000) | 0.99 | 0.98 | 0.98 |
| Test | 0.96 (0.894-1.000) | 0.90 | 0.89 | 0.88 |
| Apical T1 mapping | ||||
| Training | 0.99 (0.986-1.000) | 0.94 | 0.93 | 0.93 |
| Test | 0.86 (0.660-0.997) | 0.71 | 0.70 | 0.70 |
| Multi-module conjoint | ||||
| Training | 1 (0.983-1.000) | 0.95 | 0.95 | 0.95 |
| Test | 0.90 (0.696-1.000) | 0.77 | 0.77 | 0.77 |
Abbreviations: AUC, area under curve; CI, confidence interval.
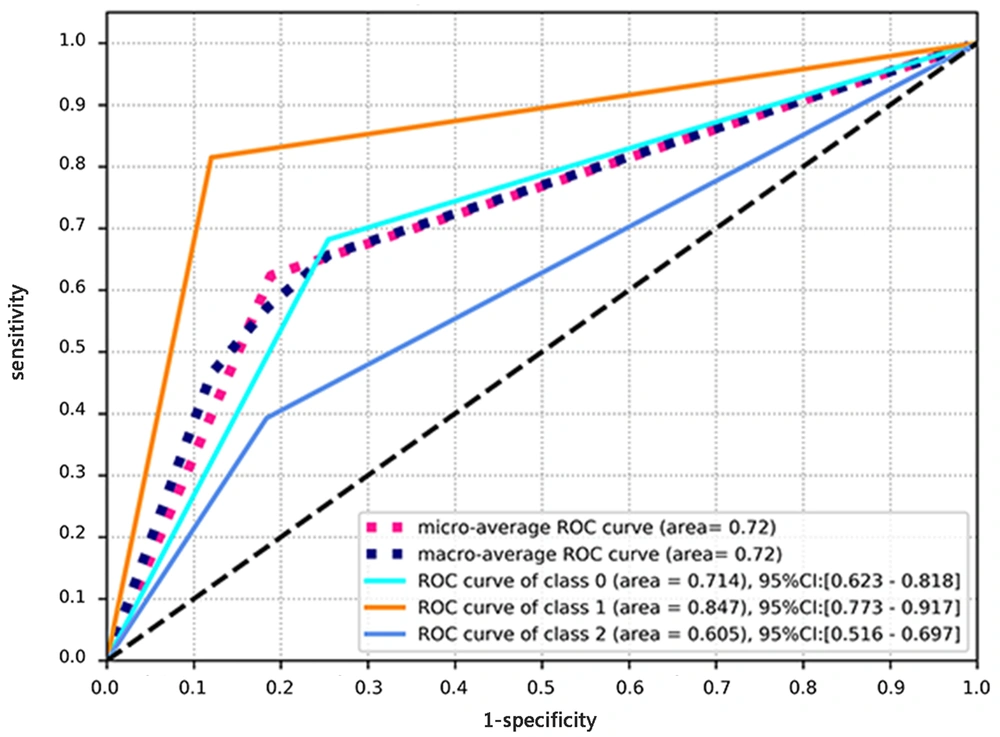
Figure 3.
The receiver operating characteristic (ROC) curve for diagnosis of three diseases associated with left ventricular hypertrophy (LVH) based on the native T1 value. The micro-average ROC refers to the diagnostic ability of the multi-module model, calculated by the micro-average method. The macro-average ROC refers to the ROC curve analysis of the multi-module model, calculated by the macro-average method. Class 0 in the ROC curve analysis refers to the diagnostic ability of the multi-module model for hypertensive heart disease (HHD). Class 1 in the ROC curve analysis refers to the diagnostic ability of amyloid cardiomyopathy (AC) in the multi-module model. Class 2 in the ROC curve analysis refers to the diagnostic ability of the multi-module model for hypertrophic cardiomyopathy (HCM).
The performance parameters of the native T1 model for the differential diagnosis of the three diseases were as follows: AUC, 0.72 (95% CI: 0.618-0.825); precision, 0.61; recall, 0.63; and F1 score, 0.62) (Table 3). The ROC curves of radiomic analysis are shown in Figure 4. For the radiomic analysis, the best model was the mid-chamber T1 mapping model, with AUCs of 1 (95% CI: 0.991-1.000) and 0.96 (95% CI: 0.894-1.000) for the training and test datasets, respectively. Conversely, the lowest diagnostic performance was attributed to the apical T1 mapping model, with AUCs of 0.99 (95% CI: 0.986-1.000) and 0.86 (95% CI: 0.660-0.997) for the training and test sets, respectively.
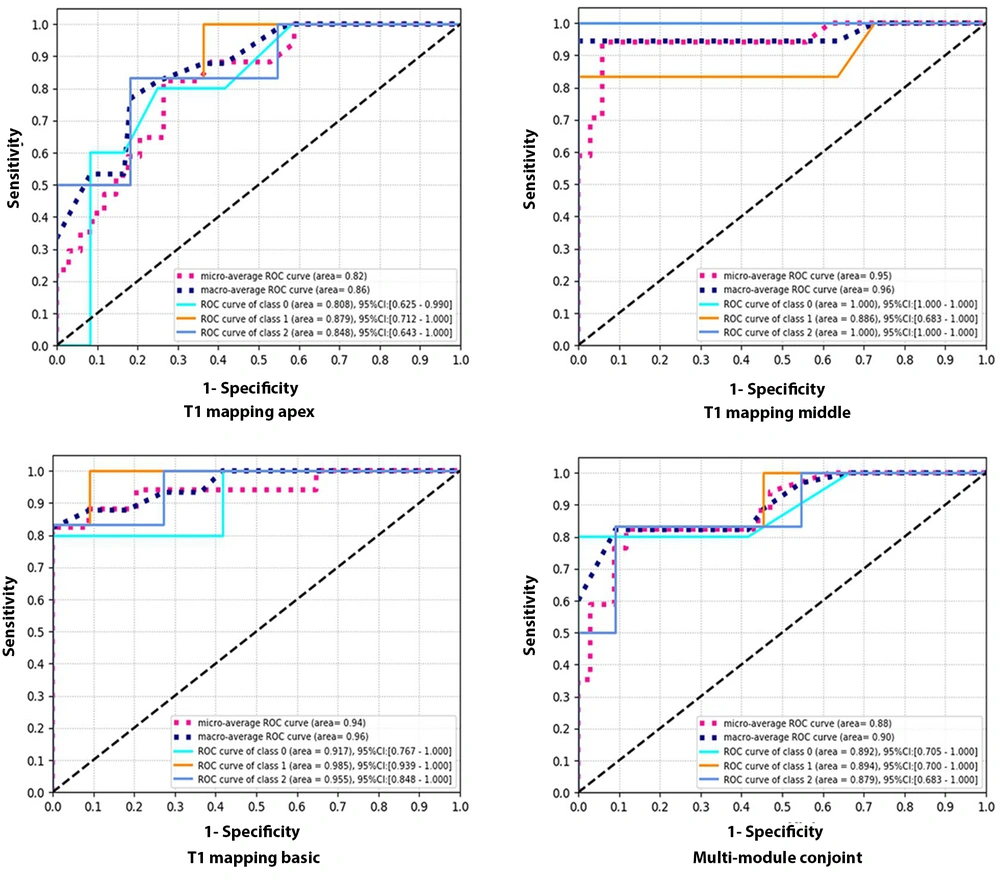
Figure 4.
The receiver operating characteristic (ROC) curve of four radiomic models for the differential diagnosis of three left ventricular hypertrophy (LVH)-associated diseases in the test dataset. The micro-average ROC refers to the diagnostic ability of the multi-module model, calculated by the micro-average method. The macro-average ROC refers to the ROC curve of the multi-module model, calculated by the macro-average method. Class 0 in the ROC curve analysis refers to the ROC curve of the multi-module model for hypertensive heart disease (HHD). Class 1 in the ROC curve analysis refers to the ROC curve of the multi-module model for amyloid cardiomyopathy (AC). Class 2 in the ROC curve analysis refers to the diagnostic ability of the multi-module model for hypertrophic cardiomyopathy (HCM).
5. Discussion
This retrospective study revealed that radiomic models of T1 mapping could differentiate the three diseases associated with LVH simultaneously. The diagnostic performance of these models was superior to that of the native T1 value. The radiomic analysis of the mid-chamber T1 mapping model was confirmed as the best model. Overall, the radiomic analysis of T1 mapping demonstrated the favorable diagnostic performance of radiomic models.
In this regard, Yu et al. demonstrated that an echocardiography-based textural analysis may discriminate HCM and HHD with an AUC of 0.85 (24). Moreover, Neisius et al. demonstrated that the radiomic analysis of T1 mapping could discriminate HCM and HHD with an AUC of 0.86 (19). In the present study, a higher AUC was reported. Our results also showed that the radiomic models could distinguish AC from HCM and HHD. Therefore, radiomic models based on T1 mapping can be potential biomarkers for distinguishing the three causes of myocardial hypertrophy.
Moreover, in this study, the diagnostic performance of native T1 value in distinguishing AC, HCM, and HHD responsible for LVH was confirmed. The AUC, precision, recall, and F1 score were 0.72, 0.61, 0.6, and 0.62, respectively, which were lower than those of the radiomic models. According to the results, the performance of radiomic models improved significantly. This may be due to the fact that T1 value is only a feature of T1 mapping images, and radiomics can present the hidden information of T1 mapping images, provide more valid and reliable information, and help establish a more accurate diagnosis. The results reported by Neisius et al., also confirmed this finding (19). Overall, the results of the present study demonstrated that the radiomic analysis could improve the diagnostic performance of CMR and help physicians make a better diagnosis in clinics; therefore, it has a high practical value and a broad application prospect.
The present results confirmed that the radiomic analysis of mid-chamber and basal T1 mapping models was more helpful than the multi-module conjoint model in distinguishing HCM, HHD, and AC. Although HCM, HHD, and AC are all diffuse cardiomyopathies, T1 mapping at the LV apical level is usually unstable because of technical limitations, resulting in deviations in the radiomic data of the multi-module conjoint model. This may be the reason why the diagnostic performance of the multi-module conjoint model was inferior to the mid-chamber and basal T1 mapping models.
The results also suggested that the overall analysis of the myocardium might not be highly valuable in diffuse cardiomyopathies. A multi-module conjoint analysis is not imperative, and it may be efficient to examine the basal and mid-chamber levels of the myocardium when dealing with diffuse cardiomyopathies. Meanwhile, in the present study, the mid-chamber T1 mapping was identified as the best model due to two possible reasons. First, there are no significant segment-to-segment differences at the midventricular level as compared to the apical and basal levels (25); therefore, the native T1 value is more reliable at the midventricular level than the apical and basal levels. Second, the basal and apical slices are susceptible to respiratory and diaphragmatic movements, respectively.
There were some limitations in this study. First, the sample size of the study was small, and a larger population needs to be recruited and examined. Second, endomyocardial biopsy was not performed for AC, which might have caused some interferences. Third, all patients with AC enrolled in this study had amyloid light-chain (AL) amyloidosis, and further examinations for amyloid transthyretin (ATTR) collection and analysis were needed. Fourth, the native T1 values for HHD and HCM were in the same range, which might have led to bias in diagnostic accuracy.
In conclusion, a radiomic analysis based on native T1 mapping could accurately distinguish HCM, HHD, and AC. Therefore, it might be a suitable alternative to LGE for differentiation of these three diseases.

