


1. Background
Hepatocellular carcinoma (HCC) is the sixth most common cancer around the world. Cases of HCC in Africa and East Asia account for 80% of all HCC cases worldwide, and China is one of the countries with a high incidence rate (1). HCC is the third major cause of cancer-related death, with significant effects on the patient’s life, health, and quality of life (2). Currently, therapeutic methods for HCC mainly include surgical resection, arterial infusion chemotherapy, radiofrequency ablation, and liver transplantation (3).
Stereotactic ablative radiotherapy (SABR) is a type of external radiation therapy, in which extracranial lesions are radiated accurately by strictly controlling the dose for normal tissues, decreasing the irradiation region, and increasing the radiotherapy dose with one or more fractions. SABR, characterized by high efficacy and safety, has become the standard treatment protocol for patients who are not eligible candidates for surgery (4). Despite certain progresses in the treatment of HCC, the recurrence rate remains high, the overall survival rate is low, and the prognosis is poor after treatment (5). Therefore, evaluating the prognosis of patients using specific examination indices before treatment to improve their survival rate is a serious medical problem that needs to be resolved.
As a newly emerging imaging technique, texture feature analysis can extract significant data from images to comprehensively and quantitatively analyze the features of tumors (6). Texture feature analysis has been mainly employed to assess the prognosis of diseases, such as breast cancer, lung cancer, and cervical cancer; however, its prognostic value for HCC patients has been rarely investigated (7).
2. Objectives
This case-control study aimed to examine the prognostic value of texture feature analysis in computed tomography (CT) images of HCC patients following SABR.
3. Patients and Methods
3.1. General Data
A total of 100 HCC patients treated with SABR in our hospital from January 2019 to January 2021 were selected for this study and then divided into good prognosis (n = 57) and poor prognosis (n = 43) groups based on their prognosis after treatment. This study was reviewed and approved by the medical ethics committee of our hospital (approval No.: 2021lunshen001).
3.2. Inclusion and Exclusion Criteria
The inclusion criteria were as follows: (1) meeting the diagnostic criteria for HCC based on the standardization for diagnosis and treatment of primary hepatic carcinoma (2017 edition) (8) and a definite diagnosis based on histopathological biopsy; (2) lack of vascular and lymph node invasion and metastasis; (3) Child-Pugh class A or B; (4) platelet count > 50 × 109/L; and 5) being informed about the study (patients or their families).
On the other hand, the exclusion criteria were as follows: (1) complicated cases with other extrahepatic tumors; (2) undergoing liver transplantation or hepatectomy after SABR; (3) metastatic liver cancer; and (4) incomplete clinical data.
3.3. Collection of General Data
The general data of the patients were collected by examining their electronic medical records, including age, sex, presence of hepatitis B virus (HBV) infection, hepatitis C virus (HCV) infection, and liver cirrhosis, and Child-Pugh class. Venous blood was drawn from the patients and then centrifuged to collect the supernatants. Next, the levels of serum alpha-fetoprotein (AFP), alanine aminotransferase, gamma-glutamyl transferase (GGT), and aspartate aminotransferase (AST) were measured.
3.4. CT imaging Methods
All the patients were examined using a Philips Brilliance 64-slice spiral CT scanner (Philips Healthcare, Cleveland, OH, USA) before SABR, with an image matrix of 512 × 512, pitch of 0.969, tube voltage of 120 kV, collimation of 1.25 mm, tube current of 200 mA, and slice thickness of 2 - 5 mm. The patients in the supine position were scanned from the diaphragmatic dome to the inferior pole of the liver. After plain scan, 90 mL of the contrast agent (iohexol injection containing 370 mg/mL of iodine) was injected into the median cubital vein at 2.5 mL/s, using a high-pressure injector. Subsequently, arterial phase scanning and portal phase scanning were conducted at 25 and 50 seconds after injection, respectively; the injected dose of the contrast agent was adjusted according to the patient's body habitus.
3.5. Observation Indices
The texture features of CT images were independently analyzed by two physicians with experience in abdominal imaging diagnosis, who were unaware of the postoperative pathological condition of the patient, except HCC. Besides, disagreements regarding the texture features of CT images were resolved by the two physicians through discussion.
The texture features of CT images analyzed in this study were as follows: (1) lesion size (long diameter of maximum lesion area); (2) peritumoral enhancement (yes/no); (3) tumor margin (smooth: round or round-like lesions in the portal phase with a clear border; unsmooth: single nodular lesions accompanied by extrinsic or multinodular, infiltrative growth of tumor margins and unclear boundaries with the surrounding liver tissue); (4) capsule (complete, incomplete, and none); (5) tumor number (single or multiple); (6) cancer enhancement rate of arterial phase (%) (arterial phase CT value of cancer - plain scan CT value of cancer)/plain scan CT value of cancer × 100%); (7) percentage of arterial phase CT value of cancer (%) (arterial phase CT value of the adjacent normal liver parenchyma/arterial phase CT value of cancer × 100%); (8) percentage of portal phase CT value of cancer (%) (portal phase CT value of the adjacent normal liver parenchyma/arterial phase CT value of cancer × 100%); and (9) relative washout ratio in the portal phase of cancer (%) (arterial phase CT value of cancer - portal phase CT value of cancer)/arterial phase CT value of cancer × 100%).
The prognosis of HCC patients was determined at three months after SABR, according to the criteria described in the “standardization for diagnosis and treatment of primary hepatic carcinoma” (2017) (8). Specifically, complete remission, partial remission, stable disease, and progressive disease were defined as reductions in lesion size by 100%, 50 - 99%, 30 - 49%, and < 30%, respectively. Complete remission and partial remission were classified as good prognoses, while stable disease and progressive disease were defined as poor prognoses.
3.6. Establishment and Validation of the Nomogram Prediction Model
Factors affecting the poor prognosis of HCC patients after SABR were subjected to a multivariate logistic regression analysis, and variables with statistically significant differences were determined. Next, a nomogram prediction model was developed using R software (R3.3.2) and RMS software package. Finally, the prediction accuracy of the model was assessed by calibration curves.
3.7. Statistical Analysis
SPSS version 19.0 (IBM Corp., NY, USA) was used for statistical analysis, and GraphPad Prism 5.0 (GraphPad Software Inc., CA, USA) was used for plotting. Qualitative data are presented as percentage and examined by chi-square test for intergroup comparisons. Quantitative data are expressed as mean ± standard deviation; independent t-test was used for comparisons between the groups. Statistically significant factors in the univariate analysis were incorporated into the multivariate logistic regression analysis. Moreover, the receiver operating characteristic (ROC) curves were plotted to evaluate the discriminatory power of models. P-value less than 0.05 was considered statistically significant.
4. Results
4.1. General Data
The good prognosis group included 45 males and 12 females, aged 36 - 80 years (mean age, 61.12 ± 6.31 years). The poor prognosis group consisted of 36 males and seven females, aged 35 - 81 years, with a mean age of 55.36 ± 6.47 years. Differences in age and serum AFP, GGT, and AST levels were significant between the two groups (P < 0.05), while there were no significant differences regarding the remaining general data (P > 0.05) between the groups (Table 1).
| Groups | Good prognosis group (n = 57) | Poor prognosis group (n = 43) | OR (95% CI) | t/χ2 | P |
|---|---|---|---|---|---|
| Age (y) | 0.777 (0.767 - 0.788) | 7.648 | 0.006 | ||
| ≤ 40 | 5 (8.77) | 13 (30.23) | - | - | |
| > 40 | 52 (91.23) | 30 (69.77) | - | - | |
| Male/female (n) | 45/12 | 36/7 | 0.200 (0.189 - 0.210) | 0.363 | 0.547 |
| Hepatitis B virus | 38 (66.67) | 34 (79.07) | 0.196 (0.186 - 0.207) | 1.870 | 0.171 |
| Hepatitis C virus | 1 (1.75) | 1 (2.33) | 0.194 (0.184 - 0.205) | 0.041 | 0.840 |
| Liver cirrhosis | 17 (29.82) | 18 (41.86) | 0.197 (0.187 - 0.207) | 1.561 | 0.212 |
| Child-Pugh class | 0.203 (0.192 - 0.213) | 1.310 | 0.252 | ||
| Class A | 53 (92.98) | 37 (86.05) | - | - | |
| Class B | 4 (7.02) | 6 (13.95) | - | - | |
| Serum AFP | 0.196 (0.186 - 0.206) | 4.665 | 0.031 | ||
| ≤ 9 ng/mL | 22 (38.60) | 8 (18.60) | - | - | |
| > 9 ng/mL | 35 (61.40) | 35 (81.40) | - | - | |
| Serum ALT | 0.197 (0.187 - 0.207) | 0.056 | 0.813 | ||
| ≤ 50 U/L | 41 (71.93) | 30 (69.77) | - | - | |
| > 50 U/L | 16 (28.07) | 13 (30.23) | - | - | |
| Serum GGT | 0.195 (0.185 - 0.205) | 7.229 | 0.007 | ||
| ≤ 60 U/L | 46 (80.70) | 24 (55.81) | - | - | |
| > 60 U/L | 11 (19.30) | 19 (44.19) | - | - | |
| Serum AST | 0.198 (0.188 - 0.209) | 4.864 | 0.027 | ||
| ≤ 40 U/L | 39 (68.42) | 20 (46.51) | - | - | |
| > 40 U/L | 18 (31.58) | 23 (53.49) | - | - |
Comparison of the Baseline Demographic, Clinical, and Laboratory Data Between the Poor and Good Prognosis Groups a
4.2. Texture Features of CT Images
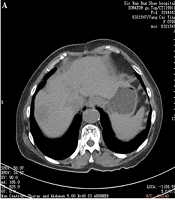
Significant differences were found between the two groups in terms of the lesion size, smoothness of tumor margin, complete or incomplete tumor capsule, tumor number, portal phase CT value of cancer (%), and relative washout ratio in the portal phase of cancer (P < 0.05). However, peritumoral enhancement, cancer enhancement of the arterial phase, and arterial phase CT value of cancer exhibited no significant differences between the two groups (P > 0.05) (Table 2). The representative CT images of the good prognosis and poor prognosis groups are shown in Figure 1.
| Groups | Good prognosis group (n = 57) | Poor prognosis group (n = 43) | OR (95%CI) | t/χ2 | P |
|---|---|---|---|---|---|
| Lesion size | 0.202 (0.191 - 0.212) | 7.841 | 0.005 | ||
| ≤ 5 cm | 36 (63.16) | 15 (34.88) | - | - | |
| > 5 cm | 21 (36.84) | 28 (65.12) | - | - | |
| Peritumoral enhancement | 0.204 (0.194 - 0.215) | 0.672 | 0.412 | ||
| Yes | 5 (8.77) | 6 (13.95) | - | - | |
| No | 52 (91.23) | 37 (86.05) | - | - | |
| Tumor margin | 0.192 (0.181 - 0.202) | 11.494 | 0.001 | ||
| Smooth | 34 (59.65) | 11 (25.58) | - | - | |
| Uneven | 23 (40.35) | 32 (74.42) | - | - | |
| Capsule | 0.196 (0.185 - 0.206) | 7.304 | 0.026 | ||
| None | 24 (42.11) | 22 (51.16) | - | - | |
| Incomplete | 15 (26.32) | 17 (39.53) | - | - | |
| Complete | 18 (31.58) | 4 (9.30) | - | - | |
| Tumor number | 0.198 (0.188 - 0.208) | 4.173 | 0.041 | ||
| Single | 48 (84.21) | 29 (67.44) | - | - | |
| Multiple | 9 (15.79) | 14 (32.56) | - | - | |
| Cancer enhancement rate of the arterial phase | 79.42 ± 18.73 | 74.41 ± 16.37 | 0.862 (0.423 - 1.001) | 1.397 | 0.166 |
| Percentage of the arterial phase CT value of cancer | 97.62 ± 21.48 | 104.05 ± 23.64 | 1.014 (0.954 - 1.432) | 1.419 | 0.159 |
| Percentage of the portal phase CT value of cancer | 122.36 ± 22.32 | 150.73 ± 24.35 | 0.825 (0.712 - 0.893) | 6.051 | 0.000 |
| Relative washout ratio in the portal phase of cancer | -29.32 ± 16.47 | -20.58 ± 15.83 | 0.793 (0.862 - 0.975) | 2.671 | 0.009 |
Comparison of the Texture Features of CT Images Between the Poor and Good Prognosis Groups
 and poor prognosis (C and D) groups. A & C, Before treatment; B & D, After treatment. The lesions in the good prognosis group have clear borders, low density, and uniformity. In the poor prognosis group, there are relatively high-density lesions with blurred boundaries.")
Representative CT images of patients in the good prognosis (A and B) and poor prognosis (C and D) groups. A & C, Before treatment; B & D, After treatment. The lesions in the good prognosis group have clear borders, low density, and uniformity. In the poor prognosis group, there are relatively high-density lesions with blurred boundaries.
4.3. Risk Factors for Poor Prognosis of SABR According to the Multivariate Logistic Regression Analysis
The aforementioned indices with significant differences between the two groups were considered as independent variables, while the prognosis of HCC patients after SABR (good prognosis, 0; poor prognosis, 1) was regarded as the dependent variable. A multivariate logistic regression analysis was performed to determine factors associated with a poor prognosis of SABR. It was found that age ≤ 40 years, serum AFP level > 9 ng/mL, serum GGT level > 60 U/L, serum AST level > 40 U/L, lesion size > 5 cm, unsmooth tumor margins, no tumor capsule or incomplete capsule, multiple tumors, portal phase CT value of cancer > 135%, and relative washout ratio > -24% in the portal phase of cancer were the risk factors for poor prognosis in HCC patients following SABR (Figure 2).
 according to the multivariate logistic regression analysis. Abbreviations: AFP, alpha-fetoprotein; AST, aspartate aminotransferase; CI, confidence interval; GGT, gamma-glutamyl transferase; OR, odds ratio.")
Risk factors for poor prognosis in patients after stereotactic ablative radiotherapy (SABR) according to the multivariate logistic regression analysis. Abbreviations: AFP, alpha-fetoprotein; AST, aspartate aminotransferase; CI, confidence interval; GGT, gamma-glutamyl transferase; OR, odds ratio.
4.4. Analysis of the Clinical Feature Model, CT Image Texture Feature Model, and Joint Model for Poor Prognosis in Patients Following SABR
As for the clinical feature model, the CT image texture feature model, and the joint model of clinical features and CT texture features, the areas under the ROC curves were 0.718 (95% confidence interval [CI]: 0.664 - 0.772, P < 0.001), 0.817 (95% CI: 0.773 - 0.861, P < 0.001), and 0.857 (95% CI: 0.802 - 0.912, P < 0.001), respectively. The sensitivity of the models was estimated at 64.62%, 75.53%, and 80.47%, respectively, and their specificity was estimated at 79.13%, 87.92%, and 91.05%, respectively, suggesting the greater predictive value of the joint model (Table 3 and Figure 3).
| Constants and variables | Model I | Model II | ||||
|---|---|---|---|---|---|---|
| β | Adjusted OR (95% CI) | P | β | Adjusted OR (95% CI) | P | |
| Constant | -2.642 | 0.001 | -1.682 | 0.031 | ||
| Age ≤ 40 years | 1.042 | 2.425 (1.739 ~ 3.111) | 0.042 | 0.764 | 1.834 (1.129 ~ 2.539) | 0.032 |
| AFP > 9 ng/mL | 0.873 | 3.148 (2.426 ~ 3.870) | 0.016 | 0.806 | 2.749 (2.028 ~ 3.470) | 0.010 |
| GGT > 60 U/L | 0.902 | 2.745 (2.035 ~ 3.455) | 0.028 | 0.728 | 2.238 (1.464 ~ 3.012) | 0.024 |
| AST > 40 U/L | 0.824 | 2.874 (2.062 ~ 3.686) | 0.024 | 0.742 | 2.702 (1.986 ~ 3.418) | 0.012 |
| Lesion size > 5 cm | - | - | - | 1.231 | 2.893 (2.135 ~ 3.651) | 0.007 |
| Uneven tumor margin | - | - | - | 0.865 | 3.016 (2.245 ~ 3.787) | 0.004 |
| No capsule or incomplete capsule | - | - | - | 0.932 | 3.418 (2.642 ~ 4.194) | < 0.001 |
| Multiple tumors | - | - | - | 1.015 | 3.216 (2.732 ~ 3.700) | 0.001 |
| Percentage of the portal phase CT value of cancer > 135% | - | - | - | 1.142 | 2.645 (1.962 ~ 3.328) | 0.015 |
| Relative washout ratio in the portal phase of cancer > -24% | - | - | - | 0.983 | 2.426 (1.843 ~ 3.081) | 0.021 |
Values of the Clinical Feature Model, the CT Texture Feature Model, and the Joint Model for Poor Prognosis in Patients Following SABR
 based on the receiver operating characteristic (ROC) curve analysis.")
The clinical feature model, the CT image texture feature model, and the joint model for the poor prognosis of patients after stereotactic ablative radiotherapy (SABR) based on the receiver operating characteristic (ROC) curve analysis.
4.5. Development of the Nomogram Prediction Model
The nomogram prediction model for poor prognosis of HCC after SABR was developed based on the results of the multivariate logistic regression analysis. Age ≤ 40 years, serum AFP > 9 ng/mL, serum GGT > 60 U/L, serum AST > 40 U/L, lesion size > 5 cm, unsmooth tumor margins, no tumor capsule or incomplete capsule, multiple tumors, portal phase CT value of cancer > 135%, and relative washout ratio > -24% in the portal phase of cancer were scored 18, 28, 20, 26, 30, 32, 38, 35, 25, and 21, respectively. The total score (273) referred to the incidence rate of poor prognosis (43.00%) in HCC patients following SABR (Figure 4).

Development of the nomogram prediction model. Abbreviations: AFP, alpha-fetoprotein; AST, aspartate aminotransferase; GGT, gamma-glutamyl transferase; SABR, stereotactic ablative radiotherapy.
4.6. Evaluation of the Nomogram Prediction Model
The calibration and validity of the nomogram model for assessing the poor prognosis of HCC patients after SABR were evaluated using the calibration curve and clinical decision curve analyses, respectively. When the incidence rate of poor prognosis was 14%, 40%, and 73%, the predicted value was identical to the value of the model. The risk was overestimated if the event rate was < 14% and 40-73%, while it was underestimated if it was 14 - 40% and 73 - 100% (Figure 5). Overall, the accuracy of the nomogram prediction model was high. Based on the clinical decision curve, the nomogram prediction model showed a high net benefit and validity.

Evaluation of the nomogram prediction model. A, Calibration curve of the nomogram prediction model; B, Clinical decision curve of the nomogram prediction model.
5. Discussion
HCC is primarily associated with chronic HBV infection and is recognized as the third most common cause of cancer-related death worldwide (9). In China, HCC accounts for 50% of all global cancer cases. It also has the fourth highest morbidity rate among various cancers, and its mortality rate is fairly high (10). HCC should be treated as early as possible after diagnosis. Clinically, treatment of this cancer tends to be individualized, diversified, and integrated with the development of medical technologies, which can remarkably improve the treatment efficacy, whereas risks, such as recurrence, metastasis, infiltration, and poor prognosis after treatment, still exist (11).
To reduce the mortality rate of patients, it is crucial to seek pretreatment diagnostic methods and indices and enhance the prognostic value for HCC. Generally, CT has a high value in identifying tumors; however, it is not helpful in detecting active residual lesions (12). The texture feature analysis of tumor CT images includes intensity, texture, shape, and wavelet transform. A pretreatment analysis can provide further information for assessing the prognosis of HCC patients (13). In this regard, a study revealed that the texture feature analysis of CT images is of a high differential diagnostic value for lung diseases (14); nevertheless, its prognostic value for HCC patients after treatment has been rarely investigated. Therefore, in the present study, the clinical and texture features of CT images were compared in patients with different prognoses. Also, the risk factors for poor prognosis were analyzed in HCC patients after SABR, and the value of CT texture feature analysis in predicting the poor prognosis of patients was explored to provide clinical evidence for selecting individualized treatment protocols and improving the prognosis of HCC patients in the clinical setting.
Generally, various factors affect the poor prognosis of HCC patients after treatment, and there are many reports available in the literature; however, no thorough explanation has been approved yet. It was reported that age ≤ 40 years is a risk factor for the early recurrence of liver cancer following partial hepatectomy (15). In this study, age ≤ 40 years was a risk factor for the poor prognosis of HCC patients after SABR. A possible reason for this finding is that patients aged ≤ 40 years are more vulnerable to HBV infection, and chronic HBV infection is closely associated with the occurrence of HCC (16); these patients have a faster tumor growth, a higher TNM stage, and a higher risk of portal vein tumor thrombus and metastasis.
Regarding gastric cancer, colon cancer, and breast cancer, younger patients usually have a poorer prognosis (15). AFP, a specific glycoprotein synthesized by the liver in the fetal period, has an extremely low content in the serum of normal adults. Chen et al. (17) found that the elevation of serum AFP level before surgery was associated with the poor prognosis of HCC patients following transcatheter arterial chemoembolization, which is highly valuable for assessing the patients' prognosis. In this study, a preoperative serum AFP level > 9 ng/mL was a risk factor for the poor prognosis of patients, probably because AFP gene is reactivated and highly expressed in the serum after the onset of HCC in adults, and the consistently increasing AFP level can stimulate HCC growth, leading to a poor prognosis.
As a frequently used sensitive indicator for the clinical diagnosis of hepatobiliary disease, GGT participates in nucleic acid metabolism, biotransformation, and tumorigenesis and functions as a key enzyme in glutathione catalysis. According to a study by Yang et al. (18), a high serum level of GGT is an independent risk factor for the postoperative recurrence of HBV-related HCC. In the present study, it was found that a serum GGT level > 60 U/L before surgery was a risk factor for the poor prognosis of patients. This finding may be related to the fact that proliferation of HCC cells increases the serum level of GGT, and a high level of GGT promotes the malignant progression of HCC. Meanwhile, GGT is involved in oxidative stress, jointly causing poor prognosis in HCC patients after SABR.
AST is a kind of enzyme, representing liver injury and liver disease progression in the clinical setting. Gogia et al. (19) found that an increased serum AST level before surgery was a risk factor for liver failure in liver cancer patients following hepatectomy. Based on the results of this study, a preoperative serum AST level > 40 U/L was a risk factor for the poor prognosis of HCC patients after SABR. To explain this finding, it should be noted that an increased serum AST level increases the cell membrane permeability, which in turn aggravates liver cell injury. Meanwhile, a high AST level is correlated with HBV infection, thereby affecting the patients’ prognosis.
CT, which is an important imaging method for the preoperative assessment of HCC patients, mainly relies on empirical judgment with great subjectivity and limitations. The texture feature analysis of CT images aims to provide more accurate information on pathological changes of tumors through quantitative analysis of CT images, which can help provide individualized, comprehensive, and suitable treatments for HCC patients and improve their prognosis (20). Zang et al. (21) found that tumor number ≥ 2, tumor size > 5 cm, and lack of tumor capsule or incomplete capsule were risk factors for the prognosis of HCC patients after hepatectomy, which is consistent with the findings of the present study. Tumor multifocality suggests the multifocal growth or intrahepatic metastasis of the tumor. The risk of microvascular invasion and early recurrence increases as the tumor enlarges, and the lack of fibrous capsule or incomplete fibrous capsule of the tumor does not allow tumor cells to invade the adjacent liver parenchyma, thereby resulting in a poor prognosis.
The study conducted by Zheng et al. (22) revealed that HCC patients with early recurrence after radical resection had a markedly higher proportion of uneven tumor margins, a higher percentage of portal phase CT value of cancer, and a higher relative washout ratio in the portal phase of cancer compared to those without early recurrence. According to the results of this study, uneven tumor margins, portal phase CT value > 135%, and relative washout ratio > -24% in the portal phase of cancer were the risk factors for a poor prognosis in patients.
The gross morphology of a tumor can be determined based on the tumor margin (smooth or not); an unsmooth tumor margin signifies the invasive growth of the tumor. When the percentage of portal phase CT value of cancer increases, persistent enhancement of the portal vein suggests that both hepatic artery and portal vein supply blood to the liver tumor. In this study, the nomogram prediction model was developed based on the multivariate analysis. It was found that the model had adequate accuracy and validity for assessing the poor prognosis of HCC patients following SABR.
In conclusion, age ≤ 40 years, serum AFP level > 9 ng/mL, GGT level > 60 U/L, AST level > 40 U/L, lesion size > 5 cm, uneven tumor margins, no tumor capsule or incomplete capsule, multiple tumors, portal phase CT value of cancer > 135%, and relative washout ratio > -24% in the portal phase of cancer were the risk factors for poor prognosis in HCC patients following SABR. The examination of the texture features of CT images before SABR has a certain prognostic value for HCC patients and can help select an appropriate treatment protocol. However, this study had some limitations. Some patients may undergo chemotherapy regimens concurrently, affecting their tumor response to SABR. We can exclude the possibility of bias by performing multicenter studies with a larger sample size. Besides, the exact definition of therapeutic response in multifocal HCC is not provided. Finally, pathological grading is not discussed.
