1. Background
Positron emission tomography (PET) is based on the emission of two 511 KeV gamma rays positioned at almost 180 degrees from each other. First, a sinogram captures position and degree information. Then, one of several image reconstruction methods is used to generate the PET images. Such methods can be based on analytical approaches, which offer a direct mathematical solution for image formation; or on iterative approaches, which employ iterative algorithms to reconstruct two- and three-dimensional (2D and 3D) images in certain imaging modalities. Analytical approaches include filtered back-projection (FBP), the three dimensional reprojection algorithm (3DRP), and the Fourier rebinning (FORE) algorithm. The 3DRP method has a long convergence time due to the extensive calculations required (1); however, the FORE algorithm reduces the amount of calculation required (2). Iterative approaches include maximum likelihood-expectation maximization (ML-EM) and ordered subsets expectation maximization (OSEM). ML-EM imaging generates higher-quality images than FBP, with less noise (3-5). However, the disadvantage of ML-EM is that it requires long convergence time. The OSEM algorithm was developed to overcome these limitations (6).
Different image reconstruction methods have been compared in cardiac PET studies. In a porcine PET study using [15O] H2O, iterative reconstruction methods (OSEM3D and FORE-OSEM) were either equal to or more accurate than 3DRP and FORE-FBP for the absolute quantification of myocardial blood flow (MBF) (7). A dynamic cardiac study of 2-deoxy-2[18F] fluoro-D-glucose ([18F] FDG) and [13N] NH3 also reported that iterative reconstruction using OSEM resulted in better image quality and less noise than FBP (8). Another study also reported that OSEM3D generated less noise than the FBP, 3DRP, and OSEM2D algorithms (9).
We previously reported the synthesis and characterization of 18F-labeled phosphonium cations, such as (5-[18F]fluoropentyl)triphenylphosphonium ([18F]FPTP) salt, as voltage sensors for myocardial imaging (10-13). Similarly to single photon emission computed tomography (SPECT) tracers such as 99mTc-sestamibi and 99mTc-tetrofosmin, [18F] FPTP accumulates in myocardium through the high mitochondrial membrane potential (MMP) of cardiomyocytes. [18F]FPTP showed stable uptake in the myocardium and rapid clearance from the blood and other organs, and enabled excellent image quality and accurate evaluation of myocardial infarction (MI) size in rat models of coronary occlusion (13).
2. Objectives
The aim of the present study was to determine an optimal PET reconstruction method that could generate the highest image quality through reflection of the original image. Therefore, we compared the quality of cardiac PET images generated from four kinds of different reconstruction methods (FBP, OSEM2D, OSEM3D, and 3DRP) that were obtained using [18F] FPTP in left coronary artery (LCA)-occluded rats. Additionally, the infarction size was measured on the polar map of each reconstructed image and compared with the defect size measured via TTC staining (as the gold standard).
3. Materials and Methods
All reagents were purchased from Sigma-Aldrich or Merck and were of analytical grade. The nuclear magnetic resonance (NMR) spectra (1H and 13C) were recorded on a JEOL ECA-500 FT-NMR spectrometer (advanced radiation technology institute). Mass spectra were recorded on a JEOL JMS-AX505WA spectrometer. Compounds were analyzed by electrospray ionization and fast atom bombardment methods at the national center for inter-university research facilities. Merck silica gel 60 (70-230 mesh ASTM) was used for gravity column chromatography. Thin-layer chromatography was performed with Merck silica gel 60 F254 and was detected by UV light. Purification was achieved by HPLC, and a FC-3200 high-energy gamma detector was used to measure radioactivity. UV detection was used for all HPLC purification (wavelength: 254 nm). A CRC-712MH radioisotope calibrator was used for measurement of radioactivity. Normal rats were imaged using dedicated microPET (Inveon). No-carrier-added 18F was produced by 18O (p,n) 18F nuclear reaction from on a PET trace cyclotron (16.4 MeV, Chonnam national university Hwasun hospital).
3.1. Radiochemistry
Radiosynthesis of [18F] FPTP: [18F] FPTP was prepared following the described method (13). In brief, activated 18F fluoride was added to 4.0 mg of pentane-1, 5-diyl bis (4-methylbenzenesulfonate) dissolved in acetonitrile. The reaction mixture was heated for 5 minutes at 90°C. The solution was passed through a small silica Sep-Pak cartridge. Six milligram of triphenylphosphine was dissolved in toluene and added to the reaction vessel, heated to 220°C for 3 minutes. After cooling, the solution was injected onto a semi-preparative HPLC system. For identification of the radioproduct, the collected HPLC fraction was co-injected with its nonradioactive compound onto an analytical HPLC system.
3.2. Myocardial Infarction Model
A MI models (Sprague-Dawley rats, n = 8, mean weight = 228g, mean age = 7 weeks) were generated by left circumflex coronary artery ligation. Three days after MI generation, [18F] FPTP (37 MBq) was injected into rat via the tail vein. Static images were acquired at the time of injection and for 30 minutes.
3.3. MicroPET Imaging and Reconstruction
PET images were obtained using a high-resolution small animal PET-SPECT-CT scanner (Inveon, Siemens Medical Solutions, Malvern, PA, USA) with 20 × 20 lutetium oxyorthosilicate (LSO) crystals, each measuring 1.5 × 1.5 × 10 mm3. The system comprised 64 detector blocks arranged in four contiguous rings, with a detector ring diameter of 16.1 cm, a transaxial field of view (FOV) of 10 cm, and an axial FOV of 12.7 cm. Acquired data were sorted into 3D sinograms or directly into 2D sinograms. 3D sinograms were then rebinned by the Fourier algorithm (FORE) (14, 15). The acquired 3D sinograms were reconstructed in 2D using the FBP and OSEM2D algorithms, and in 3D using the OSEM3D and 3DRP algorithms (16).
FBP reconstruction was performed using a ramp filter at the Nyquist frequency (0.5 cycles/pixel). For the OSEM2D and OSEM3D algorithms, data were reconstructed using 16 subsets and any of four iterations. The 3DRP algorithm was performed without filtering at the Nyquist frequency. All images measured 128 pixels × 128 pixels × 159 slices.
Myocardial perfusion status was determined on short, horizontal, and vertical long-axis images. In addition, the perfusion values for the different groups were compared using 17-segment polar maps.
3.4. Image Analysis
PMOD version 3.204 (PMOD technologies Ltd., Zurich, Switzerland) was used for image analysis. Short-axial images of the heart were compared with 2, 3, 5-triphenyltetrazolium chloride (TTC)-stained photographs to assess the location(s) of perfusion defects. The PMOD cardiac PET modeling tool was used to measure perfusion in a 17-segment model of the left ventricle.
3.5. Myocardial Infarction Size
Perfusion defect size was compared between small animal PET images and the hypoperfused area in TTC-stained imagery, which is the gold standard (17, 18).
3.5.1. Quantitative TTC staining
TTC-stained photographs were converted to grayscale images (Figure 1. A, B). Based on appropriate threshold values (shown as peaks on the histogram of the gray images), the background and myocardium area were distinguished (Figure 1. C). Next, the isolated myocardium image was processed by Sobal mask convolution to isolate the hypoperfused area. The edge image was then removed, leaving only the MI area (Figure 1. D). The area of the MI was quantified from this image.
3.5.2. Myocardial perfusion polar map
The perfusion value per segment was determined using a myocardial perfusion polar map generated from static images. The infarct area was defined as any area with a perfusion value of 60% or less (19-21). Correlations were calculated, between defect sizes for the TTC and polar maps. Additionally, the ratio of the area of the entire myocardium relative to that of the MI, and the average perfusion in normal and infarct areas were calculated.
3.6. Image Contrast and Quality
Image contrast, which defined as the difference between two images generated by each reconstruction method, was measured to assess image quality. Image contrast was calculated based on the Michelson contrast formula, as follows:
Image contrast (%) = (max-min) / (max+min)×100
(max and min represent the highest and lowest pixel values, respectively, in the myocardial perfusion polar map of the [18F]FPTP image).
Inter- and intra-observer reliability were assessed by two experienced nuclear medicine physicians, who were blinded to the reconstruction methods. The 32 images were randomly rearranged and given to the two readers. Visual image quality was graded using a 3-point scoring system (in which 1, 2, and 3 representing poor, acceptable, and good, respectively). We calculated the summation of score in each reconstruction method (22).
3.7. Statistical Analysis
Statistical analyses were performed using SPSS ver. 21.0 software (IBM Corp. Released 2012. IBM SPSS Statistics for Windows, Version 21.0. Armonk, NY: IBM Corp.). Infarction size (determined by TTC staining and obtained from myocardial perfusion polar maps) was compared using Spearman’s correlation coefficient. To compare image contrast, a nonparametric Wilcoxon test was used to analyze data generated by each modality. Repeated measures and matched subjects experimental designs were used.
4. Results
Static images for 30 minutes post-injection were obtained by microPET and visualized in the view mode of the PMOD software after reconstruction (Figure 2). [18F] FPTP microPET provided a clear view of the MI area. The OSEM3D reconstruction method provided the smoothest images, followed by 3DRP, FBP, and OSEM2D.
Static PET images of MI model (n = 8) using the new myocardial imaging agent [18F] FPTP were taken every 30 minutes. PET images were reconstructed by A, FBP; B, OSEM2D; C, OSEM3D; or D, 3DRP. (Abbreviations: PET; positron emission tomography, MI; myocardial infarction, [18F] FPTP; 5-[18F] fluoropentyl)triphenylphosphonium, FBP; filtered back-projection, 3DRP; three dimensional reprojection algorithm, OSEM2D, two-dimensional ordered subsets expectation maximization; OSEM3D, three-dimensional ordered subsets expectation maximization).
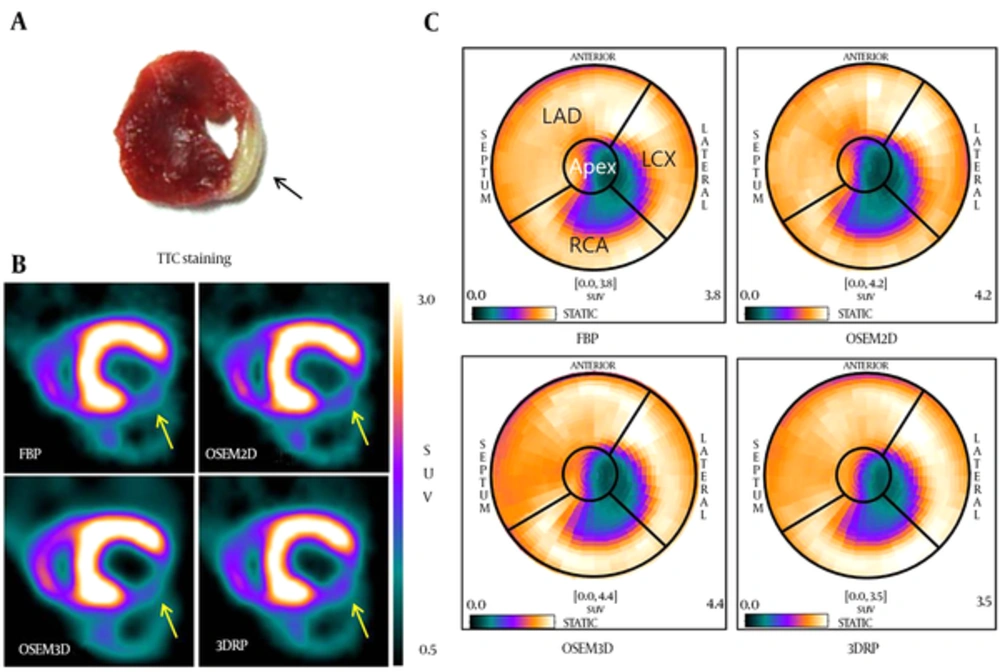
The accuracy of short-axis images generated by each reconstruction method was compared with that of TTC-stained myocardium from corresponding animals (Figure 3A and B). The location of the MI on PET images corresponded well to that observed upon TTC staining (arrow of Figure 3A and B). To measure the infarct size on PET images, myocardial perfusions in polar map images (reconstructed by FBP, OSEM2D, OSEM3D, or 3DRP) were obtained using the cardiac modeling tool in PMOD to demonstrate the MI region (Figure 3C). The defect area was observed in the apex and the left circumflex artery (LCX) area on the heart polar map. The size of the stained region on TTC photographs was compared with the defect size calculated from polar map images generated using the different reconstruction methods. The infarction size measured via the four reconstruction methods was similarly measured with TTC (Table 1). The average infarction size of TTC was 29.23 ± 6.19. On the heart polar maps, the average infarction sizes of FBP, OSEM2D, OSEM3D, and 3DRP were 27.94 ± 8.17, 30.88 ± 9.30, 29.41 ± 7.70 and 27.94 ± 8.17, respectively. OSEM3D reflected the change rate of infarction size better than other methods. The correlation was highest in polar map images with a threshold of 60% and reconstructed by OSEM3D (r = 0.994, P < 0.001), followed by 3DRP (r = 0.976, P < 0.001), FBP (r = 0.982, P < 0.001), and OSEM2D (r = 0.812, P = 0.014).
Infarct locations in TTC image (A), short-axis PET images (B), and polar map images (C) reconstructed by the FBP, OSEM2D, OSE3D, and 3DRP algorithms. (Abbreviations: PET; positron emission tomography, FBP; filtered back-projection, 3DRP; three dimensional reprojection algorithm, OSEM2D, two-dimensional ordered subsets expectation maximization; OSEM3D, three-dimensional ordered subsets expectation maximization, TTC; 2,3,5-triphenyltetrazolium chloride).
| Infarction Size | TTC | FBP | OSEM2D | OSEM3D | 3DRP |
|---|---|---|---|---|---|
| Average (%) | 29.23 | 27.94 | 30.88 | 29.41 | 27.94 |
| Standard deviation | 6.19 | 8.17 | 9.30 | 7.70 | 8.17 |
| TTC staining | Spearman correlation coefficient | 0.982 | 0.812 | 0.994 | 0.976 |
| P Value | < 0.001 | 0.014 | < 0.001 | < 0.001 |
Abbreviations: 3DRP, three-dimensional reprojection; FBP, filtered back projection; OSEM2D, two-dimensional ordered subsets expectation maximization; OSEM3D, three-dimensional ordered subsets expectation maximization; TTC, 2,3,5-triphenyltetrazolium chloride.
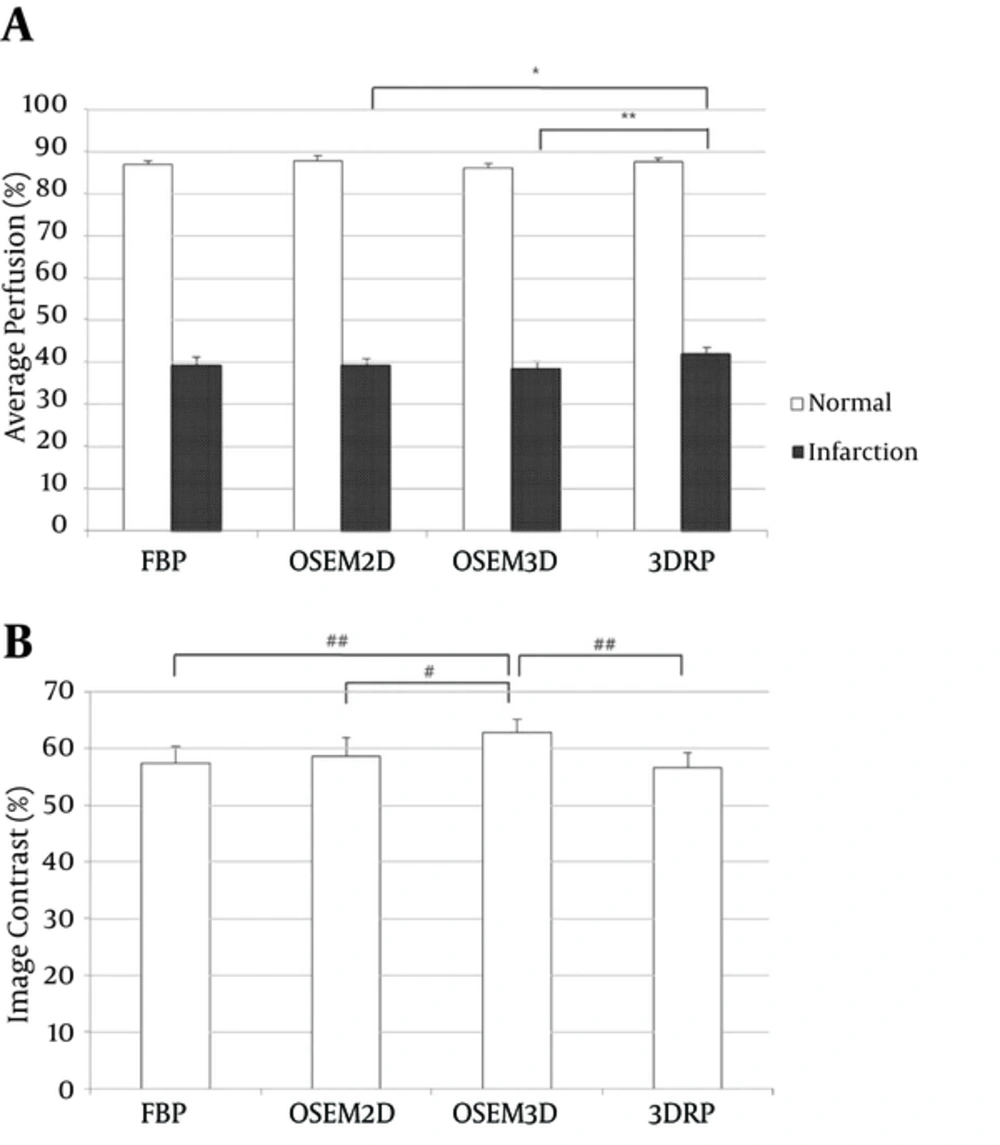
We next evaluated average perfusion values in the normal and infarcted areas of the polar maps. The average perfusion values measured in normal myocardium using each of the four algorithms (FBP, OSEM2D, OSEM3D, and 3DRP) were 86.75, 87.60, 86.06, and 87.40%, respectively, while those in the infarction area were 39.17, 39.05, 38.22, and 41.84%, respectively (Figure 4A). In normal segments, a significant difference in average perfusion was found between OSEM2D and OSEM3D (P = 0.038). In infarcted segments, the average perfusion calculated using the 3DRP algorithm was significantly higher than that calculated using OSEM2D (P = 0.028) or OSEM3D (P = 0.008). We also compared image contrast, as calculated from the maximal and minimal pixel values of the myocardial perfusion polar maps reconstructed by each of the four algorithms. Mean image contrast measured in PET images reconstructed using FBP, OSEM2D, OSEM3D, and 3DRP (from 8 MI rats) was 55.30, 56.91, 60.39, and 54.91%, respectively (Figure 4B). The OSEM3D reconstruction method provided the highest image contrast; significantly better than FBP (P = 0.005) and 3DRP (P = 0.005), but not OSEM2D (P = 0.093). There was no significant difference between FBP and OSEM2D (P = 0.646), FBP and 3DRP (P = 0.333), or OSEM2D and 3DRP (P = 0.203).
Average perfusion (A) and image contrast (B) for FBP, OSEM2D, OSEM3D, and 3DRP. The average perfusion of normal and infarct areas was measured on the polar maps. Image contrast was calculated using the Michelson contrast formula (see methods) (Abbreviations: FBP; filtered back-projection, 3DRP; three dimensional reprojection algorithm, OSEM2D, two-dimensional ordered subsets expectation maximization; OSEM3D, three-dimensional ordered subsets expectation maximization).
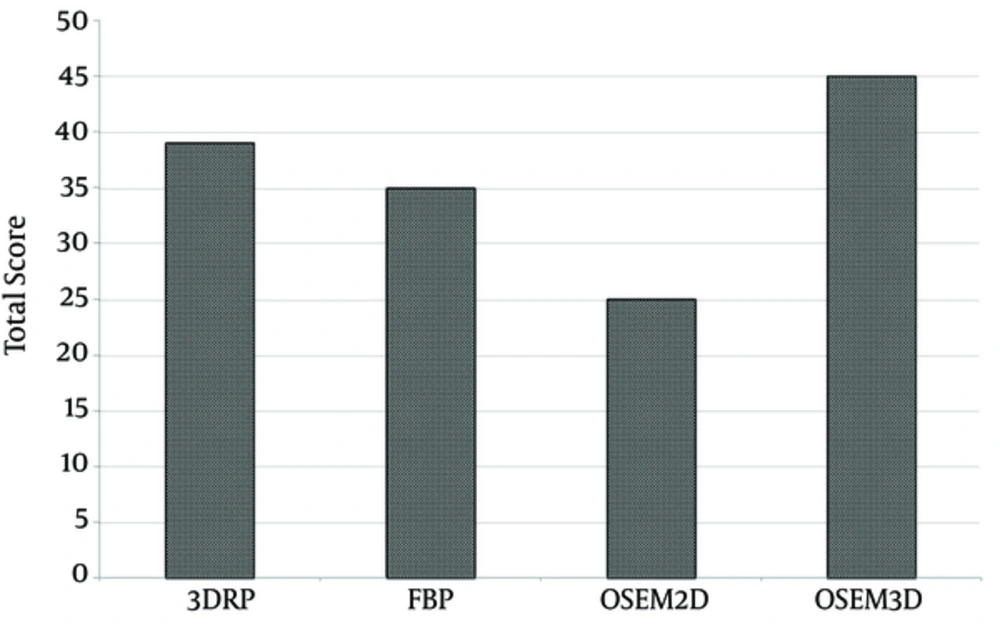
Finally, we also calculated the summation of score (total score) in each the reconstruction method (Figure 5). The OSEM3D method achieved a total score of 45, followed by 3DRP, FBP, and OSEM2D (with scores of 35, 25, and 39, respectively).
Total scores for each reconstruction method were calculated by blind assessment of image quality. The total score of OSEM3D was higher than that of other reconstruction methods. (Abbreviations: FBP; filtered back-projection, 3DRP; three dimensional reprojection algorithm, OSEM2D, two-dimensional ordered subsets expectation maximization; OSEM3D, three-dimensional ordered subsets expectation maximization).
5. Discussion
Here, we compared cardiac PET images generated using a newly developed myocardial imaging agent, [18F] FPTP, according to the method used for image reconstruction. Image quality of OSEM reconstruction method was enhanced and noise level of OSEM reconstruction method was reduced than that of FBP. Therefore, image contrast was greater in the OSEM reconstruction method. However, there was no significant difference in image contrast between OSEM2D and OSEM3D, because of equaled iteration number of OSEM2D and OSEM3D. However, average image contrast differed between OSEM2D and OSEM3D, because the image acquisition mode was different. The results reveal that OSEM3D provided the best image quality with the highest image contrast, both of which allowed clear delineation of defect borders and accurate measurement of infarct size. Using polar maps reconstructed with a 60% perfusion threshold, which shows the greatest level of statistical significance (13), the defect size and MI size calculated using the OSEM3D algorithm showed excellent correlation with those measured by TTC staining, which is the gold standard for measuring the size of both reperfused and non-reperfused MI. Visser et al. reported that the deterioration in axial resolution associated with conventional FORE for 2-D reconstruction could be improved by using 3-D reconstruction without the rebinning step. However, FORE and 2D reconstruction are still widely used because of the greater complexity and longer reconstruction time required for 3D algorithms (23). Similar results were reported by Baghaei et al. in 2004 (24). They evaluated the performance of OSEM3D, 3DRP SSRB (Single Slice ReBinning), and FORE followed by 2D image reconstruction for 3D PET imaging of MDAPET camera using a uniform cylindrical phantom and 3D Hoffman brain phantom. They found that the OSEM3D algorithm performed best for contrast recovery, and that images were less noisy. Razifar et al. reported that the variance across the PET images shows a significantly broader distribution with FBP than with OSEM (25).
Some limitations of the present study should be considered. Firstly, CT attenuation correction was not performed in the PET imaging to compare PET images directly. Secondly, we used acute MI models with permanent left circumflex (LCX) ligation as true positive. This model reflects myocardial defects well but is not identical to the clinical situation in which hemodynamically relevant stenosis is unmasked by a stress-induced increase of myocardial blood flow. Further studies are needed to validate [18F] FPTP PET for the detection of small myocardial ischemia and scars associated with chronic infarction.
In conclusion, each of the FBP, OSEM2D, OSEM3D, and 3DRP reconstruction methods reflects well the myocardial state, but OSEM3D showed higher correlation with TTC staining. OSEM3D may also provide better image quality and contrast than other methods when used for small animal imaging with the new myocardial imaging agent, [18F] FPTP.

![Static PET images of MI model (n = 8) using the new myocardial imaging agent [<sup>18</sup>F] FPTP were taken every 30 minutes. PET images were reconstructed by A, FBP; B, OSEM2D; C, OSEM3D; or D, 3DRP. (Abbreviations: PET; positron emission tomography, MI; myocardial infarction, [18F] FPTP; 5-[18F] fluoropentyl)triphenylphosphonium, FBP; filtered back-projection, 3DRP; three dimensional reprojection algorithm, OSEM2D, two-dimensional ordered subsets expectation maximization; OSEM3D, three-dimensional ordered subsets expectation maximization). Static PET images of MI model (n = 8) using the new myocardial imaging agent [<sup>18</sup>F] FPTP were taken every 30 minutes. PET images were reconstructed by A, FBP; B, OSEM2D; C, OSEM3D; or D, 3DRP. (Abbreviations: PET; positron emission tomography, MI; myocardial infarction, [18F] FPTP; 5-[18F] fluoropentyl)triphenylphosphonium, FBP; filtered back-projection, 3DRP; three dimensional reprojection algorithm, OSEM2D, two-dimensional ordered subsets expectation maximization; OSEM3D, three-dimensional ordered subsets expectation maximization).](https://services.brieflands.com/cdn/serve/3170b/bda71afe34b7c760538aadcee132c1a888909b18/iranjradiol-14-1-13463-g002-preview-preview.webp)


