1. Background
Prostate cancer continues to be diagnosed with increasing frequency (1). Detection and clinical staging of prostate cancer currently includes a prostate specific-antigen (PSA) test, a digital rectal examination (DRE), and a transrectal ultrasound (TRUS) guided biopsy (2). The TNM stage is obtained using these variables and treatment of prostate cancer is based on the clinical stage and is patient specific (3).
The most important predictors of prognosis in prostate cancer are Gleason score (GS) and tumor staging (4). In fact, the grading scheme has now become so vital that it is often used as an integral piece of information for both disease management and treatment stratification in patients with prostate cancer before and after definitive therapy (5, 6). Pre-treatment knowledge of the final Gleason grade would be an important advance; however, such information remains elusive (7). Biopsy determination of the Gleason grade often does not provide an accurate reflection of the final Gleason grade (i.e., whole-organ pathologic characteristics) (8, 9). Despite revisions in 2005 and 2014, the Gleason prostate cancer grading system still has major deficiencies (10).
Multi-parametric prostate magnetic resonance imaging (MRI) is currently regarded as the most sensitive and specific imaging technique for prostate cancer evaluation, including detection, staging, localization, and aggressiveness measurement (11, 12). In addition to conventional T2-weighted images, Multiparametric magnetic resonance imaging (MP-MRI) techniques yield additional biological information on diffusion-weighted (DW) MR images, dynamic contrast enhanced (DCE) MR images, and spectroscopic images (13, 14). Combination of anatomical and functional imaging provided in this exam significantly increases the accuracy of prostate cancer detection (15).
MP-MRI has a favorable correlation with prostatectomy histo-pathology findings (1). These advanced functional imaging techniques may help increase the sensitivity of prostate cancer detection and the accuracy of predicting the GS, which is a measure of cancer aggressiveness (16).
2. Objectives
The purpose of this study was to determine associations of metabolite levels derived from spectroscopic imaging (i.e., hydrogen 1 [1H] MR spectroscopic imaging), apparent diffusion coefficient (ADC) from DWI and Ktrans, and Kep from DCE MRI with whole-mount pathological finding as reference standard.
3. Patients and Methods
3.1. Study Design
This prospective study was approved by the institutional review board. Informed consent was obtained from all patients. Twenty four consecutive prostate cancer patients who underwent an MRI exam followed by radical prostatectomy from September 2015 to April 2016 were incorporated in this study. The average period between MRI and prostatectomy was 40 days (7 - 100 days). All patients had biopsy proven adenocarcinoma of the prostate and the mean GS was 6.7 (median, 7; range, 6 - 9). GS is a system of grading prostate cancer tissue based on how it looks under the microscope. It ranges from 2 to 10 and indicates how likely it is that a tumor will spread. Inclusion criteria required performance of radical prostatectomy within 180 days of imaging without any intervening treatment. Exclusion criteria were contraindications to MRI (such as cardiac pacemakers, prosthetic valves, and severe claustrophobia).
3.2. MRI Protocols
All MRI examinations were performed on a Siemens Avanto 1.5 Tesla MAGNETOM MRI using an eight channel abdominal array. The MRI protocol included triplanar T2w, DW MRI, three dimensional (3D) MR spectroscopy, axial post contrast T1W, axial 3D fast field echo (FFE) DCE MRI sequences, and their detailed sequence parameters (17). The mean interval between radical prostatectomy and MRI was 60 days (range, 3 - 180; median, 48). The interval between TRUS guided biopsy and MRI was 10 or more weeks to avoid post biopsy hemorrhage related MRI signal changes.
We imaged the entire prostate. We acquired the following images: axial, coronal, and sagittal T2W MR images; axial T1W MR images; axial free-breathing DW MR images (b values of 0, 1000, 1500, and 2000 mm2/s); and axial free-breathing DCE MR images. Acquisition of DCE MR images of the entire prostate started 30 seconds before intravenous administration of approximately 0.1 mmol/kg of gadolinium-diethylenetriamine pentaacetic acid (Gd-DTPA), which was followed by a 20-mL saline flush at a rate of 2.0 mL/sec. Image acquisition details are summarized in Table 1 (16).
| Parameter | Axial T1W | Axial T2W | Sagittal T2W | Coronal T2W | DWI | DCE | MRS |
|---|---|---|---|---|---|---|---|
| Pulse Seq | FSE | FSE | FSE | FSE | EPI | GRE | PRESS |
| TE, ms | 10 - 12 | 100 | 100 | 100 | 72 | 1.6 | 130 |
| TR, ms | 300 | 4000 | 3500 | 4000 | 4800 | 3.3 | 1000 |
| ETL | 3 | 20 | 20 | 20 | - | - | - |
| BW | 50 | 20 | 20 | 20 | 250 | - | |
| FOV | 32 | 20 | 20 | 20 | 32 | 18 | 110 × 110 |
| Matrix | 320 × 224 | 256 × 256 | 256 × 192 | 256 × 192 | 128 × 128 | 64 × 64 | 16 × 8 × 8 |
| Thickness | 5 | 5 | 4 | 3 | 5 | 4 | - |
Image Parameters for MP-MRI of the Prostate
3.3. MRI and Histopathological Analysis
Prostatectomy specimens were fixed in 10% buffered formalin, processed, and cut serially into 4 mm thick blocks from apex to base in transverse planes. Each block was then quartered, and 4 μm thick microtome slices were stained with hematoxylin and eosin (H & E). A pathologist who had 8 years of experience in pathology and a radiologist who had 15 years of experience in MR imaging, established the reference standard for prostate and normal tissue on MR images through a systematic MR-histology correlation. The pathologist specified all discrete tumor areas larger than 5 mm in diameter, and the radiologist manually outlined the corresponding regions of interest (ROIs) of the tumor areas on MR images. To increase accuracy, this process for each patient was performed twice, and in some cases three times. Then, by consensus the radiologist manually outlined ROIs of the corresponding tumor areas on MR images that correlated with the histologic findings. The radiologist drew ROIs on MR images that matched with the tumor and were identified on the specimen by the pathologist (Figure 1). In each case, tumor ROIs of the peripheral and transition zone were outlined if present. Normal tissue areas were also outlined in the peripheral zone in locations that the pathologist indicated as normal.
A radiologist matched the whole mount pathologic slides with the corresponding T2W MR images. Since cutting and fixation may lead to deformation of the gland, the exact correspondence between pathologic slides and MR sections was not expected. The most accurate method to match axial MR images with slices of pathology are the anatomic landmarks.
A total of 87 ROIs were outlined, among which 37 were from normal peripheral zone tissue and 50 were from prostate cancer tumors. Although 68 ROIs (52 ROIs on prostate cancer zone and 16 ROIs on normal tissue zone) were outlined in a T2W image section, 13 ROIs (9 ROIs on prostate cancer zone and 4 ROIs on normal tissue zone) were outlined in a DW MRI section and 6 other ROIs (4 ROIs on prostate cancer zone and 2 ROIs on normal tissue zone) were outlined in a DCE MRI section because those ROIs correlated better with histologic findings in those images than in the T2W images. The pathologist also assigned a GS specifically to each cancer ROI (Table 2).
3.4. MRI Analysis
3.4.1 Diffusion Weighted Imaging Analysis
Apparent diffusion coefficient (ADC) maps were generated from DW images with commercial diffusion analysis software (Leonardo console, software version 2.0; Siemens). ROIs were drawn independently on the ADC maps. For ADC measurements of prostate cancer, the tumoral areas on T2W images were used to measure ADC value, constituting a total of 24 ADC value measurements at all three diffusion gradients in each patient. The ADC values were measured by insertion of ROI that had a mean area of 30 mm2. ADCs were calculated for all slices by Equation 1 (mm2/s):
Where S1 is the signal intensity of a voxel after application of a diffusion gradient and S0 is the echo magnitude without diffusion gradients applied (b = 0 s/mm2).
3.4.2. MRS Analysis
In MR spectroscopic imaging (MRS) of the prostate, the ratio of choline plus creatine over citrate [(Cho + Cr)/Cit] is used as a marker for the presence of prostate cancer (18). For each lesion characterized with pathology, it was determined whether the lesion was detected by spectroscopy. The lesion was considered detected by spectroscopy if at least one voxel had been classified as suspicious for cancer in the corresponding position, and within one slice of the corresponding pathologic section. Three-dimensional (3D) MR spectroscopic imaging of the entire prostate was performed using a selected box drawn closely around the prostate. Data were processed by using the manufacturer’s software package. Estimates of the areas under the resonances of the metabolite peaks were obtained by integrating a region centered at each peak. The metabolites studied were those resonating at approximately 2.98 parts per million (ppm) for Cho, 3.06 ppm for Cr, and 2.71 ppm for Cit. The normalized peak areas for Cho, Cr, and Cit for each tumor voxel were tabulated and used to calculate (Cho + Cr)/Cit ratios.
3.4.3. DCE-MRI Analysis
DCE-MRI was performed after the spectroscopy exam to avoid potential line-broadening effects of the paramagnetic contrast agent (19). A 3D T1W gradient echo sequence composed of eight 4 mm contiguous slices was used in the DCE-MRI examination.
The pharmacokinetic model proposed by Tofts et al. was used (20). These models are based on determining the rate of contrast exchange between plasma and extracellular space using transfer rate constants, such as Ktrans and kep. These constants are elevated in many cancers (21, 22). Commercial software packages were used to input DCE-MRI data and produce parametric maps, such as Ktrans and kep maps that can be used for diagnostic purposes. Square ROIs of 6 × 6 pixels were drawn and retraced on each of the contrast uptake parametric maps (kep and Ktrans). The ROIs outlined in prostate regions were matched with whole mount section pathology.
3.5. Statistical Analysis
Data were analyzed using SPSS software package version 20 (SPSS Inc., Chicago, Ill, USA). Quantitative data were expressed using range, mean, standard deviation and median while qualitative data were expressed in percent.
Pearson correlation coefficient and its non-parametric corresponding Spearman correlation were used to analyze the association between any two variables. Given the number of data, the results of Pearson correlation analysis was confirmed by Spearman analysis.
Agreement of different predictive with outcome was used and expressed in sensitivity, specificity, positive predictive value and negative predictive value. P value less than 0.05 was considered as statistically significant.
4. Results
Patient characteristics and statistical parameter are summarized in Table 3. A total of 87 tumor ROIs were identified and contoured on WM slides. Of these, 44 had a GS between 7 and 9, 35 had a GS 6 and in eight lesions, GS was not reported due to prior neoadjuvant chemotherapy.
| Parameters | Mean ± SD | Minimum | Maximum |
|---|---|---|---|
| Age, y | 59 ± 7 | 52 | 66 |
| PSA, ng/mL | 7.81 ± 5.73 | 6 | 9 |
| ADC, 10-3 mm2/s | 1.11 ± 0.27 | 0.56 | 1.74 |
| Ktrans, min-1 | 0.98 ± 0.019 | 0.056 | 0.162 |
| Kep, min-1 | 0.52 ± 0.11 | 0.18 | 0.86 |
Patient Characteristics and Statistical Parameters
4.1. Correlation of ADC Values With Gleason Scores
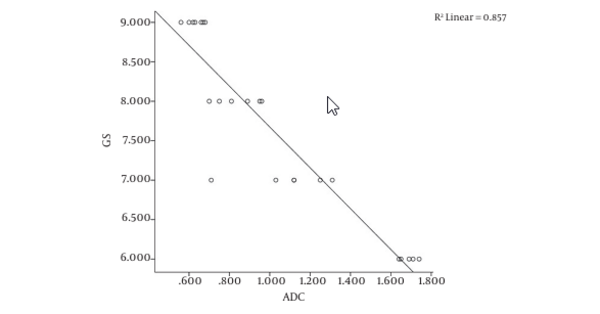
The Pearson correlation analysis revealed a strong significant negative correlation between Gleason scores and ADC measurements (r = -0.926, P = 0.01) (Figure 2).
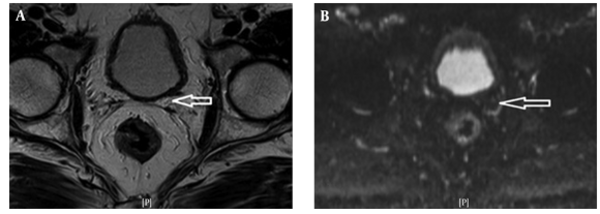
Figure 3A shows the T2W MRI of a 65-year-old prostate cancer patient with a GS of 7 and Figure 3B is the corresponding ADC map. In six patients with Gleason scores of 6, the mean ADC value was 0.982 ± 0.909 SD mm2/s using 32 ROIs. In nine patients with Gleason scores of 7, the mean ADC value was 0.961 ± 0.806 SD mm2/s using 52 ROIs. In six patients with Gleason scores of 8, the mean ADC value was 0.924 ± 0.786 SD mm2/s using 24 ROIs. In four patients with Gleason scores of 9, the mean ADC value was 0.812 ± 0.726 SD mm2/s using 24 ROIs.
4.2. Correlation of MRS Parameter Values with Gleason Scores
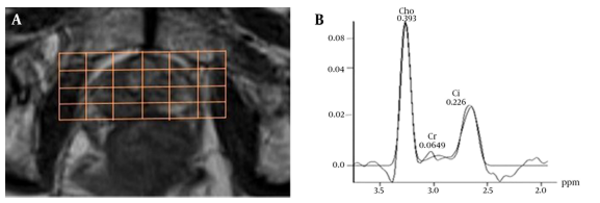
For evaluation of MRS, baseline correction and phase correction was performed in some cases (Figure 4).
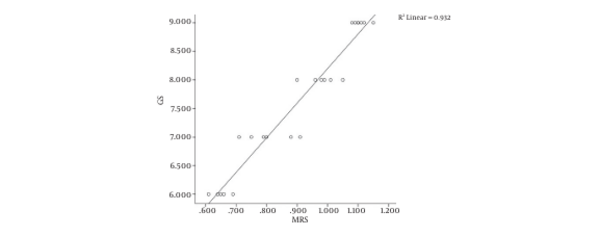
Of the total of 1125 voxels evaluated, 146 voxels were unusable due to artifact arising from lipid contamination in the excitation volume and 315 were not diagnostic (i.e., had signal to noise ratios for Cho and Cit peaks of > 5.0). In the remaining 1251 usable voxels, the phase and chemical shift (in parts per million) of the metabolites were checked and the (Cho + Cr)/Cit was recorded. The results showed that there is a significant difference between (Choline + creatine)/citrate of prostate cancer and normal tissue (Table 4). The Pearson correlation analysis revealed a strong positive correlation between Gleason scores and MRS measurements (r = 0.965, P = 0.01) (Figure 5).
4.3. Correlation of DCE Parameters Values with Gleason scores
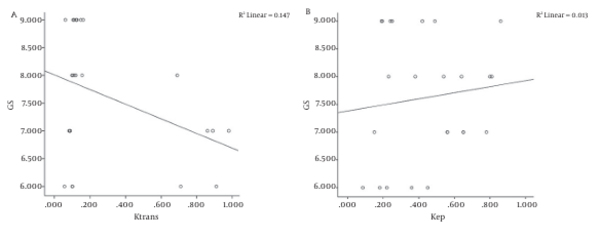
Pearson’s correlation coefficients were used to correlate DCE MRI parameters and histopathological findings. No significant correlation was observed between GS and DCE -MRI parameters (Figure 6).
A-Correlation between gleason score (GS) and Ktrans; Pearson correlation coefficient: r=-0.383, P=0.01, Spearman’s rho coefficient: r=-0.007, P=0.001 and linear regression analysis: R2=0.147. B-Correlation between GS and Kep; Pearson correlation coefficient: r=0.115, P=0.01, Spearman’s rho coefficient: r=0.130, P=0.001 and linear regression analysis: R2=0.013.
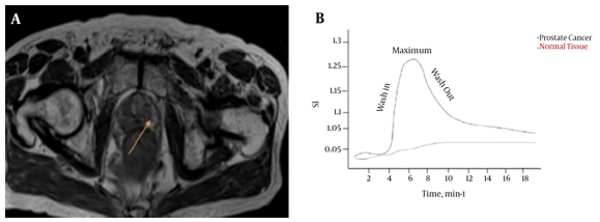
The analysis of 6 × 6 pixel ROIs in the kep and Ktrans maps revealed significant differences between cancer and normal tissue (Table 4). Kep and Ktrans were significantly higher in prostate cancer than in normal tissue (P < 0.05) (Figure 7).
5. Discussion
In this study, we evaluated the effectiveness of three image features in the differentiation of prostate cancer from normal tissue, and their correlation with lesion specific Gleason scores of images acquired from MP-MRI. Prostate cancer is often multifocal. It is generally accepted that the GS determines the prognosis, the lesion with the highest score has the poorest prognosis (23). Correlation of imaging with histopathology is critical for validation and for establishing the utility of novel imaging biomarkers (24). In particular, accurate correlation enables analyses of the relationships between various MRI-based quantitative parameters and histopathology, and allows for evaluation of the accuracy of imaging in the assessment of the tumor.
Anatomical and functional imaging of the prostate gland, and diagnosis of prostate cancer using MP-MRI is now becoming available in Iran. According to 2013 European association of urology guidelines (25), the main tools to diagnose prostate cancer include DRE, PSA, and TRUS-guided biopsy.
Several studies revealed a correlation between ADC value and Gleason score. Tamada et al. reported a correlation coefficient, r, between ADC and GS of -0.497 in peripheral zone (PZ) cancer and of -0.343 in transition zone (TZ) cancer (26).
More recently, Tamada et al. found statistically significant differences between the ADC values of PZ tumors with Gleason scores of 6 and 7 and those with Gleason scores of 6 and 8 (26). In another study that was performed on 44 patients with prostate cancer, significant differences in tumor ADC values were reported among patients with low-risk disease and those with higher-risk disease (27).
The major limitations of previous studies were the unreliable GS obtained from needle biopsies and difficulties in accurate localization of the biopsied tumor on MRI. Needle biopsy leads to underestimation of GS in approximately 25% of the cases compared with GS established from prostatectomy specimen because of biopsy sampling error and tumor heterogeneity (28, 29). To overcome this limitation, we used prostatectomy specimens for image and GS correlation. Our results showed that there is a significant negative correlation between ADC values calculated from DW images and GS of prostate cancer obtained from prostatectomy specimen. Oto et al. reported a moderate negative correlation (r = -0.376, P = 0.001) using this trend between ADC values and GS (30).
DCE-MRI is an imaging modality that is designed to evaluate the status of tumor angiogenesis. It has been suggested that in prostate cancer, a poorer prognosis is associated with a greater number of abnormal vessels (31) and microvessel density has been shown to correlate with higher GS and predict disease progression (32-34).
This has prompted interest in quantitative DCE-MRI as a non-invasive tool in assessing the aggressiveness of prostate cancer. Accurate pharmacokinetic modeling of DCE-MRI requires knowledge of pre-contrast tissue T1 values (35), and knowledge of the concentration time course of the contrast agent in the feeding vasculature. The pharmacokinetic model is applied to the time-dependent concentration changes of the contrast agent in the artery supplying the tissue of interest (36).
Increased vascularity, capillary permeability, and interstitial hypertension in tumors are considered to underlie better tumor visualization (37).
However, a recent report suggests that prostate cancer is not associated with increased vascularity (38). Ktrans was not highly effective in the differentiation of tumor from normal tissue in our study. This observation agrees with the literature (39, 40). However, we found a moderate correlation between Ktrans and GS, and Ktrans was moderately effective in the differentiation of low and high-grade tumors. These findings are inconsistent with previous findings that showed no correlation between quantitative DCE MR parameters and GS (30, 41).
However, DCEI may be confused with tissue inflammation because both are associated with increased vascularity. Peristalsis of the rectum during imaging may cause misregistration in imaging series, thereby disturbing analysis of the time-intensity curve.
One of the most interesting characteristics of prostate cancer is its variable biologic aggressiveness. MRS uses metabolic information and makes biochemical quantitation at specific regions of the prostate possible in a non-invasive manner (42). The ratio of the sum of the citrate and choline peaks to the citrate peak can differentiate prostate cancer from normal parenchyma (43). MRI is the most accurate imaging investigation for evaluating soft tissue tumors (44). Preliminary studies have shown that 1H-MRS using 1.5 or 3 T MR equipment is capable of discriminating between malignant and benign soft tissue tumors (45, 46). According to a study conducted by Zakian et al. (45), which measured the MR spectroscopic imaging, and the ratio of prostate tumor for (Cho + Cr)/Cit ratio, a positive correlation was found with the pathologic Gleason score. This data indicated that in the diagnosis, cancer with a GS of 6, the MR spectroscopic imaging tumor detection sensitivity was 44.4%, and the sensitivity increased to 89.5% in cancers with a GS of more than 8. Thus, a large proportion of tumors with a GS of 6 and under 6 did not generate abnormal voxel metabolite ratios (47).
In our study, Spearman’s coefficient of rank correlation was 0.724 with P < 0.001, indicating a strong positive correlation between MRS results and histology (i.e. malignant or benign lesions).
Although DCE MRI and MRS alone had lower sensitivity than T2W MRI, they both had higher specificity than T2W MRI, and their addition to the MRI protocol increased the accuracy and predictive value of conventional T2W MRI for accurately localizing peripheral zone cancers. The incorporation of functional techniques, such as DCE MRI, MRS, and DWI, is a relatively new approach for tumor detection and local staging (40).
MP-MRI, which is composed of T2W and several functional sequences, is regarded as the single most accurate imaging modality for characterizing prostate cancer. Recently, the role of an MP-MRI has been expanded to a prostate biopsy, active surveillance, advanced disease detection, and local recurrence detection after radical prostatectomy. For instance, MP-MRI was demonstrated to be an accurate method for localizing prostate compared to carefully perform WM step section histopathology, especially for lesions larger than 0.5 cm3 (1).
In this article we examined whether a detailed whole mount pathology correlation of the prostatectomy specimen is necessary for direct correlation with MP-MRI, or correlation with a standard pathology report is sufficient.
Our study has several limitations. The radiologists reviewing the MRI knew that all patients included in this study had biopsy proven cancer and this could lead to bias during interpretation of the MR images. In addition, the customized MRI based specimen is relatively expensive, so, we do not advocate it for routine clinical use. However, such a systematic method can be useful in multicenter clinical trials. Finally, we sliced the prostate in 5 mm sections, whereas the MRI was obtained in 3 mm slice thicknesses.
In conclusion, combining anatomical and functional MRI significantly improves prostate cancer localization. It is useful for diagnosis and management of prostate cancer as well as a valid tool for assessing men on active surveillance. However, it should not be seen as a replacement for tissue biopsy.

