


1. Background
Osteoporosis is a globally prevalent disorder, estimated to be currently affecting over 200 million people worldwide (1), which causes more than 9 million fractures annually (2). Despite its terrible effects on the quality of life, osteoporosis is often underdiagnosed and undermanaged (3-6), since about fewer than 20% of osteoporosis patients receive adequate diagnostic interventions (7).
Currently, the standard modality for diagnosing osteoporosis remains the central dual-energy X-ray absorptiometry (DEXA) of the lumbar spine and hips (8). However, this method is not often used because of the limitations in certain diagnostic settings in patients with prior spinal surgery, underlying spinal deformities, or those with vertebral compression fractures (8, 9).
Studies have suggested computed tomography (CT) scan as a viable alternative to DEXA in assessing bone mineral content (9, 10) by measuring spine weakness in Hounsfield units (HU) (5, 10, 11). Previously published literature have also proposed distinct values for sensitivity and specificity, based on different discriminatory attenuation cut-offs (5, 12-14). As such, using CT-scans as an opportunistic modality for osteoporosis screening results in the reduced costs, appointments and radiation burdens in patients who are already undergoing CT scan for other indications (13, 15). Urinary stone patients are prominent examples of its utilization, since CT-scans have been established as the gold-standard and first line imaging in evaluating kidney stones and are routinely conducted for all kidney stone patients (16, 17). Moreover, several studies have linked recurrent nephrolithiasis to a marked decrease in overall bone mineral density and an increase in fracture risk (18-21), thereby highlighting the importance of a reliable screening method in such populations. Given the establishment of geographical and ethnic backgrounds as factors affecting the prevalence and the incidence of osteoporosis, studies in different geographical settings prior to the design of CT imaging as an osteoporotic screening tool are appropriate (18).
2. Objectives
The main goal of this study was to evaluate opportunistic CT scan as a screening tool and determine its diagnostic accuracy in an Iranian group of patients with urinary stones, because the previous analyses indicate a high incidence of osteoporosis in the general Iranian population (22).
3. Patients and Methods
3.1. Subjects and Setting
The patient sample for this diagnostic-accuracy cross-sectional test study comprised the urinary stone patients undergoing percutaneous nephrolithotomy (PCNL) procedure for stone removal, admitted to a tertiary health center in Tehran, Iran from June 2018 until October 2019. Patients who had a predominantly calcium component in urinary stone analysis, with no prior history of surgeries for urinary stone removal were included in our study. Of the 234 patients undergoing PCNL in the aforementioned timespan, 114 met our inclusion criteria and were admitted in the study. Each patient’s medical records, including pre-operative CT-scans were extracted from the hospital’s medical record database. As a routine pre-operative protocol (23), CT was conducted for all stone-removal surgery candidates in our center. The authors then contacted the patients in a maximum timespan of one week from the time of stone removal surgery. The aims of the study were explained to all patients, and the patients were then asked to perform a DEXA scan. Of the 114 primary subjects, 92 agreed to undergo the scan, which was performed within two weeks of their enrollment. Basic patient data such as gender, age and body mass index (BMI) were also retrieved. Patients with a history of vertebral fractures, evidence of compression fractures on imaging, receiving anti-resorptive medications, insufficient DEXA coverage on performed scans, and those with present metallic implants were excluded from the analysis.
3.2. Imaging Analysis
Dual-energy x-ray absorptiometry was performed on the proximal femora and the lumbar spine, following standard procedures using DMS STRATOS densitometer (DMS Group, France). Subjects were classified as having normal bone mineral density (BMD) (T-score ≥ −1.0), osteopenia (−2.5 < T-score < −1.0), or osteoporosis (T-score ≤ −2.5), using the lowest reported T-score at any given location, according to previously established guidelines (8, 24-27). Using lowest T-score as reference point is beneficial from a prognostic point of view; since a lower BMD at one site correlates with fracture risk at other anatomical sites (28, 29).
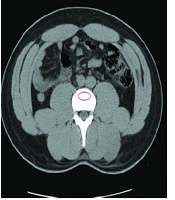
CT-scan images retrieved from the hospital’s database were analyzed retrospectively via Infinitt pacs software. The imaging was performed via a Somatom Sensation 16-slice scanner (Siemens, Germany), calibrated daily to maintain accuracy in calculating attenuation values. Following the standard process of measuring attenuation on CT-imaging, vertebral BMD was assessed on both axial and coronal cross-sections by placing an oval region of interest (ROI) over the centermost area of the trabecular bone of the vertebral body at L1 level and calculating the mean BMD value, as demonstrated on Figure 1. To ensure the proper anatomical location of the ROI, sagittal and lateral windows were also inspected, thus avoiding possible distortions in measuring the attenuations in HU. A discriminatory bone mineral attenuation cut-off value of 160 HU at the L1 vertebral level, as established and provided by previously published literature, was utilized to distinguish the low from normal BMD in the patients (mean sensitivity 73.9%, mean specificity 70.6%) (5, 13).
 estimation on axial and coronal CT-imaging.")
Oval regions selected at the L1 vertebral level of the trabecular bone for bone mineral density (BMD) estimation on axial and coronal CT-imaging.
3.3. Statistical Analysis
Using the pre-determined threshold of 160 HU for CT-attenuation (5), specificity, sensitivity, negative and positive predictive values, and the area under the curve (AUC) of the mean attenuation of the trabecular vertebral bone were calculated for DEXA-based osteoporosis. The independent-samples t-test and chi-square tests were utilized to compare patients’ BMD values retrieved from DEXA and CT imaging. Statistically, a significant statistical difference was established as a two-sided P value < 0.05. The statistical analyses were conducted by SPSS version 22 software (IBM Corp. Released 2013. IBM SPSS Statistics for Windows, Version 22.0. Armonk, NY: IBM Corp).
4. Results
The study comprised 92 urinary stone patients, 31 (34%) of whom were designated as osteoporotic, 38 (41%) as osteopenic, and 23 (25%) as normal. A similar T-score was seen in less than 1% of the cases. CT-data was retrieved for all patients, with L1 attenuation measurements attained for all 92 patients. Thirty-seven subjects were categorized as low BMD with attenuations lower than 160 HU on CT, while 55 were defined as normal BMD, with attenuations equal or greater than 160 HU.
Table 1 demonstrates the distribution of subjects divided by the previously established BMD score (5) in the osteoporotic, osteopenic and normal groups, based on the lowest reported overall T-score. The majority of subjects with low attenuation values on CT (n=29, 87.3 %) had T-scores ≤ −2.5 and were defined as osteoporotic, while conversely, none (n=0, 0 %) of the subjects with normal attenuation values were designated as osteoporotic. The statistical analysis confirmed a significant relation (P < 0.005) across this distribution. Mean HU for each group was also presented in Table 1, with attenuation differences proving statistically significant across all the diagnostic groups (P < 0.001). The L1 attenuation cut-off of 160 HU showed a sufficient diagnostic performance, demonstrating an AUC of 0.983 (95% confidence interval [CI], 0.961 – 1.000) as demonstrated in Figure 2 93.55% sensitivity (95% CI, 78.55 – 99.21) and 86.89% (95% CI, 75.78% - 94.16%) specificity in distinguishing normal BMD from osteopenia and osteoporosis, with osteoporosis defined as a true-positive result, and osteopenia and normal BMD considered as false-positive. This threshold also resulted in an accuracy of 89.13% (95% CI, 80.92% - 94.66%), a positive predictive value (PPV) of 78.38% (95% CI, 65.37% to 87.44%) and a negative predictive value (NPV) of 96.36% (95% CI, 87.36% to 99.03%). This data is presented in Table 2.
| DEXA Score | ≥ −1.0 | −2.5 < < −1.0 | ≤ −2.5 | P Value |
|---|---|---|---|---|
| N = 92 | 23 (25%) | 38 (41%) | 31 (34%) | |
| BMD | ||||
| <160 HU | 0 (0%) | 8 (21.6%) | 29 (78.4%) | < 0.05 |
| >160 HU | 23 (41.9%) | 30 (54.5%) | 2 (3.6%) | |
| Mean BMD (SD) | 240.13 (34.77) | 181.97 (30.74) | 132.35 (20.46) | < 0.05 |
| Gender (M / F) | (18 / 5) | (26 / 12) | (13 / 18) | 0.12 |
| Mean age (SD) | 38.39 (13.15) | 48.29 (14.11) | 57.16 (8.76) | < 0.05 |
| Mean BMI (SD) | 30.23 (4.01) | 26.75 (4.53) | 23.09 (4.34) | < 0.05 |
| Mean stone size (SD) | 23.17 (8.871) | 27.58 (10.47) | 37.65 (16.59) | < 0.05 |
Distribution of Basic Subjects’ Characteristics and Relation Between the Lowest DEXA Score and BMD Based on CT-Imaging Across Clinical T-Score Subgroups
| Variable | <160 HU | ≥ 160 HU |
|---|---|---|
| T-score ≤ −2.5 | 29, True Positive | 2, False Negative |
| T-score > −2.5 | 8, False Positive | 53, True Negative |
Sensitivity, Specificity, Positive Predictive Value (PPV) and Negative Predictive Value (NPV) Characteristics for Diagnosing Osteoporotic Subjects Based on the Designated 160 HU Thresholda
 for the discriminatory cut-off of 160 HU in diagnosing osteoporosis.")
Area under the curve (AUC) for the discriminatory cut-off of 160 HU in diagnosing osteoporosis.
Table 3 shows gender, mean BMD, mean BMI, mean age, and mean urinary stone size for patients in osteoporotic, osteopenic and normal groups based on T-scores of femoral and vertebral DEXA. Mean BMD attenuation differences between the groups across all levels were statistically significant (P < 0.001). Similar statistically notable associations were seen between mean BMI, age and stone size differences across all domains (P < 0.05). However, no statistically relevant association was noted between the patients’ gender and BMD scores on DEXA (P > 0.05).
| Variable | Femoral DEXA | Vertebral DEXA | ||||
|---|---|---|---|---|---|---|
| ≥ −1.0 | −2.5 < < −1.0 | ≤ −2.5 | ≥ −1.0 | −2.5 < < −1.0 | ≤ −2.5 | |
| Mean BMD (SD) | 217.89 (44.75) | 162.9 (31.74) | 119.64 (24.81) | 229.42 (39.08) | 175.47 (28.63) | 131.52 (20.76) |
| Mean BMI (SD) | 28.74 (4.75) | 25.75 (4.47) | 20.37 (2.41) | 29.68 (4.78) | 25.99 (3.80) | 23.07 (4.47) |
| Mean age (SD) | 41.68 (12.99) | 48.07 (14.91) | 58.64 (11.24) | 41.48 (14.32) | 47.97 (14.35) | 57.55 (7.76) |
| Gender (M / F) | (26 / 11) | (24 / 10) | (9 / 12) | (23 / 8) | (23 / 9) | (11 / 18) |
| Mean stone size (SD) | 25.43 (11.41) | 32.34 (13.02) | 44.18 (17.89) | 24.06 (8.61) | 29.09 (11.91) | 36.94 (16.9) |
Correlation Between Basic Patient Data Distributed by DEXA Scores
Distinguishing osteopenia from normal population was attained through designating the discriminatory thresholds of 180 and 190 HU. The total of 61 patients with a T-score greater than -2.5 showed a mean BMD of 169.07 HU based on the 180 HU threshold and a mean BMD of 173.22 HU based on the 190 HU threshold. As determined by previously published data, a higher sensitivity was recorded for the 190 HU threshold compared to the 180 HU (95% CI, 81.58% vs 76.32%), while the 180 threshold showed greater specificity compared to the 190 HU (86.96% vs 82.61%, 95% CI) (13). This data and the rest of the characteristics are presented in Table 4 and Table 5.
| Variable | <190 HU | ≥ 190 HU |
|---|---|---|
| −2.5 < T-score < −1.0 | 31, True Positive | 7, False Negative |
| T-score ≥ −1.0 | 4, False Positive | 19, True Negative |
Sensitivity, Specificity, Positive Predictive Value (PPV) and Negative Predictive Value (NPV) Characteristics for Distinguishing Between Normal and Osteopenic Subjects Based on the Designated 190 HU Thresholda
| Variable | <180 HU | ≥ 180 HU |
|---|---|---|
| −2.5 < T-score < −1.0 | 29, True Positive | 9, False Negative |
| T-score ≥ −1.0 | 3, False Positive | 20, True Negative |
Sensitivity, Specificity, Positive Predictive Value (PPV) and Negative Predictive Value (NPV) Characteristics for Distinguishing Between Normal and Osteopenic Subjects Based on the Designated 180 HU Thresholda
5. Discussion
In this study, the diagnostic value of L1 trabecular vertebral attenuation on routine CT, and its relation with bone mineral density scores on the gold standard DEXA (28, 30) measurement was established in a high-risk population. This study proposes the non-contrast CT imaging as a valid diagnostic measure of osteoporosis with satisfactory accuracy in urinary stone patients. An L1 attenuation threshold of 160 HU, previously described by Pickhardt et al., demonstrated 93.5% sensitivity in the current setting, compared with the original 90% (5). Such high sensitivity may prove to be extra beneficial in high-risk populations, wherein the diagnostic goal is omitting false-negative results. However, for low-risk population where the aim is to reduce the false-positive outcomes, a lower attenuation threshold would provide higher specificity. The North American study suggests a 110 HU cut-off to be as specific as 90% in general population, while our 160 HU threshold was 86.89% specific, reflecting the lower specificity in higher attenuation cut-offs may be negated in the higher-risk samples. Diagnostic value of CT-imaging in distinguishing osteopenic patients from the normal population was also evaluated in our analysis, with the diagnostic cut-offs of 180 HU and 190 HU both providing favorable sensitivity in diagnosing osteopenia from normal BMD; with the 190 HU cut-off providing a higher sensitivity compared to the 180 HU. A higher specificity was expectantly noted in the 180 HU threshold compared to the 190 HU, as lower attenuation cut-offs provided greater specificity albeit with lower sensitivity in previous literature (13).
Other published literature has also assessed the routine CT imaging as opportunistic screening measure for osteoporosis (5, 12-14, 31), with comparable results to the current study. A 100% diagnostic sensitivity for osteoporosis was attained by Kara et al. (14), using 130 HU and 135 HU thresholds in women and men, respectively. Similarly, Alacreu et al. used the 160 HU threshold in a Southern European general population, resulting in a high sensitivity of 91%, albeit the specificity attained with this cut-off was 27%, compared to the 90% specific 73 HU threshold (13).
Such discrepancies can be attributed to several factors. Patient demographics (gender, age, ethnicity), other independent osteoporosis risk factors, bone diseases, and difference in the equipment and the techniques may all affect the results (32). Previous studies were generally conducted in low-risk or general populations, with no known predisposing factors influencing bone mineral content, and with merely gender and age affecting the outcomes (33). In the current analysis, the association between both gender and age, and T-scores on DEXA were evaluated. As established by previous literature, age was shown to inversely relate with BMD (P < 0.001) (34). There was no notable relation between patients’ gender and BMD (P > 0.05). By contrast, the present study was conducted on a study group of urinary stone patients, who were designated high-risk for both higher incidence of skeletal fractures and a lower bone mineral content compared to the general population (19, 21, 35-37). This may explain the higher specificity and sensitivity observed in the present study, compared with the other literature utilizing the 160 HU attenuation threshold. Moreover, studies have established osteoporosis as highly prevalent amongst the general population of Iran over the age of 30 (22). Henceforth, as previously mentioned, higher attenuation thresholds with focus on sensitivity rather than specificity would be more beneficial in distinguishing between osteoporotic and normal population.
Regarding the basic patient data presented in Table 2, we performed an analysis between the mean BMI, age, stone size and patients’ gender and the T-score groups to further assess any contributing factors that may influence the outcome of our study. As mentioned before, no meaningful statistical correlation was observed between gender and T-scores. However, other factors were all confirmed to be statistically significant when compared with BMD values from DEXA scans. As mentioned earlier, a significant inverse statistical relation between mean age and T-scores on both vertebral and femoral DEXA was noted (P < 0.001). Such inverse association was also significantly observed between stone size and BMD; patients with larger urinary stones had lower BMD scores on DEXA. While still requiring further analysis, this finding was also reported in a literature published by Patel et al. (38). Conversely, higher BMI values were shown to associate with higher BMD (P < 0.001). This finding was concurrent with the previously published literature, such as the Framingham study (34, 39).
Given that the vertebral bone attenuation was obtained, while L4 and L5 was proposed by Kara et al. as vertebral levels benefitting from the highest accuracy (14), any vertebral level from L1-L4, and even T12 (31) could be utilized as the ROI with no notable difference in outcome. Pickhardt et al. suggested L1 attenuation as a suitable screening method, due to its ease of access and presence on the majority of the standard abdominal and chest CT-scans (5).
Our study establishes a non-contrast CT-imaging as a reliable and highly sensitive method in the assessment of bone mineral content, especially in high-risk populations and patients who are prone to fractures (13). Using CT-scan as a diagnostic measure for BMD assessment will also reduce the radiation burden received by patients through DEXA scans. The method through which bone attenuation on CT is measured is simple, and can easily be performed by any radiologist or even non-radiologist.
Regardless, the limitations of the current study should be addressed. First, the hospital’s radiology department did not provide us with fracture data on DEXA scan reports, or CT imaging. Second was the limited scope of our analysis. Henceforth, it is important to conduct further research on different demographics through distinct equipment so that more comprehensive data could be provided for the healthcare practitioners and clinicians.
In conclusion, this study established non-contrast abdominal CT-scan obtained routinely in urinary stone patients to be a highly sensitive and a valid diagnostic tool in identifying osteoporotic patients from those with normal bone mineral content, while reducing the cost and exposure burden of patients.
