1. Background
Sonoelastography is extensively used for clinical diagnosis. Different types of elastography can be used to assess the elastic properties (stiffness) of tissues. For quantitative analyses, shear wave elastography (SWE) has been applied as a non-invasive method in the past decade (1). By using the cross-correlation method to measure longitudinal displacement, the elastic modulus (Young’s modulus) can be calculated (2).
Today, SWE is widely applied for diagnosing thyroid (3), breast (4), liver (5), prostate gland (6), and lymph node (7) lesions. Several studies have concentrated on the biological and functional properties of muscles and tendons (8-11). However, a limited number of studies have been conducted on musculoskeletal injuries and neoplastic diseases (12, 13), and functional recovery following injury to muscles and tendons has been highly neglected. In the present study, changes in the average elastic modulus value (Emean) of ruptured Achilles tendons were quantitatively analyzed and compared before and after tendon repair.
2. Objectives
This study aimed to investigate the postoperative functional recovery of repaired tissues in patients with ruptured Achilles tendons using SWE to determine the Achilles tendon function and provide reliable evidence for clinicians.
3. Patients and Methods
3.1. Patients
This study was performed on 67 patients with ruptured Achilles tendons, who were admitted to our hospital from March 2016 to November 2018 for tendon repair and underwent ultrasound preoperatively. The patients returned to our hospital at one, three, and six months after surgery and underwent an ultrasound examination. Seventeen patients were excluded because of missing the postoperative follow-ups.
Among the remaining 50 patients, there were 50 cases of ruptured Achilles tendons (35 fully ruptured and 15 partially ruptured; 38 right-sided and 12 left-sided), all in male subjects. The participants had no systemic diseases, such as diabetes, rheumatism or rheumatoid disease, thyroid disorders, or collagen vascular disease. Before examination, oral and written informed consent was obtained from all patients or their families. This study was approved by the Medical Research Ethics Committee of the First Affiliated Hospital of China Medical University.
3.2. Instruments and Examination Protocol
All ultrasound examinations were conducted by an Aixplorer ultrasound unit (SuperSonic Imagine, Aix-en-Provence, France). For this purpose, a 50-mm linear-array transducer (frequency: 4 - 15 MHz) was used. The range of elasticity was 0 - 600 kPa. The relaxed state for the ankle joint was considered as the standard examination position. The feet were hanging over the edge of the bed, and the Q-Box diameter was kept at 3 mm. The location of an unruptured Achilles tendon was 4 cm from the end of the tendon. Before surgery, in case of a low-grade tendon tear, the sample volume was placed at the ruptured area, while in case of a complete or high-grade tendon tear, the sample volume was placed at disordered sides (on both sides).
After surgery, the location of the ruptured Achilles tendon was selected at the middle of both sides. Each Achilles tendon was selected by testing multiple locations; the same area was measured ten times. The ruptured Achilles tendon was inspected at one, three, and six months after surgery, respectively. In the transverse (axial) section, the probe was perpendicular to the long axis of the Achilles tendon. Meanwhile, width (mm) and thickness (mm) were measured before surgery, except for the ruptured Achilles tendons. In the longitudinal (sagittal) section, the Emean was automatically calculated and displayed on the screen. However, the width and thickness of the ruptured Achilles tendon before surgery were not measured, because the tendon was injured and curled at the rupture site, and there was no clear measurement standard, causing a large measurement error.
3.3. The American Orthopedic Foot and Ankle Society (AOFAS) Ankle-Hindfoot Score (AHS)
The AOFAS-AHS is generally applied to estimate and depict the outcomes of surgery for ankle and hindfoot pathologies. All patients were given functional scores before surgery. Also, the scores were measured by professional orthopedic foot and ankle surgeons at one, three, and six months after surgery. The scores of this scale range from 0 to 100 (90 - 100: excellent; 75 - 89: good; 51 - 74: acceptable; and ≤ 50: poor).
3.4. Statistical Analysis
GraphPad Prism 5.0 (GPW5-067245-RDG-9114, GraphPad Software, USA) was used for statistical analysis. All values were expressed as mean ± standard deviation (SD). The Emean, width, and thickness of normal and ruptured Achilles tendons before surgery and one, three, and six months after surgery were compared by repeated measures ANOVA. Moreover, the AOFAS-AHS scores of ruptured Achilles tendons before surgery and one, three, and six months after surgery were compared by repeated measures ANOVA. Finally, Tukey's multiple comparison test was applied to compare the Emean values and AOFAS-AHS between the groups. P-value less than 0.01 was considered statistically significant.
4. Results
4.1. Patients’ Demographic Characteristics
The patients were in the age range of 20 - 43 years (median: 31 years). The range of patients’ body mass index (BMI) was 20.15 - 27.68 kg/m2, and the mean BMI was 23.34 ± 1.05 kg/m2.
4.2. Achilles Tendon Width and Thickness
The width and thickness of normal and ruptured Achilles tendons at one, three, and six months after surgery are presented in Table 1. Regarding the Achilles tendon width and thickness, there were significant differences between normal and ruptured Achilles tendons at one, three, and six months postoperatively (F = 64.36, P < 0.01 and F = 187.1, P < 0.01, respectively). According to the experimental data, the width and thickness of Achilles tendons gradually decreased with tendon recovery after surgery; however, their width and thickness were larger than normal Achilles tendons.
| Variables | Width (mm) | Thickness (mm) |
|---|---|---|
| Normal Achilles tendons | 11.24 ± 1.193 (9.650 - 13.08) | 4.333 ± 0.602 (3.590 - 5.430) |
| Ruptured Achilles tendons | - | - |
| One month after surgery | 19.52 ± 3.658 (13.36 - 25.58) | 11.37±1.606 (8.840-14.28) |
| Three months after surgery | 15.53 ± 2.254 (12.22 - 19.44) | 9.186 ± 1.816 (6.440 - 13.19) |
| Six months after surgery | 13.09 ± 1.372 (11.77 - 16.60) | 6.144 ± 0.692 (5.010 - 8.030) |
| Fc | 64.36 | 187.1 |
| P-value | < 0.01 | < 0.01 |
4.3. Emean of the Achilles Tendon
The range and mean of elasticity (Emean) in normal and ruptured Achilles tendons at one, three, and six months after surgery are presented in Table 2. The difference between the groups in terms of Emean was statistically significant (F = 418.5, P < 0.01). The Emean of normal Achilles tendons was significantly higher than that of ruptured Achilles tendons before surgery (q = 51.48, P < 0.01). The Emean values of ruptured Achilles tendons at different time points after surgery were compared with those of normal Achilles tendons. The differences were statistically significant between the Emean-B (one month after surgery) and Emean-E (for a normal Achilles tendon) (q = 45.24, P < 0.01); between Emean-C (three months after surgery) and Emean-E (q = 35.43, P < 0.01); and between Emean-D (six months after surgery) and Emean-E (q = 22.59, P < 0.01).
| Variables | Emean (kPa) |
|---|---|
| Normal Achilles tendons | 447.4 ± 59.57 (349.9 - 521.2) |
| Ruptured Achilles tendons | 63.84 ± 45.18 (5.590 - 176.2) |
| One month after surgery | 110.3 ± 35.60 (58.80 - 179.7) |
| Three months after surgery | 183.4 ± 46.08 (103.9 - 258.7) |
| Six months after surgery | 279.1 ± 48.18 (193.3 - 350.0) |
| Fb | 418.5 |
| P | < 0.01 |
The Emean values of ruptured Achilles tendons at different time points after surgery were compared with those of ruptured Achilles tendons before surgery. There was no significant difference between the Emean-B and Emean-A for the ruptured Achilles tendons before surgery (q = 6.239, P > 0.01), while there were significant differences between the Emean-C and Emean-A (q = 16.05, P < 0.01) and between the Emean-D and Emean-A (q = 28.89, P < 0.01). Also, the Emean values of ruptured Achilles tendons at different time points after surgery were compared. Differences were statistically significant between the Emean-B and Emean-C (q = 9.813, P < 0.01), between the Emean-B and Emean-D (q = 22.65, P < 0.01), and between the Emean-C and Emean-D (q = 12.84, P < 0.01). As the patients recovered after surgery, the Achilles tendon elasticity increased.
4.4. AOFAS-AHS
The range and mean of AOFAS-AHS for the ruptured Achilles tendons before surgery and at one, three, and six months after surgery were 31.88 ± 7.997 (range: 18 - 55), 64.88 ± 4.094 (range: 55 - 72), 78.60 ± 4.815 (range: 68 - 86), and 91.24 ± 4.054 (range: 83 - 99), respectively. The difference in the AOFAS-AHS was significant between the four time points (F = 1107, P < 0.01). The AOFAS-AHS increased gradually from the preoperative stage until six months after surgery, similar to the trend of increase in the Emean of the Achilles tendon. At six months after surgery, the AOFAS-AHS reached an excellent level.
4.5. Ultrasonography of the Achilles Tendon
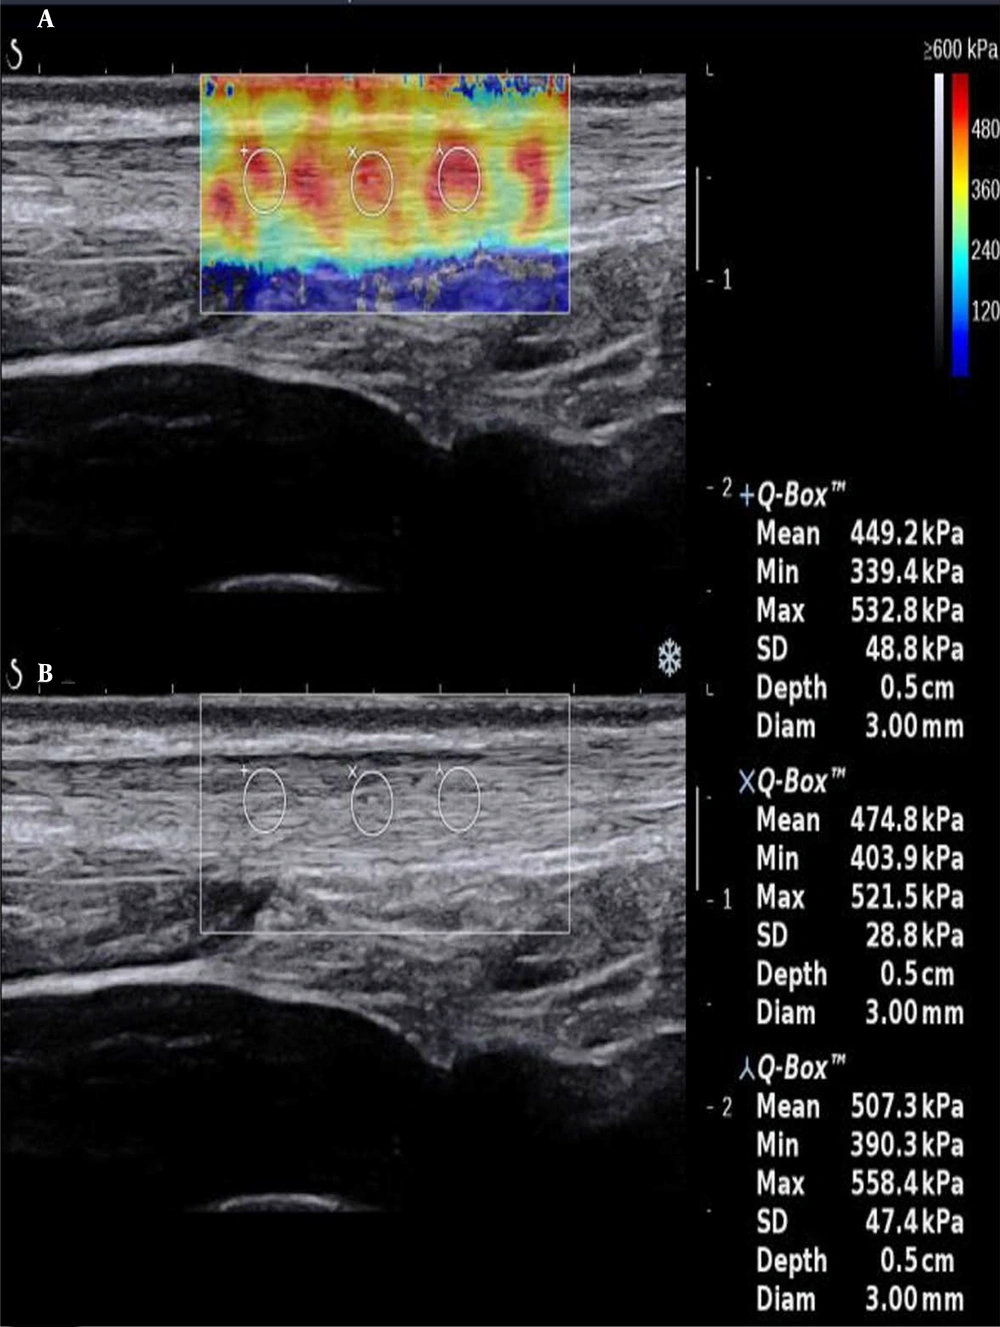
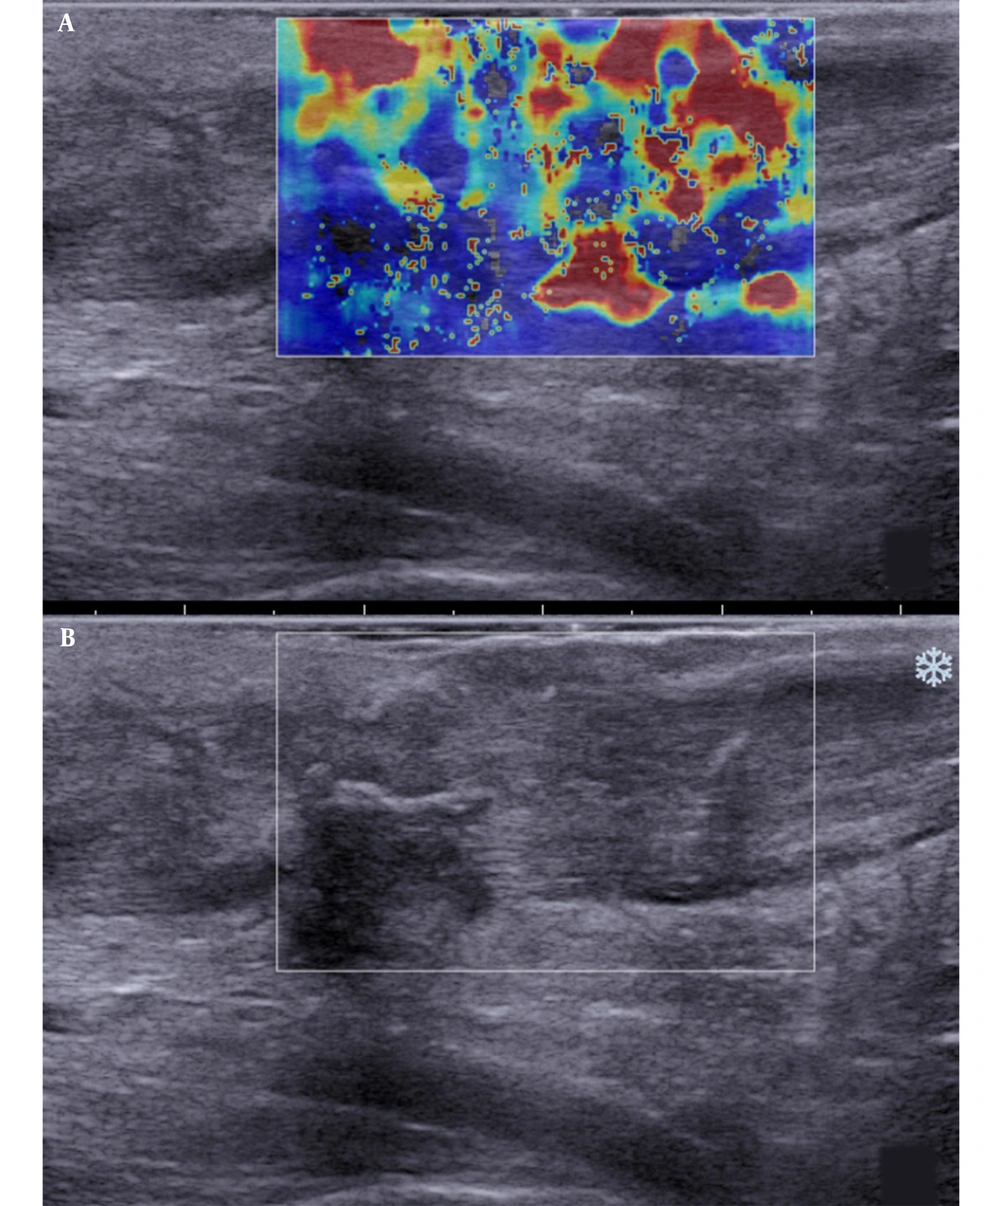
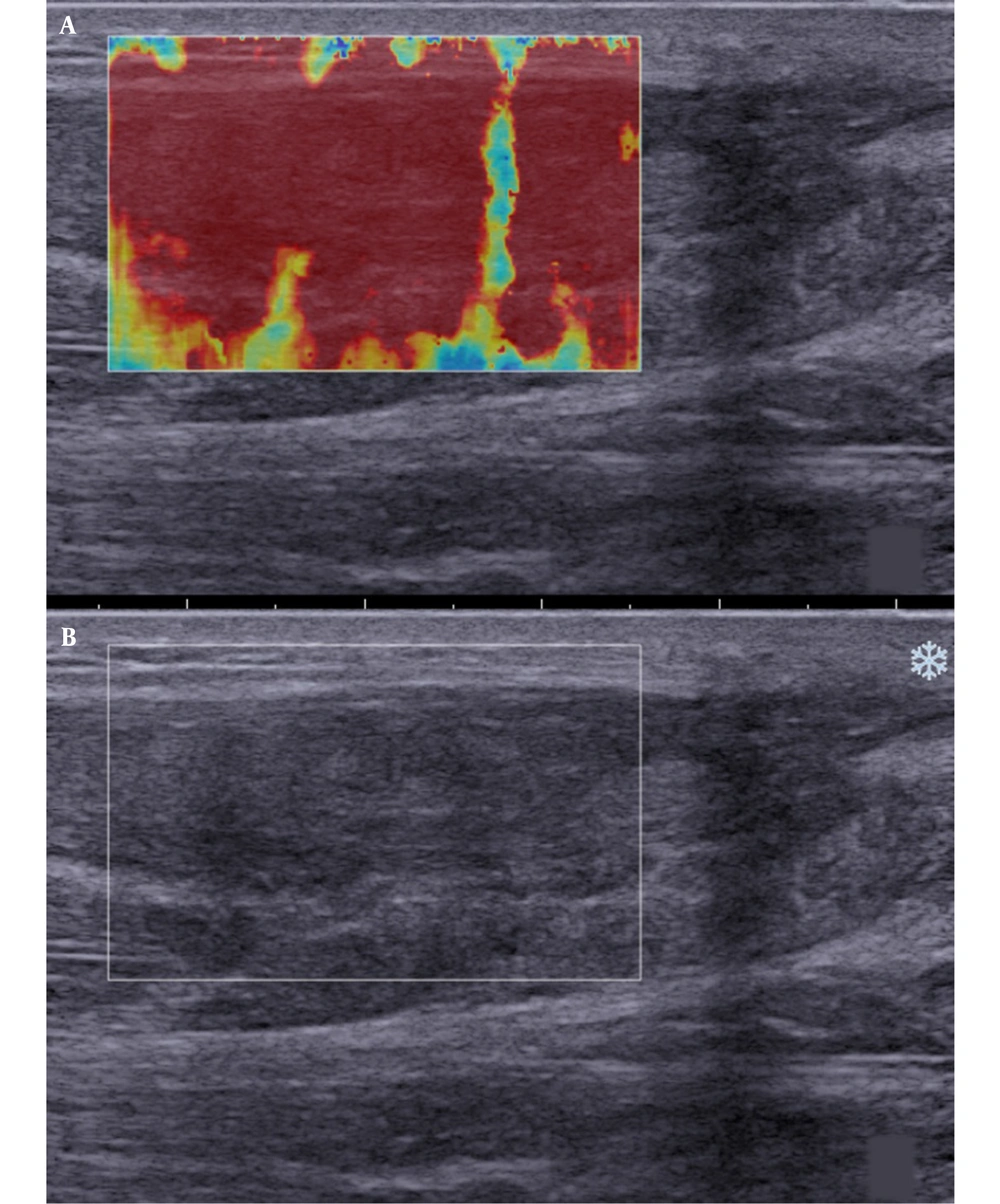
In sonography, a normal Achilles tendon appears homogeneously yellow or red or is characterized by evenly distributed red and yellow colors (Figure 1). The difference was relatively significant between the ruptured and normal Achilles tendons on sonography. The ultrasound indicated heterogeneous blue or blue-and-yellow areas; some local areas had no colors (no filling), while a number of images indicated partially ruptured tendons, mixed with small red areas. The sonographic evaluation of ruptured Achilles tendons at one month after surgery showed a similar pattern.
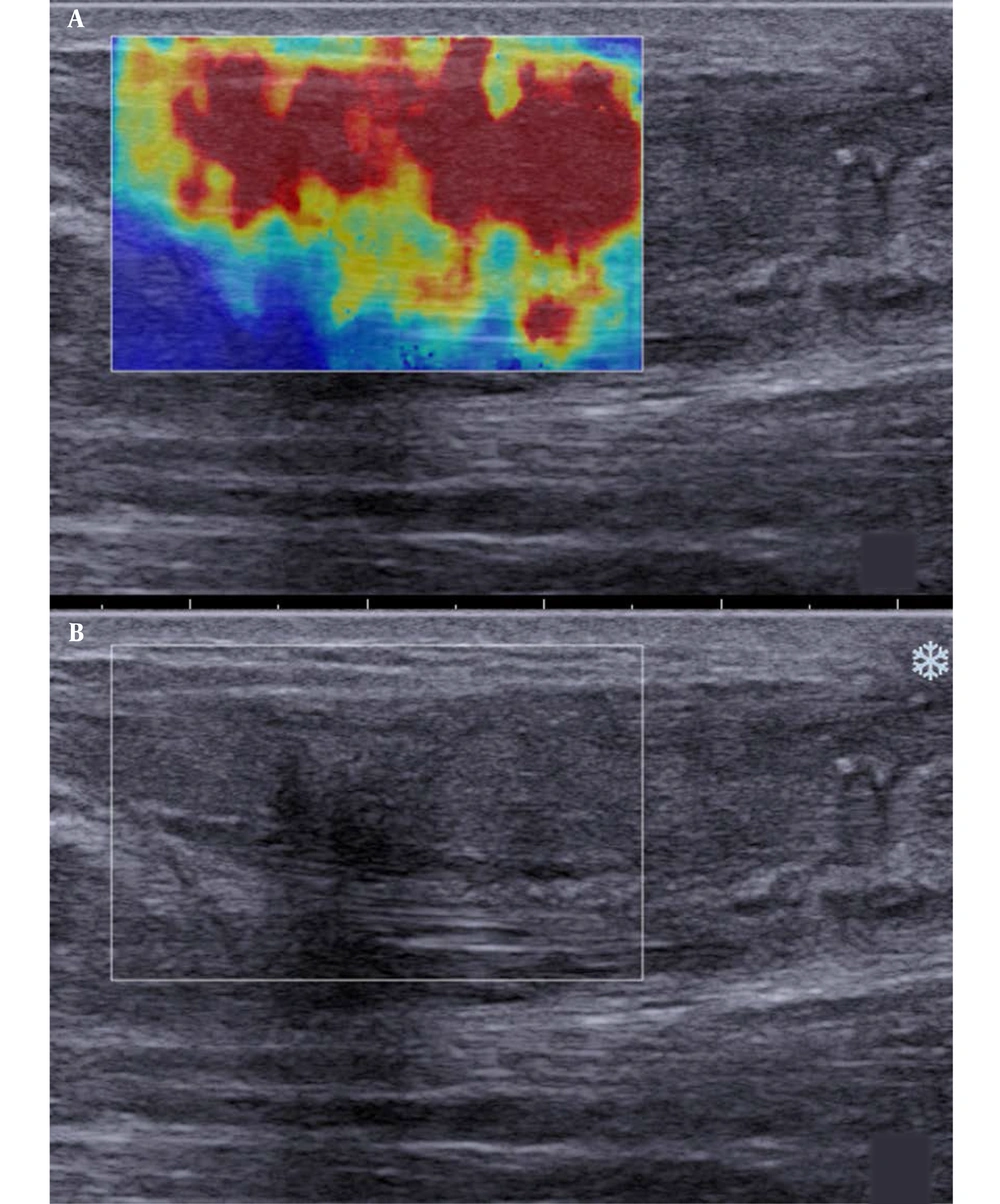
Besides, SWE indicated red, yellow, and blue areas. The blue color covered large sheets, while red and yellow colors covered small pieces (Figure 2). The sonographic assessment of ruptured Achilles tendons at three months after surgery indicated large red sheets and small blue and yellow areas (Figure 3). The sonographic assessment of ruptured Achilles tendons at six months after surgery was similar to unruptured Achilles tendons, while the former showed poor homogeneity (Figure 4).
5. Discussion
Today, ultrasound and magnetic resonance imaging (MRI) are frequently used for Achilles tendon imaging (14). These methods have higher resolutions for soft tissues. Ultrasonography is a safe, rapid, and accurate imaging modality, which is inexpensive and portable, as well. This modality has undergone remarkable changes since its development several decades ago. The original bulky B-mode systems have advanced to real-time imaging systems with high resolution (15). Conventional methods of 2D imaging and color Doppler ultrasound have been used to evaluate and discriminate standard data. SWE is beneficial for evaluating the tendon hardness in detecting tendinopathies (16).
Regarding the application of SWE, Arda et al. quantitatively assessed the elasticity of normal soft tissues using SWE. They indicated that the Young's modulus is higher in an Achilles tendon at rest (74 ± 46 kPa in the longitudinal plane) as compared to the gastrocnemius muscle (11 ± 4 kPa in the longitudinal plane) (17). Besides, Koo et al. conducted an ex vivo study to assess the relationship between the shear modulus and passive muscle force. They found that supersonic SWE could be used as an indirect tool for evaluating passive muscle stiffness (18).
According to our statistical analyses, fluctuations in the range of elasticity in a normal Achilles tendon are relatively significant in different individuals (Figure 5), depending on individuals differences, such as height, weight, and labor intensity. Therefore, in clinical practice, attention must be paid to the comparative analysis of the Achilles tendon on both sides in a single individual. When an Achilles tendon rupture occurs, its elasticity may be significantly reduced as compared to the contralateral side. The location of fracture can be observed on a 2D image, leading to a definite diagnosis of a ruptured Achilles tendon.
Additionally, SWE can be used to quantitatively analyze the hardness of the Achilles tendon. To the best of our knowledge, changes in the mechanical properties may be caused by tendon injuries; however, assessment of these properties is difficult. Besides, SWE can reflect changes in these properties quantitatively. In this regard, Aubry et al. (19) confirmed that viscoelastic mechanical properties majorly changed after tendon injury or during recovery. Also, Aubry et al. evaluated differences in viscoelastic properties between normal and pathological Achilles tendons using SWE. They reported the high specificity of SWE for the assessment of tendon softening, while its sensitivity was relatively low. Moreover, Cortes et al. demonstrated that SWE could be used to assess regional changes in the viscoelastic properties of tendons following tendon injury or during recovery.
Today, SWE is known as a simple, objective, and quantitative technique for assessing the hardness of the Achilles tendon. The hardness of this tendon may significantly change after injury or during the repair process, and the Achilles tendon rupture is especially common. In the current study, the elasticity of ruptured Achilles tendons significantly reduced compared to normal Achilles tendons, and the difference was significant in different recovery periods (Figure 6). The trend of changes in elasticity showed that it gradually increased with the extension of recovery time. The amplitude of elasticity increase at 3 - 6 months after surgery was greater than that found at 1 - 3 months postoperatively. However, in the majority of patients, elasticity did not fully recover to a normal level within six months.
The Emean values of normal and ruptured Achilles tendons [Emean, mean elasticity of the Achilles tendon in the region of interest (ROI) Emean-A, Emean of a ruptured Achilles tendon before surgery; Emean-B, Emean of a ruptured Achilles tendon at one month after surgery; Emean-C, Emean of a ruptured Achilles tendon at three months after surgery; Emean-D, Emean of a ruptured Achilles tendon at six months after surgery; Emean-E, Emean of a normal Achilles tendon (**P < 0.01)].
Overall, the AOFAS-AHS can indicate the functional recovery of the Achilles tendon. The SWE of ruptured Achilles tendons at six months after surgery indicated similar results to normal Achilles tendons; however, except that the uniformity of a color image was slightly worse. According to the results of the present study and previous research, the recovery process in a ruptured Achilles tendon mainly involves viscoelastic normalization and homogenization of the local tissue. Therefore, recovery of the Achilles tendon following rupture is a long-term, chronic, and relatively complex process.
In conclusion, future imaging research must focus on the functional diagnosis of Achilles tendon injuries. Chronic Achilles tendon injuries, ruptured Achilles tendons, and a number of systemic diseases may cause changes in the biological function of this tendon. SWE can quantitatively measure the Achilles tendon hardness. Based on the findings, elasticity can directly and quantitatively reflect the hardness of the Achilles tendon, although individual differences are relatively significant. Overall, the functional recovery of the Achilles tendon after rupture can be quantitatively assessed using SWE.
![The E<sub>mean</sub> of a normal Achilles tendon [E<sub>mean</sub>, the mean elasticity of the tendon in the region of interest (ROI)]. Elasticity has a large fluctuation range. The E<sub>mean</sub> of a normal Achilles tendon [E<sub>mean</sub>, the mean elasticity of the tendon in the region of interest (ROI)]. Elasticity has a large fluctuation range.](https://services.brieflands.com/cdn/serve/3170b/1ceb91991fd17b03baa02024943523ba90a1087e/iranjradiol-106415-i001-F5-preview.webp)
![The E<sub>mean</sub> values of normal and ruptured Achilles tendons [E<sub>mean</sub>, mean elasticity of the Achilles tendon in the region of interest (ROI) E<sub>mean-A</sub>, E<sub>mean</sub> of a ruptured Achilles tendon before surgery; E<sub>mean-B,</sub> E<sub>mean</sub> of a ruptured Achilles tendon at one month after surgery; E<sub>mean-C</sub>, E<sub>mean</sub> of a ruptured Achilles tendon at three months after surgery; E<sub>mean-D</sub>, E<sub>mean</sub> of a ruptured Achilles tendon at six months after surgery; E<sub>mean-E</sub>, E<sub>mean</sub> of a normal Achilles tendon (**P < 0.01)]. The E<sub>mean</sub> values of normal and ruptured Achilles tendons [E<sub>mean</sub>, mean elasticity of the Achilles tendon in the region of interest (ROI) E<sub>mean-A</sub>, E<sub>mean</sub> of a ruptured Achilles tendon before surgery; E<sub>mean-B,</sub> E<sub>mean</sub> of a ruptured Achilles tendon at one month after surgery; E<sub>mean-C</sub>, E<sub>mean</sub> of a ruptured Achilles tendon at three months after surgery; E<sub>mean-D</sub>, E<sub>mean</sub> of a ruptured Achilles tendon at six months after surgery; E<sub>mean-E</sub>, E<sub>mean</sub> of a normal Achilles tendon (**P < 0.01)].](https://services.brieflands.com/cdn/serve/3170b/0d5ae7a30641013b0ebc171b120152e25da5f67c/iranjradiol-106415-i002-F6-preview.webp)