


1. Background
Today, coronavirus disease 2019 (COVID-19), caused by severe acute respiratory syndrome coronavirus 2 (SARS-CoV-2), has spread around the world. As of May 30, 2020, a total of 6,025,764 confirmed cases of COVID-19 were reported worldwide, with 368,404 deaths (6.1%). Patients with COVID-19 may have different outcomes, and therefore, they need different levels of clinical care. Most patients with COVID-19 have mild symptoms or no symptoms, while some patients can progress to severe pneumonia rapidly, leading to acute respiratory distress syndrome (ARDS), multiple organ dysfunction syndrome (MODS), or even death.
Currently, several clinical and laboratory indicators are used to assess the severity of COVID-19 in patients with infectious pneumonia and to predict their prognosis (1-5). However, some clinical and laboratory tests are not accurate enough. Also, most of these tests are invasive and may cause iatrogenic infections. Besides, scoring systems, such as the Acute Physiology and Chronic Health Evaluation (APACHE-II), are often subjective and time-consuming and may not be conducive to a timely clinical intervention for COVID-19. Computed tomography (CT) plays an important role in screening, diagnosis, evaluation, and follow-up of patients with COVID-19 (6-9). However, the CT evaluation of patients with COVID-19 is often semi-quantitative and greatly affected by subjective factors related to the radiologist. Therefore, it cannot accurately quantify the CT features or quantitatively assess the severity of disease.
With the rise of artificial intelligence (AI), this branch has been incorporated in different medical fields, such as risk and prognosis prediction of lung cancer and ARDS (10, 11). Considering the fast and non-invasive nature of CT examination, besides the objectivity and efficiency of AI, if AI-derived features, obtained from CT in the early stages of COVID-19, can be used to assess the risk of progression to the critical stage, they can be highly beneficial in clinical interventions for the disease. However, there are few reports on the application of AI in the evaluation of COVID-19 (12, 13).
2. Objectives
In this study, we aimed to investigate the value of AI-derived quantitative CT parameters in assessing the risk of progression to the critical stage of COVID-19.
3. Patients and Methods
3.1. Study Design and Participants
This case-control study was performed on hospitalized patients with laboratory-confirmed COVID-19 pneumonia, who underwent CT examinations on admission at a single hospital from January 2020 to March 2020. All patients were discharged or expired before the date of data collection. They were divided into two groups based on the clinical outcomes: (1) critical group (case), including critical and expired patients; and (2) non-critical group (control) including mild, moderate, and severe patients. The controls were matched for age and comorbidities with the case group and enrolled at a case-control ratio of 1: 3. All patients in the case and control groups received standard institutional care for COVID-19 pneumonia during hospitalization. This retrospective study was approved by the local ethics committee, and the need to obtain informed consent was waived.
3.2. Data Collection
The demographic, clinical, laboratory, and CT data of the case and control groups were retrieved from the electronic medical records and the picture archiving and communication system (PACS) in a hospital form via standardized collection.
3.3. CT Protocol
CT imaging was performed at the end of expiration, while the patient was lying in a supine position with both arms raised. Two CT scanners were used for 156 patients in this study. The CT parameters in the GE Discovery CT750 HD system were as follows: (1) reconstructed slice thickness, 1.25 mm; (2) slice gap, 1.25 mm; (3) tube voltage, 120 kV; (4) automatic tube current modulation, and display field of view (DFOV), 40.0 × 46.6 cm. Also, the CT parameters in the siemens somatom definition system were as follows: (1) reconstructed slice thickness, 1.0 mm; (2) slice gap, 1.0 mm; (3) tube voltage, 120 kV; (4) automatic tube current modulation, and DFOV, 36.8 × 42.9 cm.
3.4. Quantitative Chest CT Analysis
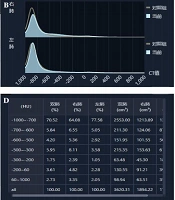
A quantitative CT system (YITU-CT-Lung, YITU Healthcare Technology Co., Ltd., China) was used to quantitatively analyze the pulmonary involvement of COVID-19 (Figure 1). The AI algorithms were used to automatically calculate seven quantitative parameters, representing the lung volume percentages in density intervals of -1000 ~ -700 HU (HU-1), -700 ~ -600 HU (HU-2), -600 ~ -500 HU (HU-3), -500 ~ -300 HU (HU-4), -300 ~ -200 HU (HU-5), -200 ~ 60 HU (HU-6), and 60 ~ 1000 HU (HU-7).
.")
AI-based quantitative chest CT analysis of a patient with COVID-19. A, Axial CT image; B, Coronal CT image; C, Histogram of total lung density; and D, Distribution table of total lung volume (AI, artificial intelligence; COVID-19, Coronavirus disease 2019).
The CT scans were categorized according to the interval from the onset of initial symptoms until the CT scan: stage 1 (0 - 4 days; n = 43); stage 2 (5 - 9 days; n = 75); stage 3 (10 - 14 days; n = 79); stage 4 (15 - 21 days; n = 83); stage 5 (22 - 28 days; n = 80); and stage 6 (> 28 days; n = 110) (6, 8). The quantitative CT parameters in different stages were compared between the two groups.
3.5. Statistical Analysis
Statistical analyses were performed in SPSS version 23.0 (IBM Inc., Chicago, IL, USA) and GraphPad Prism version 7.0 (GraphPad Software Inc., USA). Continuous variables were first examined using Kolmogorov-Smirnov test for normality. They are presented as mean ± standard deviation (SD) and compared between the groups using Mann-Whitney U test. Categorical variables are presented as number (percentage of total) and compared between the groups using chi-square test or Fisher’s exact test.
A binary logistic regression analysis was performed to explore the relationship between the quantitative CT parameters and the severity of COVID-19. A multivariable-adjusted logistic regression model, adjusted for sex, age, white blood cell (WBC) count, alanine aminotransferase (ALT), creatinine, procalcitonin (PCT), creatine kinase isoenzyme MB (CK-MB), and D-dimer, based on the quantitative CT parameters, was established to predict critical cases (critical vs. non-critical). Moreover, the predictive performance was estimated using the receiver operating characteristic (ROC) curve and by measuring the area under the ROC curve (AUC). When P-value was less than 0.05, the difference was considered to be statistically significant.
4. Results
4.1. Clinical and Laboratory Data
The most common symptoms at the onset of disease were fever (78.8%) and dry cough (41.7%), followed by fatigue (34.0%) and chest distress (24.4%). Although the incidence of these symptoms was higher in the critical group than in the non-critical group, no significant difference was found between the two groups (Table 1). Hypertension was the most common comorbidity (28.8%), followed by diabetes (16.7%) and cardiovascular disease (6.4%). Although the incidence of hypertension, diabetes, and cardiovascular disease in the critical group was higher than the non-critical group, no significant difference was found between the groups (Table 1).
| Variables | All patients (n = 156) | Critical (n = 39) | Non-critical (n = 117) | P-value |
|---|---|---|---|---|
| Gender | ||||
| Male | 79 (50.6) | 28 (71.8) | 51 (43.6) | 0.002 |
| Female | 77 (49.4) | 11 (28.2) | 66 (56.4) | - |
| Age (y) | 59 ± 15 | 63 ± 14 | 58 ± 15 | 0.059 |
| Male | 61 ± 16 | 63 ± 15 | 60 ± 16 | 0.580 |
| Female | 57 ± 14 | 65 ± 10 | 56 ± 14 | 0.040 |
| Initial symptoms | ||||
| Fever | 123 (78.8) | 34 (87.2) | 89 (76.1) | 0.141 |
| Low-grade fever (37.3 - 38.0°C) | 61 (39.1) | 10 (25.6) | 51 (43.6) | 0.047 |
| Moderate-grade fever (38.1 - 39.0°C) | 52 (33.3) | 22 (56.4) | 30 (25.6) | < 0.0001 |
| High-grade fever ( > 39.0°C) | 9 (5.8) | 2 (5.1) | 7 (6.0) | 1.000 |
| Dry cough | 65 (41.7) | 20 (51.3) | 45 (38.5) | 0.160 |
| Expectoration | 17 (10.9) | 2 (5.1) | 15 (12.8) | 0.299 |
| Throat pain | 6 (3.8) | 1 (2.5) | 5 (4.3) | 0.978 |
| Chest distress | 38 (24.4) | 12 (30.8) | 26 (22.2) | 0.282 |
| Dyspnea | 26 (16.7) | 12 (30.8) | 14 (12.0) | 0.006 |
| Fatigue | 53 (34.0) | 18 (46.2) | 35 (29.9) | 0.064 |
| Nausea and vomiting | 5 (3.2) | 1 (2.6) | 4 (3.4) | 1.000 |
| Abdominal pain and diarrhea | 18 (11.5) | 3 (7.7) | 15 (12.8) | 0.563 |
| Myalgia | 23 (14.7) | 6 (15.4) | 17 (14.5) | 0.896 |
| Headache | 9 (5.8) | 2 (5.1) | 7 (6.0) | 1.000 |
| Dizziness | 3 (1.9) | 0 (0.0) | 3 (2.6) | 0.574 |
| Palpitation | 3 (1.9) | 1 (2.6) | 2 (1.7) | 1.000 |
| Comorbidities | ||||
| Hypertension | 45 (28.8) | 14 (35.9) | 31 (26.5) | 0.262 |
| Diabetes | 26 (16.7) | 8 (20.5) | 18 (15.4) | 0.457 |
| Cardiovascular disease | 10 (6.4) | 4 (10.3) | 6 (5.1) | 0.450 |
| Laboratory markers | ||||
| White blood cell count (WBC) (109/L) | 6.41 ± 3.94 | 9.36 ± 5.29 | 5.43 ± 2.77 | < 0.0001 |
| < 4 | 39 (25.0) | 4 (10.3) | 35 (29.9) | < 0.0001 |
| 4 - 10 | 102 (65.4) | 24 (61.5) | 78 (66.7) | - |
| > 10 | 15 (9.6) | 11 (28.2) | 4 (3.4) | - |
| Alanine aminotransferase (ALT) (U/L) | 37.46 ± 34.01 | 58.08 ± 44.45 | 30.59 ± 26.60 | < 0.0001 |
| ≤ 50 | 127 (81.4) | 23 (59.0) | 104 (88.9) | < 0.0001 |
| > 50 | 29 (18.6) | 16 (41.0) | 13 (11.1) | - |
| Creatinine (µmol/L) | 71.34 ± 23.67 | 79.58 ± 29.60 | 68.60 ± 20.76 | 0.035 |
| ≤ 104 | 144 (92.3) | 33 (84.6) | 111 (94.9) | 0.083 |
| > 104 | 12 (7.7) | 6 (15.4) | 6 (5.1) | - |
| Procalcitonin (PCT) (ng/mL) | ||||
| < 0.05 | 74 (59.2) | 9 (23.1) | 65 (75.6) | < 0.0001 |
| ≥ 0.05 | 51 (40.8) | 30 (76.9) | 21 (24.4) | - |
| Creatine kinase-MB (CK-MB) (U/L) | 15.81 ± 13.29 | 23.03 ± 20.80 | 12.89 ± 6.84 | < 0.0001 |
| ≤ 25 | 118 (89.4) | 28 (73.7) | 90 (95.7) | 0.001 |
| > 25 | 14 (10.6) | 10 (26.3) | 4 (4.3) | - |
| D-dimer (ng/mL) | 2596.32 ± 6972.42 | 6390.00 ± 10983.84 | 1187.24 ± 3919.41 | < 0.0001 |
| ≤ 500 | 96 (66.7) | 13 (33.3) | 83 (79.0) | < 0.0001 |
| > 500 to ≤ 1000 | 13 (9.0) | 7 (17.9) | 6 (5.7) | - |
| > 1000 | 35 (24.3) | 19 (48.7) | 16 (15.2) | - |
| Time from the initial symptoms until admission (d) | 10.8 ± 7.3 | 10.9 ± 5.6 | 10.7 ± 7.8 | 0.308 |
The incidence rate of leukocytosis and elevated levels of ALT, PCT, CK-MB, and D-dimer were higher in the critical group than in the non-critical group, and there was a significant difference between the groups (Table 1). Although the incidence of creatinine increase in the critical group was higher than the non-critical group, no significant difference was found between the two groups (Table 1).
4.2. Quantitative Chest CT Analysis in Different Stages
A total of 470 CT scans (mean = 3.0; SD = 1.6) were collected from 156 patients. In stage 1, the lung volume percentage in different density intervals was not significantly different between the two groups (P = 0.596 - 0.938) (Figure 2). In other stages, the lung volume percentage in different density intervals was significantly different between the two groups (P < 0.05). However, in stage 2 and stage 4, the lung volume percentage was not significantly different between the two groups at the HU-2 interval (P = 0.158 and P = 0.371, respectively) (Figure 2).
, HU-2 (B), HU-3 (C), HU-4 (D), HU-5 (E), HU-6 (F), HU-7 (G), HU-2+HU-3 (H), and HU-4+HU-5 (I). Differences between critical and non-critical groups were not significant in stage 1, while they were significant in all other stages, except stage 2 and stage 4 in HU-2. HU-1 to HU-7 represent the lung volume percentages in different density intervals of -1000 ~ -700 HU (HU-1), -700 ~ -600 HU (HU-2), -600 ~ -500 HU (HU-3), -500 ~ -300 HU (HU-4), -300 ~ -200 HU (HU-5), -200 ~ 60 HU (HU-6), and 60 ~ 1000 HU (HU-7). S-1 to S-6 represent the intervals between the disease onset and CT scan: S-1 (0 - 4 days); S-2 (5 - 9 days); S-3 (10 - 14 days); S-4 (15 - 21 days); S-5 (22 - 28 days); and S-6 (> 28 days) (COVID-19, Coronavirus disease 2019).")
Temporal changes in the quantitative chest CT parameters from the time of disease onset in COVID-19 patients. This figure shows temporal changes in HU-1 (A), HU-2 (B), HU-3 (C), HU-4 (D), HU-5 (E), HU-6 (F), HU-7 (G), HU-2+HU-3 (H), and HU-4+HU-5 (I). Differences between critical and non-critical groups were not significant in stage 1, while they were significant in all other stages, except stage 2 and stage 4 in HU-2. HU-1 to HU-7 represent the lung volume percentages in different density intervals of -1000 ~ -700 HU (HU-1), -700 ~ -600 HU (HU-2), -600 ~ -500 HU (HU-3), -500 ~ -300 HU (HU-4), -300 ~ -200 HU (HU-5), -200 ~ 60 HU (HU-6), and 60 ~ 1000 HU (HU-7). S-1 to S-6 represent the intervals between the disease onset and CT scan: S-1 (0 - 4 days); S-2 (5 - 9 days); S-3 (10 - 14 days); S-4 (15 - 21 days); S-5 (22 - 28 days); and S-6 (> 28 days) (COVID-19, Coronavirus disease 2019).
4.3. Multivariable-Adjusted Associations Between Quantitative CT Parameters and COVID-19 Severity Based on The Binary Logistic Regression Model
We found that the quantitative CT parameters were related to the outcomes of patients with COVID-19 (Table 2). Based on the binary regression analysis, the lung volume percentage in HU-1 was a protective factor for the adverse outcomes of COVID-19, with a crude odds ratio (OR) of 0.931 (95% CI, 0.905 ~ 0.958; P < 0.0001) and an adjusted OR of 0.953 (95% CI, 0.918 ~ 0.990; P = 0.013). The lung volume percentages in other HU intervals were risk factors for the adverse outcomes of COVID-19.
| Variable | Crude OR (95% CI) | Adjusted OR (95% CI) c |
|---|---|---|
| HU-1 | 0.931 (0.905, 0.958) | 0.953 (0.918, 0.990) |
| HU-2 | 1.162 (1.039, 1.300) | 1.027 (0.875, 1.206) |
| HU-3 | 1.404 (1.199, 1.646) | 1.157 (0.933, 1.436) |
| HU-4 | 1.281 (1.157, 1.419) | 1.159 (1.011, 1.306) |
| HU-5 | 1.888 (1.454, 2.451) | 1.592 (1.141, 2.222) |
| HU-6 | 1.303 (1.170, 1.452) | 1.237 (1.080, 1.415) |
| HU-7 | 1.999 (1.453, 2.750) | 1.768 (1.114, 2.808) |
| HU-2 + HU-3 | 1.127 (1.053, 1.206) | 1.035 (0.943, 1.136) |
| HU-4 + HU-5 | 1.198 (1.113, 1.290) | 1.125 (1.020, 1.240) |
Abbreviations: OR, Odds ratio; CI, confidence interval.
a HU-1 to HU-7 represent the lung volume percentages in different density intervals of -1000 ~ -700 HU (HU-1), -700 ~ -600 HU (HU-2), -600 ~ -500 HU (HU-3), -500 ~ -300 HU (HU-4), -300 ~ -200 HU (HU-5), -200 ~ 60 HU (HU-6), and 60 ~ 1000 HU (HU-7).
b The Hosmer-Lemeshow (H-L) goodness of fit test was used in the logistic regression model (P = 0.351 ~ 0.627).
c Adjusted for age, sex, WBC, ALT, creatinine, PCT, CK-MB, and D-dimer.
The crude OR for HU-2 was 1.162 (95% CI, 1.039 ~ 1.300; P = 0.008) with an adjusted OR of 1.027 (95% CI, 0.875 ~ 1.206; P = 0.743); the crude OR for HU-3 was 1.404 (95% CI, 1.199 ~ 1.646; P < 0.0001) with an adjusted OR of 1.157 (95% CI, 0.933 ~ 1.436; P = 0.184); the crude OR for HU-4 was 1.281 (95% CI, 1.157 ~ 1.419; P < 0.0001) with an adjusted OR of 1.159 (95% CI, 1.011 ~ 1.306; P = 0.035); and the crude OR for HU-5 was 1.888 (95% CI, 1.454 ~ 2.451; P < 0.0001) with an adjusted OR of 1.592 (95% CI, 1.141 ~ 2.222; P = 0.006).
Also, the crude OR for HU-6 was 1.303 (95% CI, 1.170 ~ 1.452) with an adjusted OR of 1.237 (95% CI, 1.080 ~ 1.415; P = 0.002); the crude OR of HU-7 was 1.999 (95% CI, 1.453 ~ 2.750; P < 0.0001) with an adjusted OR of 1.768 (95% CI, 1.114 ~ 2.808; P = 0.016); the crude OR of HU-2+HU-3 was 1.127 (95% CI, 1.053 ~ 1.206; P = 0.001) with an adjusted OR of 1.035 (95% CI, 0.943 ~ 1.136; P = 0.471); and the crude OR of HU-4+HU-5 was 1.198 (95% CI, 1.113 ~ 1.290; P < 0.0001) with an adjusted OR of 1.125 (95% CI, 1.020 ~ 1.240; P = 0.018) (Table 2).
4.4. Predictive Performance of Quantitative Chest CT Scan for COVID-19 Severity
The ROC curve was used to analyze the predictive performance of quantitative chest CT parameters for COVID-19 severity on admission. The AUC range of quantitative chest CT was 0.688 ~ 0.808 (P < 0.0001). The lung volume percentage in HU-6 showed the largest AUC (AUC: 0.808; 95% CI, 0.716 ~ 0.900; P < 0.0001), and the cutoff value of 5.93 had 71.79% sensitivity and 84.62% specificity (Figure 3 and Table 3).
, -700 ~ -600 HU (HU-2), -600 ~ -500 HU (HU-3), -500 ~ -300 HU (HU-4), -300 ~ -200 HU (HU-5), -200 ~ 60 HU (HU-6), and 60 ~ 1000 HU (HU-7) (COVID-19, Coronavirus disease 2019; ROC curve, receiver operating characteristic curve).")
The ROC curve analysis of various quantitative chest CT parameters for the prediction of COVID-19 severity on admission. HU-1 to HU-7 represent the lung volume percentages in different density intervals of -1000 ~ -700 HU (HU-1), -700 ~ -600 HU (HU-2), -600 ~ -500 HU (HU-3), -500 ~ -300 HU (HU-4), -300 ~ -200 HU (HU-5), -200 ~ 60 HU (HU-6), and 60 ~ 1000 HU (HU-7) (COVID-19, Coronavirus disease 2019; ROC curve, receiver operating characteristic curve).
| Variables | AUC (95% CI) | Sensitivity % (95% CI) | Specificity % (95% CI) | Cutoff Value (%) | P-Value |
|---|---|---|---|---|---|
| HU-1 | 0.788 (0.690 - 0.886) | 71.79 (55.13 - 85) | 87.18 (79.74 - 92.64) | 60.40 | < 0.0001 |
| HU-2 | 0.688 (0.596 - 0.780) | 79.49 (63.54 - 90.7) | 58.12 (48.64 - 67.18) | 6.10 | 0.0005 |
| HU-3 | 0.766 (0.676 - 0.857) | 74.36 (57.87 - 86.96) | 76.07 (67.3 - 84.47) | 4.89 | < 0.0001 |
| HU-4 | 0.794 (0.702 - 0.886) | 71.79 (55.13 - 85) | 84.62 (76.78 - 90.62) | 7.24 | < 0.0001 |
| HU-5 | 0.799 (0.706 - 0.892) | 69.23 (52.43 - 82.98) | 89.74 (82.77 - 94.59) | 3.09 | < 0.0001 |
| HU-6 | 0.808 (0.716 - 0.900) | 71.79 (55.13 - 85) | 86.32 (78.74 - 91.98) | 5.93 | < 0.0001 |
| HU-7 | 0.766 (0.668 - 0.865) | 71.79 (55.13 - 85) | 76.92 (68.23 - 84.21) | 2.82 | < 0.0001 |
| HU-2+HU-3 | 0.729 (0.638 - 0.820) | 76.92 (60.67 - 88.87) | 64.96 (55.59 - 73.55) | 11.08 | < 0.0001 |
| HU-4+HU-5 | 0.797 (0.705 - 0.889) | 69.23 (52.43 - 82.98) | 88.89 (81.75 - 93.95) | 11.12 | < 0.0001 |
Abbreviations: AUC, area under the curve; CI, confidence interval.
a HU-1 to HU-7 represent the lung volume percentages in different density intervals of -1000 ~ -700 HU (HU-1), -700 ~ -600 HU (HU-2), -600 ~ -500 HU (HU-3), -500 ~ -300 HU (HU-4), -300 ~ -200 HU (HU-5), -200 ~ 60 HU (HU-6), and 60 ~ 1000 HU (HU-7).
5. Discussion
To the best of our knowledge, few studies have used non-invasive quantitative CT measurements to predict the severity of COVID-19 (12, 14). For the first time, we used the lung volume percentages in different density intervals to assess the risk of progression to the critical stage of COVID-19. According to different CT values, we divided the entire lung into seven density intervals and used AI for automatic quantification. Our results showed that all quantitative CT parameters could well assess the risk of progression to the critical stage without considering the confounders.
Some laboratory tests, such as WBC, ALT, creatinine, PCT, CK-MB, and D-dimer, did not significantly affect the relationship between most quantitative CT parameters (HU-1, HU-4, and HU-7) and the severity of COVID-19. However, they could affect the relationship between some quantitative CT parameters (HU-2 and HU-3) and the severity of COVID-19. The results also showed that the lung volume percentage in HU-6 had the best predictive performance, with the largest AUC of 0.808; the cutoff value of 5.93% showed 71.79% sensitivity and 84.62% specificity.
The present study showed that there was no significant difference between the groups regarding the lung volume percentage in different density intervals in the early stages of COVID-19 (0 - 4 days). This difference began to become significant within 5 - 9 days and persisted even after one month. It seems that changes in the quantitative CT parameters in COVID-19 patients over time could provide a reference level for distinguishing the severity of COVID-19.
This study had several limitations that need to be considered when interpreting the results. First, compared to the non-critical group, there were fewer cases in the critical group, which decreased the reliability of statistical data. Second, due to the retrospective and single-center design of this study, there may be some selection bias. Third, the CT images in this study were acquired using two CT scanners in one clinical center. Therefore, multi-center research using different scanners is necessary to validate our results.
In this study, we found that quantitative chest CT parameters, classified according to different lung density intervals, could be used to assess the risk of progression to the critical stage of COVID-19. These CT parameters may be helpful for grading the severity of COVID-19 in an early stage and guide the medical staff for a better clinical management of high-risk critical cases to improve their prognosis.
