


1. Background
Since December 2019 when the first human case of coronavirus disease 2019 (COVID-19) was officially reported in Wuhan, China, the global spread of this disease has become a major threat to all humans, and the lives of millions of people are endangered around the world (1). Iran confirmed the COVID-19 pandemic on February 19, 2020, and Qom was one of the first metropolitan areas, reporting this disease. Overall, respiratory tract infections, caused by the novel severe acute respiratory syndrome coronavirus 2 (SARS-CoV-2), can range from a mild infection with a good prognosis to a severe disease that progresses to acute respiratory distress syndrome (ARDS) in early stages, leading to hospitalization. The probability of progression to the severe form of COVID-19 has been estimated at 15.7% - 26.1% in all patients (2-4).
The primary management of patients at risk of COVID-19 progression may provide suitable treatment strategies and facilitate the optimized use of medical resources, especially today, when clinicians are facing a serious shortage of beds and hospital facilities. Computed tomography (CT) examination plays an important role in both initial screening and auxiliary diagnosis of COVID-19 (5). Although the nucleic acid amplification test (NAAT) of the respiratory tract or sometimes blood specimens remains the gold standard method to confirm COVID-19 (6), both American and Chinese researchers strongly recommend CT imaging as the main modality for the diagnosis of COVID-19 during the current pandemic (7-10).
In this regard, a previous study conducted on a series of 51 patients with chest CT and reverse transcription polymerase chain reaction (RT-PCR) within three days showed that the sensitivity of CT imaging for COVID-19 was 98% compared to RT-PCR (71% sensitivity) (P < 0.001) (11). Meanwhile, the close relationship between the extent of lung lesions and clinical symptoms makes this method irreplaceable for the preliminary screening of COVID-19 (7). Some clinicians also believe that the severity of COVID-19 and its progression can be best determined by CT imaging (7, 12, 13).
2. Objectives
In this retrospective, case-control study on the medical records of confirmed COVID-19 pneumonia patients on admission, we aimed to investigate the CT manifestations and clinical and laboratory risk factors associated with the severity of COVID-19 pneumonia and to assess the association of COVID-19 severity with the patients’ clinical and laboratory records, CT findings, epidemiological features, and inflammation.
3. Patients and Methods
This study was approved by the Ethics Committee of Digestive Disease Research Institute of Tehran University of Medical Sciences, Tehran, Iran. All authors in this study addressed the ethical considerations (including plagiarism, informed consent, misconduct, data fabrication and/or falsification, double publication and/or submission, and redundancy). A retrospective review of the medical and radiological CT records of confirmed COVID-19 patients was performed in one public hospital and one respiratory clinic in Qom, Iran, from August 1 to September 30, 2020.
Patients who required oxygen therapy (either invasive or non-invasive ventilation), or humidified nasal high-flow oxygen therapy (OptiflowTM), or extracorporeal membrane oxygenation, along with patients who expired due to the disease, were classified in the severe group, while others who did not require any special medical care were managed as outpatients. The exclusion criteria were as follows: negative CT findings; insufficient chest CT image quality for image analysis; CT examination beyond seven days after the onset of symptoms; history of other lung infections or lobectomy; and missing clinical data in the medical files.
The clinical symptoms, recent exposure history, demographic information, comorbidities along with the used medications, and CT examinations on admission were recorded from the patients’ clinical history. Laboratory results, including complete blood count, blood chemical analysis, coagulation test, C-reactive protein (CRP) level, lactate dehydrogenase, and creatine kinase, were also obtained from the patients’ clinical history. CT scans were uniformly obtained in one radiological center from the apex to the lung base in the supine position, with the subject holding hands above the head while holding the breath, if possible. Imaging was performed on either a 16-slice Siemens Somatom Emotion system (Siemens Healthineers, Germany) or a 16-slice GE Optima 540 system (GE Healthcare, USA), with or without intravenous administration of iodinated contrast material.
All CT examinations were performed at a tube voltage of 100 - 120 kV, pitch of 0.8 - 1.5, automatic tube current of 120 mA, and slice thickness of 3 - 5 mm. All images were transferred and saved in a picture archiving and communication system (PACS). The lung window was set at a window level of -500 Hounsfield units (HU) and a width of 1500 HU and at a mediastinal level of 45 HU and a width of 400 HU. An independent expert chest radiologist and pulmonologist, blinded to the patients’ clinical history and primary interpretation of the original radiological center, interpreted all CT examinations again, based on the recommendations of the Nomenclature Committee of the Fleischner Society (14). In case of any inconsistency, a third radiologist (with 25 years of experience in pulmonary imaging diagnosis) reviewed the case for confirmation.
The reported lung abnormalities involved: (1) Distribution: presence of bilateral or unilateral, central or peripheral, and single or multiple abnormalities; (2) type of opacities: presence of consolidations (rounded or subpleural bands or areas of consolidation), crazy-paving pattern, ground-glass opacity (GGO) (nodular or areas of GGO); (3) opacity morphology: linear or round; (4) internal structures: air-bronchogram, cavitation, emphysema, and fibrosis; (5) position and number of lobes involving different opacities; (6) pleural thickening, pleural effusion, and pleural retraction; and (7) thoracic lymphadenopathy (≥ 10 mm in the short-axis dimension).
Statistical analyses were performed in SPSS version 22.0 (IBM, Armonk, NY, USA). Categorical variables are expressed as frequency, proportion ratio, and percentage and compared by Pearson’s chi-square test or Fisher’s exact test, as appropriate. The level of statistical significance (two-sided P-value) was considered to be less than 0.05. Quantitative variables are described as mean (standard deviation [SD]), since they are normally distributed (Kolmogorov-Smirnov D test; P ≥ 0.05) and compared by parametric t-test. P-values less than 0.05 were considered statistically significant.
4. Results
Among 236 confirmed COVID-19 cases (mean age [SD]: 51.08 [13.80] years; range: 18-84 years; 53.3% male), 62 (mean age [SD]: 54.86 [14.88] years; range: 29 - 83 years; 57.1% male) were infected with moderate to severe COVID-19 and required hospital admission, while 174 mild cases with a mean age of 49.8 years (SD: 13.24; range: 18 - 84 years; 52.1% male) were followed-up on an outpatient basis. The GGO was a common chest CT feature in both outpatient and hospitalized groups, without any significant difference (96.0% of outpatients vs. 100% of hospitalized patients) (Table 1).
| Characteristics | All patients (n = 236) | Disease severity | OR (95% CI) | P-value | |
|---|---|---|---|---|---|
| Outpatients (n = 174) | Hospitalized patients (n = 62) | ||||
| Involved lung sides | 4.614 (1.581 - 13.465) | 0.003* | |||
| Unilateral | 19.5 | 24.1 | 6.5 | ||
| Bilateral | 80.5 | 75.9 | 93.5 | ||
| Number of lobes involved | < 0.001* | ||||
| 1 | 13.1 | 16.1 | 4.8 | ||
| 2 | 14.8 | 19.5 | 1.6 | 0.107 (0.030 - 0.381) | |
| 3 | 17.8 | 19.5 | 12.9 | 0.029 (0.004 - 0.225) | |
| 4 | 20.3 | 21.8 | 16.1 | 0.235 (0.097 - 0.571) | |
| 5 | 33.9 | 23.0 | 64.5 | 0.263 (0.116 - 0.599) | |
| Lung involvement | |||||
| Peripheral | 98.3 | 98.3 | 98.4 | 0.934 (0.095 - 9.154) | 1.000 |
| Both peripheral and central | 51.3 | 40.8 | 80.6 | 0.172 (0.084 - 0.354) | < 0.001* |
| Central | 53.8 | 43.9 | 82.0 | 0.165 (0.082 - 0.333) | < 0.001* |
| Prominent | 0.762 (0.205 - 2.827) | 1.000 | |||
| Peripheral | 94.0 | 93.6 | 95.1 | 0.762 (0.205 - 2.827) | |
| Central | 6.0 | 6.4 | 4.9 | ||
| Pulmonary lesion type | |||||
| GGO | 97.0 | 96.0 | 100 | ** | 0.195 |
| Crazy-paving pattern | 23.6 | 16.3 | 44.3 | 0.249 (0.130 - 0.474) | < 0.001* |
| Consolidation | 32.5 | 26.0 | 50.8 | 0.340 (0.186 - 0.624) | < 0.001* |
| Nodules | 0.4 | 0.6 | - | ** | 1.000 |
| Air bronchogram | 42.3 | 36.4 | 59.0 | 0.398 (0.219 - 0.722) | 0.002* |
| Linear morphology | 40.6 | 31.8 | 65.6 | 0.245 (0.132 - 0.454) | < 0.001* |
| Round morphology | 93.1 | 95.3 | 86.9 | 3.094 (1.107 - 8.648) | 0.037* |
| Pleural effusion | 1.7 | 1.2 | 3.3 | 0.347 (0.048 - 2.519) | 0.281 |
| Lymphadenopathy | 0.4 | 0.6 | - | ** | 1.000 |
| Cavitation | 0.9 | 1.2 | - | ** | 1.000 |
| Fibrosis | 0.9 | 1.2 | - | ** | 1.000 |
| Emphysema | 0.4 | 0.6 | - | ** | 1.000 |
Abbreviations: GGO, ground-glass opacity; OR, odds ratio; CI , confidence interval.
aCategorical variables are reported as percentage.
b*, A two-sided P-value less than 0.05 is marked as the level of significance; **, the OR is incomputable due to the presence of zero values.
Bilateral lung involvement, which was present in 80.5% of cases, was significantly higher in the hospitalized group compared to the outpatient group (93.5% vs. 75.9%) (Table 1). The incidence of consolidation, linear opacities, crazy-paving pattern, air bronchogram sign, and number of involved lobes were also significantly higher in the hospitalized group (Table 1). However, only the crazy-paving pattern was significantly associated with the inflammatory level and hypoxemia (normal vs. high CRP: OR, 0.237; 95% confidence interval (CI), 0.061 - 0.919; SpO2 < 90% in room air at rest: OR, 0.217; 95% CI, 0.074 - 0.639). Although no significant difference was observed in the ratio of men to women between the outpatient and hospitalized groups, the crazy-paving pattern was more frequent among men, with a significant difference based on chi-square test (P < 0.05; OR: 0.408; 95% CI: 0.211 - 0.788) (Table 2).
| Characteristics | All patients (n = 236) | Patients | OR (95% CI) | P-value | |
|---|---|---|---|---|---|
| With a crazy-paving pattern (n = 55) | Without a crazy - paving pattern (n = 181) | ||||
| Age, mean (SD) | 51.08 (13.805) | 56.79 (13.759) | 49.17 (13.396) | ** | < 0.001* |
| Age, range | 18 - 90 | 31 - 84 | 18 - 83 | ** | |
| Gender | 2.480 (1.284 - 4.789) | 0.007* | |||
| Male | 53.3 | 69.8 | 48.5 | ||
| Female | 46.7 | 30.2 | 51.5 | ||
| Hospitalized | 26.3 | 49.1 | 19.1 | 0.249 (0.130 - 0.474) | < 0.001* |
| BMI group | |||||
| Normal | 26.3 | 33.3 | 24.8 | 0.667 (0.274 - 1.620) | 0.514 |
| Overweight | 47.4 | 42.2 | 49.1 | ||
| Obese | 26.3 | 24.4 | 26.1 | 1.053 (0.460 - 2.411) | |
| Contact with an infected person | 31.4 | 22.6 | 34.7 | 1.769 (0.864 - 3.625) | 0.100 |
| Comorbidities | |||||
| Hypertension | 25.2 | 25.0 | 24.6 | 1.016 (0.496 - 2.080) | 0.948 |
| Diabetes | 18.9 | 28.8 | 16.2 | 0.466 (0.225 - 0.964) | 0.043* |
| Hypothyroidism | 7.2 | 3.8 | 8.4 | 2.244 (0.493 - 10.212) | 0.370 |
| Rheumatoid arthritis | 5.9 | 1.9 | 7.2 | 3.873 (0.492 - 30.521) | 0.310 |
| Asthma | 6.3 | 3.8 | 7.2 | 1.899 (0.411 - 8.772) | 0.527 |
| Chronic obstructive pulmonary disease | 4.5 | 2 | 5.4 | 2.795 (0.346 - 22.602) | 0.459 |
| Kidney disease | 5.0 | 3.8 | 5.4 | 1.398 (0.292 - 6.682) | 1.0000 |
| Open heart surgery | 3.2 | - | 4.2 | ** | 0.202 |
| Cancer | 1.8 | - | 1.8 | ** | 1.0000 |
| Smoking | 16.4 | 9.1 | 18.2 | 2.127 (0.782 - 5.788) | 0.143 |
| Chemotherapy | 1.8 | - | 1.8 | ** | 1.0000 |
| Oral corticosteroid spray | 17.0 | 21.6 | 15.2 | 0.671 (0.305 - 1.474) | 0.291 |
| Nasal corticosteroid spray | 2.3 | 2.0 | 1.8 | 1.210 (0.132 - 11.078) | 1.0000 |
| Systemic corticosteroids | 10.1 | 11.8 | 9.1 | 0.795 (0.294 - 2.151) | 0.789 |
| Total corticosteroid consumption history | 21.7 | 27.5 | 19.6 | 0.656 (0.318 - 1.352) | 0.235 |
| Chloroquine consumption history | 10.6 | 19.6 | 7.4 | 0.348 (0.143 - 0.851) | 0.012* |
| ACEI1 consumption history | 2.8 | 4.0 | 2.5 | 0.596 (0.106 - 3.356) | 0.628 |
| ARB2 consumption history | 21.8 | 24.0 | 20.2 | 0.846 (0.400 - 1.788) | 0.569 |
| Metformin consumption history | 13.8 | 21.6 | 11.7 | 0.470 (0.207 - 1.068) | 0.075 |
| Influenza vaccination in recent years | 7.7 | 10.9 | 6.3 | 0.597 (0.196 - 1.816) | 0.335 |
| Pneumococcal vaccination in recent years | 1.4 | 2.2 | 1.3 | 0.559 (0.050 - 6.306) | 0.533 |
Abbreviations: OR, odds ratio; BMI, body mass index; CI , confidence interval.
aCategorical variables are reported as percentage.
b*, A two-sided P-value less than 0.05 is marked as the level of significance; **, the OR is incomputable due to the presence of zero values or a quantitative variable; 1, angiotensin-converting enzyme (ACE) inhibitors, such as captopril (Capoten), enalapril (Epaned or Vasotec), and lisinopril (Zestril or Prinivil); 2, recall of angiotensin II receptor blockers (ARBs), including Valsartan, Losartan, and Irbesartan.
We also found that the crazy-paving pattern was significantly more common among older patients (OR for age > 50 years = 2.684; 95% CI: 1.408 - 5.117) and patients with diabetes (OR: 2.102; 95% CI: 1.015 - 4.352) (Table 2). Most clinical symptoms were similar between COVID-19 patients with a crazy-paving pattern and those without this pattern, except for severe cough (OR: 2.529; 95% CI: 1.008 - 6.344) and palpitations (Table 3).
| Clinical signs and symptoms | All patients (n = 236) | Patients | OR (95% CI) | P-value | |
|---|---|---|---|---|---|
| With a crazy-paving pattern (n = 55) | Without a crazy - paving pattern (n = 181) | ||||
| Weakness | 82.1 | 79.2 | 83.0 | 1.282 (0.591 - 2.783) | 0.541 |
| Cough | 79.0 | 88.7 | 76.0 | 0.405 (0.161 - 0.998) | 0.048* |
| Shortness of breath | 72.6 | 78.8 | 70.8 | 0.649 (0.309 - 1.364) | 0.252 |
| Anorexia | 74.1 | 83.0 | 71.3 | 0.509 (0.231 - 1.122) | 0.090 |
| Fatigue | 76.4 | 73.3 | 77.2 | 1.232 (0.577 - 2.630 | 0.589 |
| Body pain | 71.0 | 79.2 | 68.4 | 0.567 (0.271 - 1.187) | 0.129 |
| Fever | 63.8 | 66.0 | 63.2 | 0.882 (0.461 - 1.685) | 0.703 |
| Headache | 63.1 | 54.9 | 65.5 | 1.559 (0.826 - 2.943) | 0.169 |
| Sweating | 69.1 | 63.5 | 70.8 | 1.393 (0.725 - 2.679) | 0.319 |
| Shiver | 58.0 | 60.4 | 57.3 | 0.881 (0.470 - 1.651) | 0.693 |
| Nausea | 44.2 | 37.7 | 46.2 | 1.417 (0.753 - 2.664) | 0.278 |
| Palpitations | 43.4 | 28.8 | 47.9 | 2.270 (1.160 - 4.444) | 0.015* |
| Loss of taste | 37.3 | 27.5 | 40.2 | 1.779 (0.895 - 3.539) | 0.098 |
| Loss of smell | 35.3 | 26.9 | 37.9 | 1.654 (0.832 - 3.289) | 0.149 |
| Stomach problems | 35.7 | 30.8 | 37.3 | 1.337 (0.687 - 2.604) | 0.414 |
| Sputum | 30.3 | 34.6 | 29.0 | 0.771 (0.398 - 1.494) | 0.441 |
| Diarrhea | 28.6 | 25.5 | 29.6 | 1.228 (0.603 - 2.501) | 0.571 |
| Sore throat | 29.4 | 25.0 | 30.8 | 1.333 (0.657 - 2.705) | 0.384 |
| Bruises | 23.8 | 26.7 | 23.0 | 0.821 (0.385 - 1.747) | 0.608 |
| Vomiting | 19.5 | 19.2 | 19.6 | 1.027 (0.467 - 2.257) | 0.948 |
| Blurred vision | 19.5 | 23.1 | 18.3 | 0.749 (0.352 - 1.591) | 0.451 |
| Coughing up blood | 2.3 | 1.9 | 2.4 | 1.236 (0.135 - 11.312) | 1.0000 |
Abbreviations: OR, odds ratio; CI , confidence interval.
aCategorical variables are reported as percentage.
b*, A two-sided P-value less than 0.05 is marked as the level of significance.
Regarding the laboratory findings, the increased level of CRP, neutrophil count, and erythrocyte sedimentation rate (ESR) were significantly higher among patients with a crazy-paving pattern in their chest CT scan (Table 4). A decrease in lymphocyte count was observed in 41.7% of patients with the crazy-paving pattern in chest CT scans. Further details about differences in each variable between the two hospitalized and outpatient groups and between patients with and without the crazy-paving pattern on CT scans on admission can be found in Appendix 1-4 in Supplementary File.
| Characteristics | All Patients (n = 236) | Patients | OR (95% CI) | P-value | |
|---|---|---|---|---|---|
| With a crazy-paving pattern (N = 55) | Without a crazy-paving pattern (N = 181) | ||||
| Clinical findings | |||||
| Pulse rate range | 1.051 (0.512 - 2.160) | 1.000 | |||
| 60 - 100 signals per min | 68.1 | 68.9 | 68.5 | ||
| > 100 | 31.4 | 31.1 | 30.8 | ||
| < 60 | 0.5 | - | 0.7 | ||
| SpO2 | 0.217 (0.074 - 0.639) | 0.007* | |||
| ≥ 90 | 92.1 | 81.4 | 95.2 | ||
| < 90 | 7.9 | 18.6 | 4.8 | ||
| Respiratory rate | 2.571 (0.598 - 11.059) | 0.200 | |||
| 12 - 30 | 100 | 100 | 100 | ||
| > 30 | |||||
| Blood pressure | 1.733 (0.140 - 21.387) | 1.000 | |||
| Normal | 90.3 | 92.9 | 88.2 | ||
| > 14 | 9.7 | 7.1 | 11.8 | ||
| Laboratory findings | |||||
| White blood cell count | 0.280 | ||||
| 4000 - 11000 | 76.0 | 79.3 | 74.2 | 1.739 (0.427 - 7.084) | |
| < 4000 | 14.6 | 6.9 | 18.2 | ||
| > 11000 | 9.4 | 13.8 | 7.6 | 4.800 (0.655 - 35.198) | |
| Lymphocyte count | 0.516 (0.187 - 1.426) | 0.218 | |||
| 1000 - 4800 | 68.4 | 58.3 | 72.5 | ||
| < 1000 | 31.6 | 41.7 | 27.5 | ||
| Neutrophils | 0.289 (0.045 - 1.846) | 0.210 | |||
| 1500 - 8000 | 83.3 | 73.3 | 90.5 | ||
| > 8000 | 16.7 | 26.7 | 9.5 | ||
| Red blood cells | 0.240 (0.051 - 1.119) | 0.063 | |||
| 4.7 - 6.1 in males | |||||
| 4.2 - 5.4 in females | 46.7 | 28.6 | 62.5 | ||
| Low | 53.3 | 71.4 | 37.5 | ||
| Hemoglobin | ** | 1.000 | |||
| 13.5 - 17.5 in males | |||||
| 12 - 15.5 in females | 75.8 | 75.9 | 75.4 | ||
| Low | 22.1 | 24.1 | 21.5 | ||
| High | 2.1 | - | 3.1 | ||
| Platelet count | ** | 1.000 | |||
| 150.000 - 450.000 | 78.1 | 79.3 | 77.3 | ||
| < 150.000 | 19.8 | 20.7 | 19.7 | ||
| > 450.000 | 2.1 | - | 3.0 | ||
| CRP | ** | 0.017* | |||
| - | 31.3 | 13.6 | 40.0 | ||
| + | 20.9 | 13.6 | 24.4 | ||
| ++ | 17.9 | 18.2 | 17.8 | ||
| +++ | 28.4 | 50.0 | 17.8 | ||
| ++++ | 1.5 | 4.5 | - | ||
| ESR | 0.114 (0.023 - 0.557) | 0.002* | |||
| Normal | 10.2 | 11.1 | 53.7 | ||
| High | 15.3 | 88.9 | 46.3 | ||
| Lactate dehydrogenase | ** | 0.485 | |||
| 140 - 280 | 10.5 | - | 18.2 | ||
| > 280 | 89.5 | 100 | 81.8 | ||
| Blood urea nitrogen | 0.778 (0.111 - 5.457) | 1.000 | |||
| 7 - 20 | 16.1 | 14.3 | 17.6 | ||
| > 20 | 83.9 | 85.7 | 82.4 | ||
| Creatinine | 1.422 (0.328-6.174) | 0.638 | |||
| 0.7 - 1.2 in males | |||||
| 0.5 - 1 in females | 56.7 | 61.5 | 52.9 | ||
| High | 43.3 | 38.5 | 47.1 | ||
| Mean corpuscular volume | 0.667 (0.35 - 12.840) | 1.000 | |||
| 80 - 96 | 88.2 | 85.7 | 90.0 | ||
| > 96 | 11.8 | 14.3 | 10.0 | ||
| Mean corpuscular hemoglobin | ** | 1.000 | |||
| 27 – 33 | 93.8 | 100 | 90.0 | ||
| < 27 | 6.3 | - | 10.0 | ||
Abbreviations: CRP, C-reactive protein; ESR, erythrocyte sedimentation rate; OR, odds ratio; SpO2, oxygen saturation; CI, confidence interval.
aEach categorical variable is presented as percentage
b*, A two-sided P-value less than 0.05 is marked as the level of significance; **, the OR is incomputable due to the presence of zero values
5. Discussion
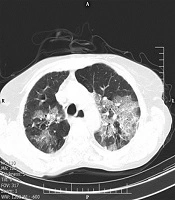
Our findings indicated that the crazy-paving pattern in a radiological chest CT scan can predict the severity of COVID-19. The crazy-paving pattern is a radiological sign, which is characterized by the presence of scattered or diffuse ground-glass attenuation with a linear pattern superimposed on the chest CT image, resembling irregular paving stones (Figure 1) (14). The linear pattern is associated with interlobular septal thickening and intralobular lines and may be also caused by the presence of intralobular fibrosis or a linear deposition of material within the airspaces (14). Although the crazy-paving pattern was initially described as a pathognomonic sign of alveolar proteinosis, today, it is considered as a non-specific pattern, reported in different diffuse acute and chronic lung diseases, including bacterial and viral pulmonary infections and adult ARDS (14, 15).

The crazy-paving pattern. The crazy-paving pattern can be observed in the left upper lobe.
Although it is considered a non-specific radiological sign, if there is a crazy-paving pattern, the chest CT features are labeled as “interstitial pneumonia” at least in the early stages (16). Meanwhile, radiological features suggest that the crazy-paving pattern is no longer present in the recovery stage; as we observed in this study, it is inevitably a sign of disease progression (17). Although pathological findings underlying this radiological feature are not clearly defined, some researchers suggest that this pattern may be correlated with the hyperplasia of interlobular and intralobular interstitial tissues (16, 18). Therefore, we recommend that patients with such radiological manifestations be discharged with more caution.
The overall distribution of COVID-19 patients with a crazy-paving pattern is approximately 5% - 36% in different studies (12). In the present study, we observed a significantly higher incidence of the crazy-paving pattern in hospitalized patients (OR: 4.084; 95% CI: 2.138 - 7.803); this manifestation can be an alarming sign in the management of patients and is consistent with a recently published study from China (13). According to pathological information about SARS, the crazy-paving pattern in COVID-19 may be also caused by alveolar edema and interstitial inflammation in acute lung injuries (19, 20). Therefore, as previously discussed, it can be a sign of COVID-19 progression or peak (21). Around 18% of patients with the crazy-paving pattern presented with hypoxemia (SpO2 < 90% in room air at rest), while hypoxemia occurred in only 4.8% of patients with no signs of this pattern.
It is known that hypoxemia is an alarming sign and a cause of concern for both patients and physicians, especially in the decision-making process for managing hospitalization. The clinical factors of aging, male gender, and diabetes may be risk factors for the crazy-paving pattern; this may be attributed to the patient’s weakened immune system function and comorbidities with other infections, especially in diabetic patients. Severe cough seems to be the most important clinical sign related to the crazy-paving pattern, which may be caused by the inflammatory effects on the pleura. According to a hypothesis, severe dry cough in COVID-19 patients with the crazy-paving pattern may be explained by the high viscosity of the mucus and damage to dilated bronchioles, leading to insufficient sputum motility (12).
Almost 42% of patients with a crazy-paving pattern in chest CT scans also had reduced lymphocyte counts, indicating immune function inhibition due to the reduced number of immune cells. Damage to lymphocytes has been associated with disease exacerbation in patients with COVID-19 and has been introduced as an important index for the evaluation of disease severity (22, 23). The increased neutrophil count and CRP in patients with a crazy-paving pattern may be also related to the cytokine storm, induced by viral invasion, as mentioned in various studies (22, 24).
The GGO was the most common CT finding among COVID-19 pneumonia patients, with no significant difference between the hospitalized and outpatient groups. The bilateral distribution of GGO, with or without consolidation in the posterior and peripheral lungs, was initially described as the cardinal hallmark of COVID-19 (3, 25). On the other hand, consolidation was significantly more frequent in severe cases, probably due to the presence of inflammatory exudates in the alveoli. Moreover, in a review study of chest CT manifestations of COVID-19, consolidation was an indication of disease progression (12).
In conclusion, our findings suggest that the crazy-paving pattern is significantly associated with the inflammatory levels. The presence of this pattern on admission, an SpO2 < 90%, older age, and diabetes were independent risk factors for the severity and progression of COVID-19. We believe that this pattern has the potential to predict the risk of COVID-19 progression and can be used as a guide for designing a decision‐making model for hospitalization.
