1. Background
Multiple sclerosis (MS) is a chronic disease, in which the immune system attacks and demyelinates axons in the central nervous system (CNS). The course of MS follows a relapsing-remitting pattern, which is more frequent in women and in the age group of 15 - 45 years. A combination of genetic and non-genetic predispositions is involved in the etiology of MS; however, its exact cause remains unknown (1, 2). Although the current incidence rate of MS is nearly 100 per 100,000 patients in Iran (3), higher rates of up to 200 per 100,000 people have been reported in other countries (4-6).
Prompt diagnosis and treatment can produce better outcomes and lower morbidity rates in MS patients (7, 8). Magnetic resonance imaging (MRI) has been the imaging modality of choice, with high sensitivity for early detection and monitoring of demyelinating lesions in MS (9-12). Gadolinium (GAD)-based contrast agents (GBCAs) have been used for decades in diagnostic workups and surveillance of various central and peripheral nervous system disorders (13). Contrast-enhanced MRI is one of the most useful modalities to improve the detection of lesions in MS patients (14). Evidence suggests that higher cumulative doses of GBCAs can improve the detection accuracy of lesions, especially in patients with active lesions (as reported after contrast enhancement) (15). However, safety concerns have been raised regarding the administration of GBCAs after repeated measurements (16), mainly due to GAD deposition in various tissues.
Concerns about the effects of GBCAs are not limited to neural tissues, and their long-term effects on other human tissues have been also controversial (17). Recent studies have shown that GAD tends to deposit cumulatively in the neural tissue of patients with an intact blood-brain barrier, normal hepatobiliary, and normal renal function [glomerular filtration rate (GFR): 60 - 90] (18). It has been also reported that different chemical properties of GBCAs may lead to different levels of tissue deposition. For example, T1 hyperintensities have been observed in the dentate nucleus (DN) and globus pallidus following the administration of linear GBCAs rather than macrocyclic agents (19, 20).
Recently, some clinical studies have investigated the application of enhanced MRI with GBCAs for MS patients; however, the use of these agents remains a matter of debate. Some review studies have reported safety concerns about GBCAs in MS patients. Besides, hyperintensities have been reported in the DN and globus pallidus in non-enhanced T1-weighted (T1W) MRI in correlation with previous GBCA administrations (21, 22).
2. Objectives
This study aimed to evaluate changes in the DN signal intensity of MS patients with multiple linear GBCA injections for brain MRI.
3. Patients and Methods
3.1. Patient Selection and Data Collection
A total of 122 MS patients with a history of multiple GAD exposures, as well as 61 patients without a history of MS (control group), were enrolled retrospectively during 2008 - 2018. The controls had indications for brain MRI due to headache, while they had no history of neurological disorders, metabolic diseases, head traumas, or GAD injections; also, their MRI scans were normal. The patients’ demographics are presented in Table 1.
| Variables | MS group (n = 122) | Control group (n = 61) |
|---|---|---|
| Female/male | 102/20 | 31/30 |
| Age, y (range) | 36.7 ± 9.1 (19 - 48) | 27 ± 1.2 (20 - 45) |
| Disease duration (y) | 11.2 ± 7.2 | - |
| Median EDSS score (range) | 3.5 ± 0.9 (1 - 6.5) | - |
| Mean number of previous contrast-enhanced MRI scans per patient (range) | 12.7 ± 8.4 (2 - 30) | - |
| Mean cumulative gadodiamide dose (mL) | 123.7 ± 76.7 (30 - 450) | - |
Abbreviation: EDSS, expanded disability status scale; MS, multiple sclerosis; MRI, magnetic resonance imaging.
a Values are expressed as mean ± SD.
The inclusion criteria in this study were as follows: diagnosed cases of relapse-remitting MS (excluding other MS subtypes); history of multiple contrast-enhanced MRI scans with only linear GBCAs (gadodiamide, Omniscan, GE Healthcare AS, Oslo, Norway); recent available non-enhanced T1W brain MRI scans; and the time of disease onset and the first MRI with contrast injection. On the other hand, patients with a known history of renal failure, hepatic failure, radiotherapy, or chemotherapy were excluded from the study. Also, MS patients with plaques or artifacts in the posterior fossa, including the dentate nucleus (DN), cerebellum, and pons, were excluded from the MS group.
In each MRI scan series, a standard dose of GAD (single dose of 0.1 mmol/kg) was administered for the patients. The Ethics Committee of Tehran University of Medical Sciences approved this study. All patients signed written informed consent forms before the study.
3.2. Renal and Liver Functions
The renal and liver functions were evaluated, given their essential rule in the accumulation of GAD. The renal and liver functions were found to be normal in all patients before each GAD injection.
3.3. Imaging Analysis
Non-enhanced T1W MRI was performed to evaluate the prevalence of GAD accumulation in the DN. A transverse 2-dimensional T1W spin-echo sequence [repetition time (TR), 450 ms; echo time (TE), 10 ms; section thickness, 3 mm; matrix size, 256 × 256; and field of view (FOV), 240 mm] was used as the MRI protocol. The final brain MRI scans were performed using 1.5T MRI systems (Magnetom Symphony, Siemens Medical Solutions, Erlangen, Germany). All scans were assessed by a neuroradiologist with experience in MS. It is worth mentioning that the information regarding the patient’s identity was removed, and all assessments were performed in a blind manner.
For the assessment of DN, we performed both qualitative (observation of hyperintense DN) and quantitative assessments [signal intensity ratio (SIR) measurement]. For the qualitative analysis, the presence or absence of hyperintensity in the DN was determined in a subjective visual assessment. A T1 hyperintensity was defined as an irregularly ribbon-like DN with an increased signal intensity in non-enhanced images. In most cases, the DN is not visible in non-enhanced T1W MRI; therefore, a visible hyperintensity in this region suggests a hyperintense DN in non-enhanced T1W MRI.
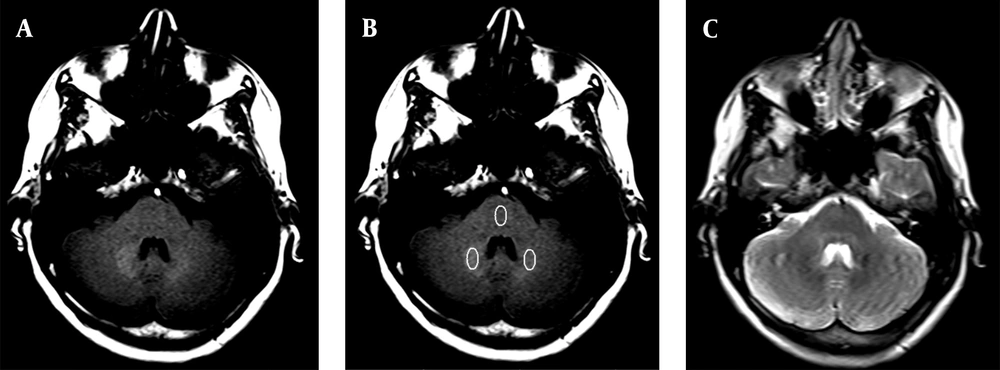
Moreover, for the quantitative analysis, the DN-to-pons SIR was calculated. The pons was selected for the SIR measurements, because the probability of GAD deposition in pons has been reported to be low (23). T2W images were acquired for increased precision in the region of interest (ROI) placement. An ellipsoid ROI (compatible with the DN shape) was drawn, with a larger diameter of 10 mm and a smaller diameter of 5 mm, positioned within the DN (bilaterally) and the pons for each patient (Figure 1). The SIR was calculated by dividing the mean signal intensity of bilaterally DN to that of pons.
A, Axial T1W MRI shows gadolinium (GAD) deposition in the dentate nucleus (DN) in a woman with 24 GAD injections in her lifetime; B, Axial T1W MRI shows the regions of interest (ROIs) in the DN and pons for signal intensity ratio (SIR) measurements; C, Axial T2W MRI for a more accurate ROI placement in the DN and pons.
Comparisons between the patient and control groups, as well as different MS subgroups based on the total number of MRI scans (> 4 times vs. others), were performed regarding the mean SIR and visible hyperintensity. To assess the intra-rater reliability, 15 patients were assessed twice by a radiologist in a time interval of one month. The intraclass correlation coefficient (ICC) of SIR between the two assessment sessions was 0.85.
3.4. Statistical Analysis
IBM SPSS version 22 was used for statistical analysis of data. Chi-square, Fisher’s exact test, independent-samples t-test, and Pearson’s correlation coefficient test were performed for data analysis. For continuous variables, the normality of data distribution was examined before analysis, and if the data were not normally distributed, non-parametric tests were used as appropriate. P-values less than 0.05 were defined as statistically significant.
4. Results
A total of 122 MS patients were assessed in this study. All MS patients had undergone multiple GAD-enhanced MRI examinations over the past years. Sixty-one healthy controls were also enrolled in this study. Among MS patients, 83 received contrast agents > 4 times (68%). Overall, 26 patients showed DN hyperintensity, all of whom had a history of contrast injection more than four times. None of the patients (n = 39) with ≤ 4 contrast injections showed DN hyperintensity, while 26 out of 83 patients with a history of > 4 contrast injections showed DN hyperintensity (31.3%) [P < 0.001; odds ratio (OR): 1.7; 95% confidence interval (CI): 1.4 - 2]. Also, none of the controls showed DN hyperintensity in MRI scans.
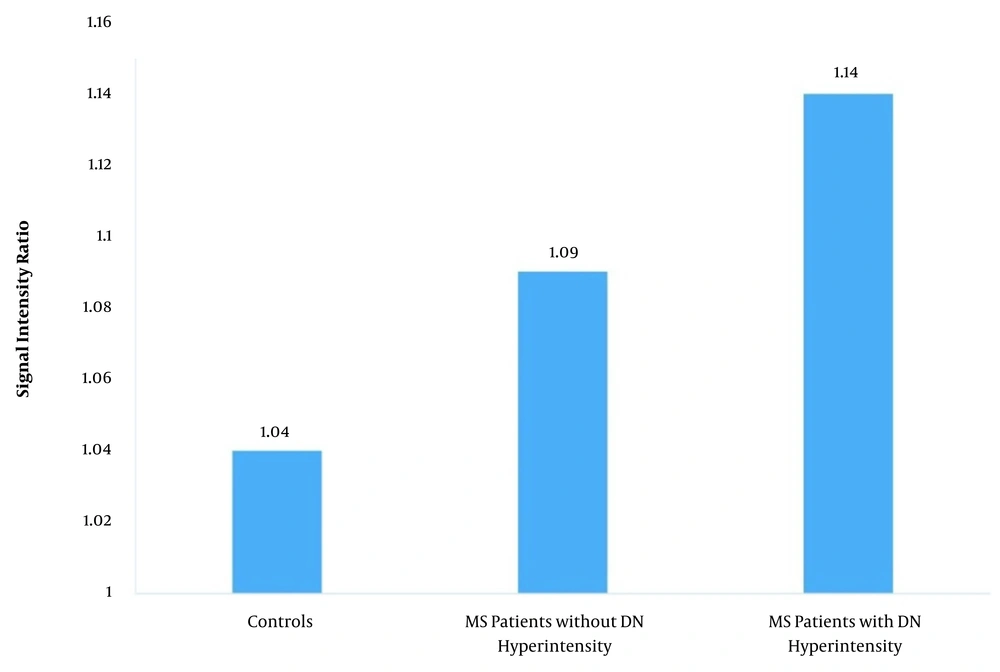
The mean DN-to-pons SIRs in the patient and control groups were 1.1 ± 0.07 and 1.04 ± 0.02, respectively (P < 0.001). Among MS patients, the mean SIR was 1.14 ± 0.04 in patients with DN hyperintensity, while it was 1.09 ± 0.07 in other patients (P < 0.001); both P-values were < 0.001 for the comparison of controls with the two subgroups of MS (Figure 2 and Table 2).
| Variables | No. | SIR | |
|---|---|---|---|
| Mean ± SD | P-value | ||
| MS vs. controls | < 0.001 | ||
| MS | 122 | 1.1 ± 0.07 | |
| Control | 61 | 1.04 ± 0.02 | |
| MS patients with DN hyperintensity vs. other MS patients | < 0.001 | ||
| DN hyperintensity | 26 | 1.14 ± 0.04 | |
| No DN hyperintensity | 96 | 1.09 ± 0.07 | |
| History of GAD injection | < 0.001 | ||
| > 4 Times | 83 | 1.12 ± 0.07 | |
| ≤ 4 Times | 39 | 1.06 ± 0.04 | |
| History of GAD injection | < 0.001 | ||
| > 4 Times (excluding patients with hyperintense DN) | 57 | 1.11 ± 0.08 | |
| ≤ 4 Times | 39 | 1.06 ± 0.04 | |
Abbreviations: SIR, signal intensity ratio; DN, dentate nucleus; MS, multiple sclerosis; GAD, gadolinium.
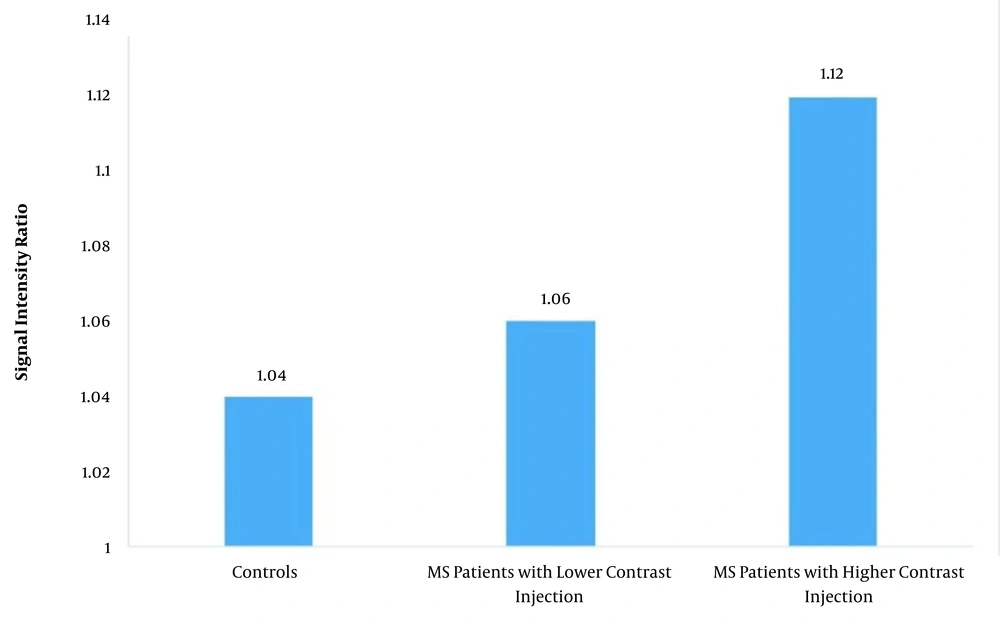
In patients with > 4 comparison of controls with contrast injections, the mean SIR was 1.12 ± 0.07, while in other patients, the mean SIR was 1.06 ± 0.04 (P < 0.001). The P-value for the comparison of controls with MS patients with fewer contrast injections was 0.14, while it was < 0.001 for the comparison of controls with MS patients with > 4 contrast injections (Figure 3 and Table 2).
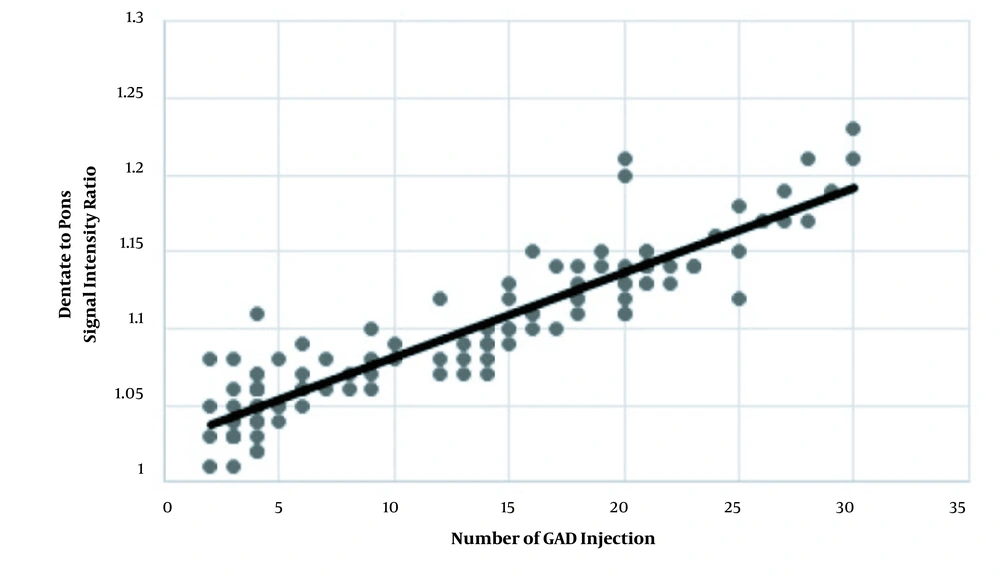
After removing patients with visible DN hyperintensity from the group with > 4 GAD injections, the mean SIRs were 1.11 ± 0.08 and 1.06 ± 0.04 in patients with > 4 GAD injections and those with ≤ 4 injections, respectively (P < 0.001) (Table 2). The correlation coefficient of SIR with the number of contrast injections was 0.91 (P = 0.001) (Figure 4). The mean cumulative GAD dose was 123.7 ± 76.7 mL (range: 30 - 450 mL) in the MS group. Also, the mean cumulative GAD dose was 155.8 ± 71.5 in patients with > 4 contrast injections and 55.4 ± 26 in patients with ≤ 4 injections (P < 0.001).
5. Discussion
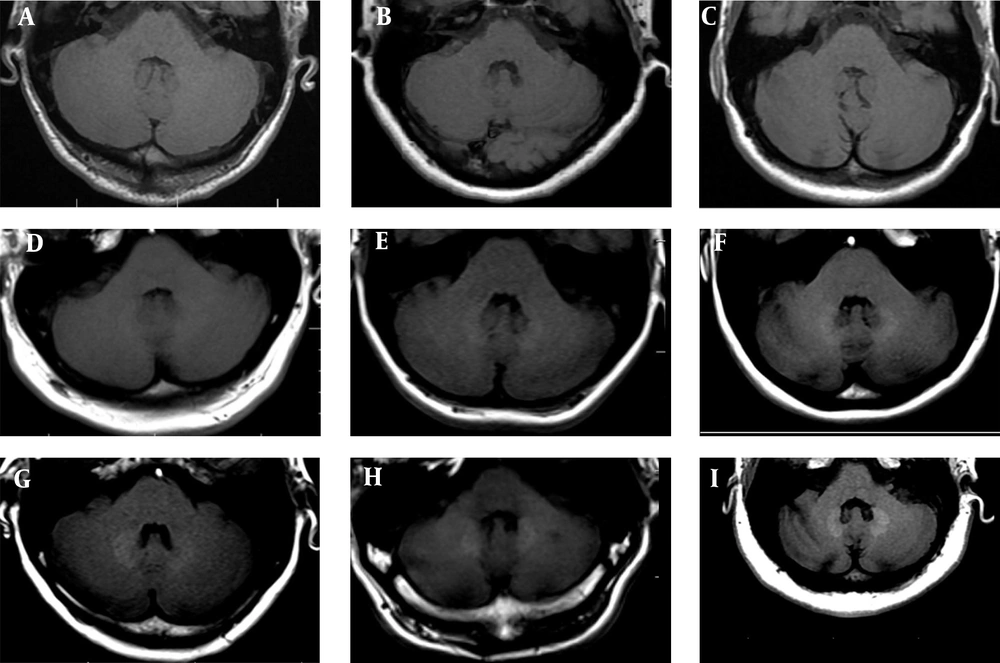
According to the present results, based on both visual and quantitative analyses of SIR using non-enhanced T1WI scans, patients who received > 4 GAD injections were more likely to have GAD deposition in the DN. However, it is unknown whether GAD accumulates in the brain tissue. Accordingly, in this retrospective study, the prevalence of GAD accumulation was analyzed in a comparative analysis of MS patients. The results revealed GAD accumulation in the DN in a large group of MS patients after more than four GAD-enhanced MRI scans (Figure 5).
The MRI scans demonstrate the dentate nucleus (DN). A, Non-enhanced axial T1W MRI of the posterior fossa at the level of DN in the control group (normal cases). B & C, There is no detectable gadolinium (GAD) deposition or MRI signal in the DN of patients with fewer GAD injections. By increasing the frequency of GAD injections, the deposition (visually) and signal intensity (quantitatively) of the DN increased (D-I) (A: no injection, SIR = 1.01; B: two injections, SIR = 1.01; C: six injections, SIR = 1.01; D: 12 injections, SIR = 1.05; E: 17 injections, SIR = 1.10; F: 20 injections, SIR = 1.13; G: 24 injections, SIR = 1.15; H: 27 injections, SIR = 1.17; and I: 30 injections, SIR = 1.21).
In the present study, GAD accumulation in the DN was lower in MS patients with ≤ 4 GAD injections. This finding is highly consistent with the results of a study by Errante et al. (23), which suggested a progressive increase in T1 signal intensity of DN subsequent to multiple GAD injections. Moreover, according to a study by Roberts and Holden (24), in younger age groups, such as the pediatric population, GAD deposition is even a greater concern. Besides, Kanda et al. (25) reported significant correlations between the SIRs of DN to pons and globus pallidus to thalamus and the number of previous GBCA exposures. As mentioned earlier, the chemical properties of the contrast agent is a key factor in the degree of deposition. Moser et al. (26) found that the DN-to-pons SIR increased in patients who were exposed to linear GBCA administrations. On the other hand, there was no significant increase in patients who received gadobutrol (a cyclic agent).
According to studies by Roberts and Kanda (24, 25), non-linear agents, such as gadobutrol, are useful in decreasing deposition in MS patients. Moreover, Ramalho et al. (27) demonstrated a significant increase in the DN intensity with multiple GAD-based agents, but not with gadobenate dimeglumine-enhanced agents, emphasizing the importance of pharmacodynamics and pharmacokinetics of different contrast agents. They reported GAD deposition in the DN with gadobenate dimeglumine administration in contrast to gadodiamide, which exhibited a lower deposition rate.
The chemical bonds in GBCAs are composed of a GAD ion and a carrier molecule. A carrier molecule is called a chelating agent, which modifies the distribution of GAD in the body to overcome its toxicity while maintaining its contrast properties. Structurally, GBCAs can be divided into two groups based on the ligand. Linear agents have an elongated organic molecular ligand that wraps around the ion (e.g., Omniscan gadodiamide and Magnevist gadopentetate), while cyclic agents form a cage-like ligand structure with the ion enclosed in the cavity of the complex (e.g., Gadavist gadobutrol and Dotarem gadoterate). The cyclic agents tend to have lower dissociation constants and are therefore deemed to be more stable than linear agents. Both linear and cyclic agents can be either ionic or non-ionic and non-tissue specific extracellular or tissue-specific (28).
In 2017, the Pharmacovigilance Risk Assessment Committee (PRAC) of the European Medicines Agency (EMA) formally submitted its guideline to suspend the use of some linear GBCAs due to the potential risk of GAD accumulation in humans (29). The American College of Radiology (ACR) has also reported some evident changes in T1W MRI signal intensities, as macrocyclic (cyclic) agents deposit GAD within brain tissues. Besides, quantitative mass spectrometry data from multiple sources confirm GAD deposition, although at lower levels. The ACR continues to address the need for further research toward a greater understanding of the mechanisms, cellular effects, and clinical consequences of GAD tissue deposition (30).
In another study on nine cadavers with at least one GAD injection during their lifetime, the sampling results showed that five of them received gadoteridol (a macrocyclic agent; ProHance); two received gadobutrol (a macrocyclic agent; Gadovist); and all of them received gadobenate (a linear agent, MultiHance) and gadoxetate (a linear agent, Eovist). In samples with the highest GAD levels in the globus pallidus and DN, GAD was found in all brain areas. It was 23 times higher in the bones than in the brain, while no measurable amount of GAD deposition in the brain or bone tissue was found in the control group (31).
Evidence suggests that deposition of GAD in human tissues occurs with both macrocyclic and linear agents in patients with a normal renal function. There is also evidence of GAD deposition within the proximal femur, as seen in proximal femoral specimens from patients undergoing total hip arthroplasty. Both linear and macrocyclic GBCAs may be implicated in the tissue GAD deposition, although the deposited amount of linear GBCAs is much more than macrocyclic GBCAs (20).
Moreover, Robert et al. (32) evaluated GAD accumulation in the deep cerebellar nuclei of healthy rats by comparing linear GAD-based contrasts with GBCAs and a macrocyclic contrast agent. Three linear GBCAs (gadobenate dimeglumine, gadopentetate dimeglumine, and gadodiamide) and a macrocyclic GBCA (gadoterate meglumine) were used in their study. The results showed that all linear contrast agents induced a significant increase in the signal intensity of deep cerebellar nuclei on T1W images, whereas the macrocyclic GBCA did not increase the signal intensity. Also, increased T1 signal hyperintensity was reported in healthy rats with repeated administrations of the linear contrast, which could be related to GAD deposition in the cerebellum.
In another study by Tedeschi et al. (33), patients with similar MS characteristics to our participants were enrolled. They evaluated changes in T1 and T2 relaxometry of DN with respect to previous administrations of GBCAs. The results showed that the DN relaxation rate (1/T1) was significantly correlated with the number of GBCA administrations. Also, the amount of GAD accumulation had a correlation with T1-shortening in these patients. Moreover, Barbieri et al. (34) showed that deposition and accumulation of linear GAD-based contrast agents increased in patients with background diseases, such as renal failure. However, the reason for the higher incidence of GAD accumulation in patients with a history of multiple exposures to GAD during their lifetime has not been explained due to its complexity.
In the present study, the DN-to-pons SIR was significantly higher in MS patients compared to the control group; this suggests that SIR is a more relevant index for linear GBCA deposition in MS patients. Based on the results, the SIR in patients with > 4 contrast injections was higher than other patients. These findings suggest that the DN signal intensity of patients with a history of multiple GAD injections ( > 4 times) without hyperintensity in the DN is still higher than that of patients with fewer GAD injections (≤ 4 times) and normal individuals; therefore, GAD deposition in the DN is gradual and invisible at first.
We faced some limitations in the present study. The insufficient data to compare macrocyclic GBCAs with linear agents is one of the shortcomings of this study. Besides, we could not perform tissue analyses for the concurrent evaluation of GAD deposition and its association with the DN SIR changes. Also, the clinical importance of our findings was not determined, which is also another limitation of this study. It seems that experiments on the correlation of histopathological findings with T1 and T2 relaxation time can be helpful in defining the indicators of tissue pathological status.
In conclusion, according to the present results, signal intensity and visible hyperintensity of the DN increased as the number of linear contrast injections increased; this finding might be related to the tissue deposition of GBCAs. Overall, GAD deposition can be an important factor in MS treatment, as it can cause DN damage and neurological deficits. The clinical significance and relevance of this phenomenon should be assessed in future studies.

