1. Background
Ductal carcinoma in situ (DCIS) of the breast is a clinically, radiologically, and genetically heterogeneous spectral group of diseases. It is characterized by a malignant proliferation of ductal epithelial cells within the terminal duct lobular unit, without invasion of the basement membrane. Although DCIS is an obligate precursor of invasive ductal carcinoma, almost 30 to 50% of all untreated DCIS cases progress into invasive ductal carcinoma, according to previous reports (1-4).
Nevertheless, all patients diagnosed with DCIS are commonly treated for invasive carcinoma, because there are no reliable predictive markers of disease progression (3). Mammography (MMG) is the primary screening tool for breast cancer, as microcalcifications are the most common MMG finding of DCIS (5, 6). Moreover, advances in technology and application of high-frequency transducers have facilitated the visualization of calcifications on ultrasonography (USG), especially in patients with dense breasts and cancer symptoms (7, 8).
Microcalcifications with suspicious features are associated with specific pathological features, such as a high nuclear grade and human epidermal growth factor receptor 2 (HER2) overexpression (9, 10). A higher nuclear grade, comedo necrosis, and a solid or cribriform architectural pattern are known to increase the risk of DCIS or invasive tumor recurrence in patients undergoing a breast-conserving surgery (11, 12). Moreover, estrogen receptor (ER), progesterone receptor (PR), C-erb B2 oncogene (HER2) expression, and Ki-67 proliferation index are well-established biomarkers for the prognosis of DCIS (13, 14). The ER status and HER2 status are usually maintained when DCIS progresses into invasive cancer, which specificity suggests the evolution of tumor subtype in breast cancer (15). HER2 has been considered as an important prognostic factor in invasive cancer, correlated with the prognosis of DCIS (16, 17). The HER2 status and Ki-67 index are prognostic factors, predicting the recurrence of DCIS after a breast-conserving surgery (18, 19).
A correlation has been reported between the imaging features of DCIS and pathological features in the literature, while few studies have focused on multiple imaging modalities (20-23). Therefore, this study aimed to investigate the correlation between the imaging and pathological features of pure DCIS by examining microcalcifications on MMG and USG images.
2. Objectives
This study aimed to investigate the correlation between the imaging and pathological features of pure DCIS by investigating microcalcifications on MMG and USG.
3. Patients and Methods
3.1. Patients
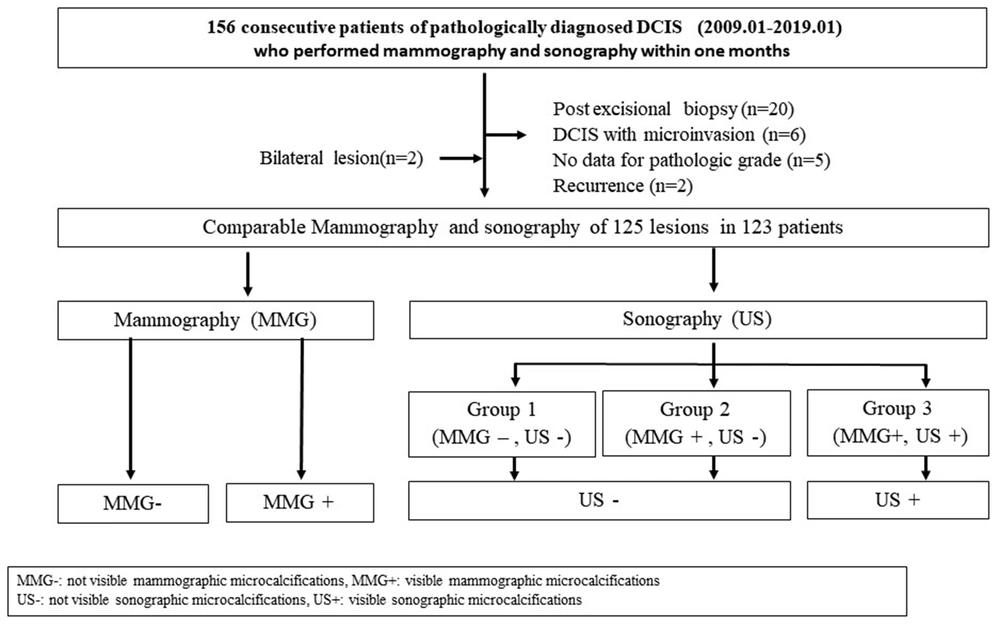
This retrospective study was approved by the Institutional Review Board (IRB), and the requirement for obtaining informed consent was waived. From January 2009 to January 2019, we retrospectively reviewed 156 consecutive patients with pathologically diagnosed DCIS, who had undergone MMG and USG in the last month. Thirty-three patients were excluded from the study, while there were two cases of bilateral lesions. Finally, a total of 125 lesions in 123 patients with surgically proven pure DCIS were examined in this study (Figure 1). All patients were female. Also, the average age of the participants was 52.3 years (range: 31 - 83 years).
3.2. Imaging Features
MMG was performed using digital mammography. The images were analyzed based on the picture archiving and communication system (PACS). Standard two-view MMG images (with an additional view if necessary) were read by two radiologists (with 18 and three years of experience in breast imaging, respectively), without knowledge of clinical or pathological data by consensus. Besides, the morphology and distribution of calcifications were analyzed using the breast imaging reporting and data system (BI-RADS) Atlas, Fifth Edition (24).
The features of MMG were divided into two groups of visible and invisible microcalcifications. The morphology of microcalcifications was classified as follows: punctate; amorphous/coarse heterogeneous; fine pleomorphic/linear branching. Besides, their distribution was classified as follows: group, segmental, linear, regional, and diffuse. Moreover, USG was performed using a broadband 5 - 12 MHz linear array transducer (LOGIQ E9, GE, Wauwatosa, WI, USA) or a broadband 5 - 17 MHz linear array transducer (iU22, Philips, Seattle, WA, USA).
The USG analyses were carried out by the same breast imaging specialists with knowledge of MMG microcalcifications using a PACS monitor. When echogenic foci corresponded to microcalcifications on MMG, they were also diagnosed by USG. Microcalcifications were recorded by USG, according to the BI-RADS Atlas Fifth Edition (24). Positive microcalcifications on USG were classified as follows: calcification in a mass; calcification outside a mass; and intraductal calcification. USG findings of microcalcifications were divided into three groups compared with MMG microcalcifications; group 1 (MMG negative, USG negative), group 2 (MMG positive, USG negative), and group 3 (MMG positive, USG positive).
3.3. Histopathological and Immunohistochemical Analyses
The nuclear grade was divided into low, intermediate, and high based on Van Nuys Prognostic Index. The presence of comedo necrosis was also recorded, and the estrogen receptor (ER) or progesterone receptor (PR) status was defined (25). The expression of c-erb B2 oncogene (HER2) was scored from 1+ to 3+, based on the immunohistochemical analyses (26). Silver-enhanced in situ hybridization (SISH) was also used for all equivocal cases (immunohistochemical staining score, 2+), using a Ventana HER2 Dual ISH DNA Probe Cocktail (Ventana Medical Systems, Inc., USA). Moreover, the Ki-67 index was divided into low (≤ 5%), intermediate (6 - 19%), and high (≥ 20%), based on the percentage of positive nuclear staining of cancer cells (3, 27). All DCIS cases were classified into three groups: ER positive group (ER+, HER2-, PR + or -), HER2 positive group (HER2+, ER/PR + or -), and triple negative group (28).
3.4. Statistical Analysis
The relationships between the presence of microcalcifications on MMG and USG and the nuclear grade, comedo necrosis, ER positivity, HER2 positivity, triple negativity, and Ki-67 index were assessed in this study. The odds ratio (OR) and 95% confidence interval (CI) were calculated. Since independent variables in the comparative analysis were nonparametric, a nonparametric analysis using chi-square test was performed. The level of statistical significance was set at P < 0.05. The microcalcifications detected on MMG and USG were compared in terms of nuclear grade, comedo necrosis, ER positive group, HER2 positive group by measuring the OR at 95% CI. SPSS version 20.0 (IBM SPSS Statistics, Chicago, IL, USA) was used for data analysis.
4. Results
4.1. Correlations of MMG Findings with Pathology and Immunochemistry
Microcalcifications were observed on MMG in 66.4% of cases (83/125). Positive MMG findings of microcalcifications were significantly associated with a high nuclear grade (OR = 15.14, 95% CI: 4.94 – 46.45, P = 0.001) and the presence of comedo necrosis (OR = 5.87, 95% CI: 2.60 - 13.23, P = 0.001) (Table 1). Moreover, positive MMG findings of microcalcifications were significantly associated with ER-negative group (the other patients except for ER positive group, OR = 2.47, 95% CI: 1.15 - 5.27, P = 0.023), HER2 positive group (OR = 3.56, 95% CI: 1.61 - 7.83, P = 0.002), and a high Ki-67 index (P = 0.001) (Table 2).
| MMG; 125 (100) | Nuclear grade; 125 (100) | P | Comedo necrosis; 125 (100) | P | |||
|---|---|---|---|---|---|---|---|
| Low-intermediate; 70 (56.0) | High; 55 (44.0) | Non-comedo; 44 (35.2) | Comedo; 81 (64.8) | ||||
| Negative microcalcifications | 42 (33.6) | 38 (30.4) | 4 (3.2) | 0.001 | 26 (20.8) | 16 (12.8) | 0.001 |
| Positive microcalcifications | 83 (66.4) | 32 (25,6) | 51 (40.8) | 18 (14.4) | 65 (52.0) | ||
| Morphology | 0.771 | 0.878 | |||||
| Punctate | 3 (3.6) | 1 (1.2) | 2 (2.4) | 1 (1.2) | 2 (2.4) | ||
| Amorphous, coarse heterogeneous | 32 (38.6) | 14 (16.9) | 18 (21.7) | 7 (8.4) | 25 (30.1) | ||
| Fine pleomorphic, linear branching | 48 (57.8) | 17 (20.5) | 31 (37.3) | 10 (12.0) | 38 (45.8) | ||
| Distribution | 0.796 | 0.350 | |||||
| Grouped | 38 (45.8) | 15 (18.1) | 23 (27.7) | 11 (13.3) | 27 (32.5) | ||
| Segmental | 31 (37.3) | 12 (14.5) | 19 (22.9) | 5 (6.0) | 26 (31.3) | ||
| Linear | 6 (7.2) | 3 (3.6) | 3 (3.6) | 2 (2.4) | 4 (4.8) | ||
| Regional | 6 (7.2) | 2 (2.4) | 4 (4.8) | 0 (0.0) | 6 (7.2) | ||
| Diffuse | 2 (2.4) | 0 (0.0) | 2 (2.4) | 0 (0.0) | 2 (2.4) | ||
a Values are expressed as No. (%).
| MMG; 125 (100) | ER group; 125 (100) | P | HER2 group; 125 (100) | P | Triple negative; group 125 (100) | P | Ki-67 index; 120 (100) | P | |||||
|---|---|---|---|---|---|---|---|---|---|---|---|---|---|
| Negative; 69 (55.2) | Positive; 56 (44.8) | Negative; 61 (48.8) | Positive; 64 (51.62) | Negative; 121 (96.8) | Positive; 4 (3.2) | ≤ 5%; 25 (20.8) | 6 - 19%; 53 (44.2) | ≥ 20%; 42 (35.0) | |||||
| Negative microcalcifications; 42 (33.6) | 17 (13.6) | 25 (20.0) | 0.023 | 29 (23.2) | 13 (10.4) | 0.002 | 39 (31.2) | 3 (2.4) | 0.110 | 11 (9.2) | 24 (20.0) | 4 (3.3) | 0.001 |
| Positive microcalcifications; 83 (66.4) | 52 (41.6) | 31 (24.8) | 32 (25.6) | 51(40.8) | 82 (65.6) | 1 (0.8) | 14 (11.7) | 29 (24.2) | 38 (31.7) | ||||
| Positive microcalcifications; 83 (100) | 52 (62.7) | 31 (37.3) | 32 (38.6) | 51 (61.4) | 82 (98.8) | 1 (1.2) | 14 (17.3) | 29 (35.8) | 38 (46.9) | ||||
| Morphology | 0.186 | 0.122 | 0.446 | 0.302 | |||||||||
| Punctate; 3 (3.6) | 3 (3.6) | 0 (0.0) | 0 (0.0) | 3 (3.6) | 3 (3.6) | 0 (0.0) | 0 (0.0) | 0 (0.0) | 3 (3.7) | ||||
| Amorphous, coarse heterogeneous; 32 (38.6) | 17 (20.6) | 15 (18.1) | 16 (19.3) | 16 (19.3) | 31 (37.3) | 1 (1.2) | 6 (7.4) | 13 (16.0) | 11 (13.6) | ||||
| Fine pleomorphic, linear branching; 48 (57.8) | 32 (38.6) | 16 (19.3) | 16 (19.3) | 32 (38.6) | 48 (57.8) | 0 (0.0) | 8 (9.9) | 16 (19.8) | 24 (29.6) | ||||
| Distribution | 0.283 | 0.208 | 0.878 | 0.732 | |||||||||
| Grouped, 38 (45.8) | 20 (24.1) | 18 (21.7) | 19 (22.9) | 19 (22.9) | 37 (44.6) | 1 (1.2) | 7 (8.6) | 12 (14.8) | 17 (21.0) | ||||
| Segmental, 31 (37.3) | 23 (27.7) | 8 (9.6) | 8 (9.6) | 23 (27.7) | 31 (37.3) | 0 (0.0) | 4 (4.9) | 14 (17.3) | 13 (16.0) | ||||
| Linear, 6 (7.2) | 3 (3.6) | 3 (3.6) | 3 (3.6) | 3 (3.6) | 6 (7.2) | 0 (0.0) | 1 (1.2) | 2 (2.5) | 3 (3.7) | ||||
| Regional, 6 (7.2) | 4 (4.8) | 2 (2.4) | 2 (2.4) | 4 (4.8) | 6 (7.2) | 0 (0.0) | 2 (2.5) | 1 (1.2) | 3 (3.7) | ||||
| Diffuse, 2 (2.4) | 2 (2.4) | 0 (0.0) | 0 (2.2) | 2 (2.4) | 2 (2.4) | 0 (0.0) | 0 (0.0) | 0 (0.0) | 2 (2.5) | ||||
Abbreviations: ER, estrogen receptor; HER2, epidermal growth factor receptor 2.
a Values are expressed as No. (%).
b The available number of Ki-67 index was n = 120.
4.2. Correlations of USG Findings with Pathology and Immunochemistry
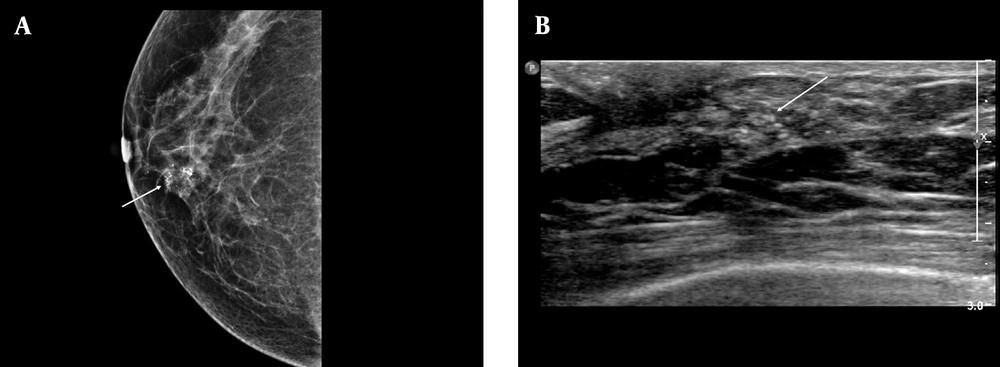
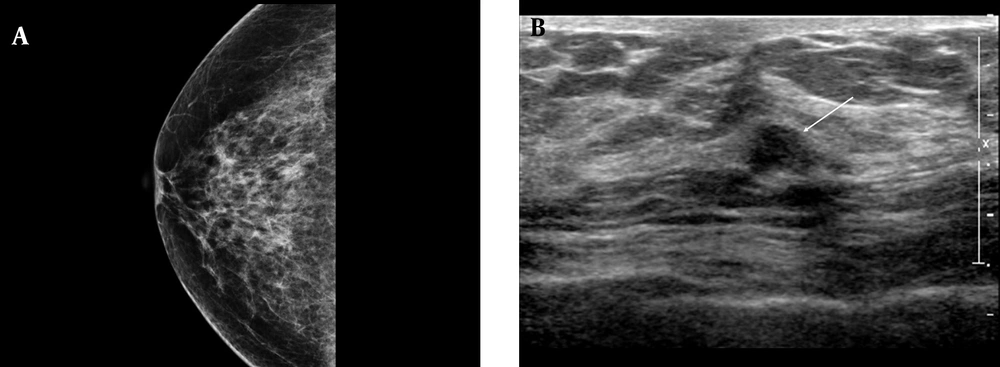
There were 62 (49.6%) lesions with negative microcalcifications on USG (group 1 and group 2) and 63 (50.4%) lesions with microcalcifications on USG (group 3). Calcifications outside the mass were the most common finding in group 3 (34/63, 54.0%). A high nuclear grade (OR = 7.54, 95% CI: 3.37 - 16.86, P = 0.001) and comedo necrosis (OR = 5.38, 95% CI: 2.37 - 12.21, P = 0.001) were reported in group 3 (Table 3). Besides, HER2-positive group (OR: 2.41, 95% CI: 1.17 - 4.93, P = 0.006) and high Ki-67 index (P = 0.001) were significantly associated with group 3 of microcalcification findings (Figures 2 and 3). Calcifications outside the mass were also associated with ER negativity (P = 0.017) and HER2 positivity (P = 0.008) (Table 4).
| USG; 125 (100) | Nuclear grade; 125 (100) | P | Comedo necrosis; 125 (100) | P | ||
|---|---|---|---|---|---|---|
| Low-Intermediate; 70 (56.0) | High; 55 (44.0) | Non-comedo; 44 (35.2) | Comedo; 81 (64.8) | |||
| Negative microcalcifications; 62 (49.6) | 49 (38.9) | 13 (11.1) | 0.001 | 33 (26.2) | 29 (23.2) | 0.001 |
| Group 1 (MMG-, USG-), 42 (33.6) | 38 (30.2) | 4 (4.0) | 26 (20.8) | 16 (12.8) | ||
| Group 2 (MMG+, USG-), 20 (16.0) | 11 (8.7) | 9 (7.1) | 7 (5.6) | 13 (10.4) | ||
| Positive microcalcifications; 63(50.4) | ||||||
| Group 3 (MMG+, USG+); 63 (50.4) | 21 (16.7) | 42 (33.3) | 11 (8.8) | 52 (41.6) | ||
| Positive microcalcifications (group 3); 63 (100) | 21 (33.3) | 42 (65.6) | 0.195 | 11 (17.5) | 52 (82.5) | 0.536 |
| Calcifications in a mass; 24 (38.1) | 10 (15.9) | 14 (22.2) | 5 (7.9) | 19 (30.2) | ||
| Calcifications outside a mass; 34 (54.0) | 11 (17.5) | 23 (36.5) | 6 (9.5) | 28 (44.4) | ||
| Intraductal calcifications; 5 (7.9) | 0 (0.0) | 5 (7.9) | 0 (0.0) | 5 (7.9) | ||
Abbreviations: MMG-, mammography-negative microcalcifications; MMG+, mammography-positive microcalcifications; USG-, ultrasonography-negative microcalcifications; USG+, ultrasonography-positive microcalcifications.
a Values are expressed as No. (%).
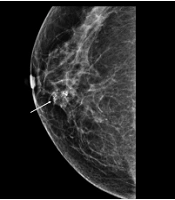
A, Positive microcalcifications with high-risk histological and biological markers. The mammographic (MMG) image shows grouped, coarse heterogeneous microcalcifications in the lower inner quadrant of the right breast (arrow); B, The ultrasonography (USG) image shows echogenic microcalcifications, which can be classified as group 3 mammographic (MMG) findings. Calcification outside the mass was the most common USG finding based on the breast imaging-reporting and data system (BI-RADS) (arrow). Pathology revealed poor prognostic factors, a high nuclear grade, comedo necrosis, negative ER group, positive HER2 group, and a high Ki-67 index (≥ 20%).
A, Negative microcalcifications with low-risk histological and biological markers. The mammographic (MMG) image shows a heterogeneously dense breast parenchymal composition with negative findings; B, The ultrasonography (USG) finding is classified as group 1. The USG image shows an irregular, indistinct, hypoechoic mass in the right breast without microcalcifications (arrow). The pathology report revealed a low nuclear grade without comedo necrosis, positive HER2 group, and negative HER2 group, with a low Ki-67 index ( < 10%).
| USG; 125 (100) | ER group; 125 (100) | P | HER2 group; 125 (100) | P | Triple negative group; 125 (100) | P | Ki-67 index; 120 (100) | P | |||||
|---|---|---|---|---|---|---|---|---|---|---|---|---|---|
| Negative; 69 (55.2) | Positive; 56 (44.8) | Negative; 61 (48.8) | Positive; 64 (51.2) | Negative; 121 (96.8) | Positive; 4 (3.2) | ≤ 5%; 25 (20.8) | 6 - 19%; 53 (44.2) | ≥ 20%; 42 (35.0) | |||||
| Negative microcalcifications; 62 (49.6) | 29 (23.2) | 33 (26.2) | 0.060 | 37 (29.4) | 25 (20.00) | 0.006 | 59 (47.2) | 3 (2.4) | 0.192 | 16 (13.4) | 32 (26.7) | 10 (8.3) | 0.001 |
| Group 1 (MMG-, USG-); 42 (33.6) | 17 (13.6) | 25 (20.0) | 29 (23.2) | 13 (10.4) | 39 (31.2) | 3 (2.4) | 11 (9.2) | 24 (20.0) | 4 (3.3) | ||||
| Group 2 (MMG+, USG-); 20 (16.0) | 12 (9.6) | 8 (6.4) | 8 (6.4) | 12 (9.6) | 20 (16.0) | 0 (0.0) | 5 (4.2) | 8 (6.7) | 6 (5.0) | ||||
| Positive microcalcifications | |||||||||||||
| Group 3 (MMG+, USG+); 63 (50.4) | 40 (32.0) | 23 (18,4) | 24 (19.2) | 39 (31.2) | 62 (49.6) | 1 (0.8) | 9 (7.5) | 21 (17.5) | 32 (26.7) | ||||
| Positive microcalcifications; 63 (100) | 40 (63.5) | 23 (36.5) | 0.017 | 24 (38.1) | 39 (61.9) | 0.008 | 62 (98.4) | 1 (1.6) | 0.438 | 9 (14.5) | 21 (33.9) | 32 (50.8) | 0.550 |
| Calcifications in a mass; 24 (38.1) | 11 (17.5) | 13 (20.6) | 14 (22.2) | 10 (15.9) | 23 (36.5) | 1 (1.6) | 3 (4.8 | 9 (14.5) | 11 (17.7) | ||||
| Calcifications outside a mass; 34 (54.0) | 27 (42.9) | 7 (11.1) | 7 (11.1) | 27 (42.9) | 34 (54.0) | 0 (0.0) | 6 (9.7) | 9 (14.5) | 19 (30.6) | ||||
| Intraductal calcifications; 5 (7.9) | 2 (3.2) | 3 (4.8) | 3 (4.8) | 2 (3.2) | 5 (7.9) | 0 (0.0) | 0 (0.0) | 3 (4.8) | 2 (3) | ||||
Abbreviations: MMG-, mammography-negative microcalcifications; MMG+, mammography-positive microcalcifications, USG-, ultrasonography-negative microcalcifications, USG+, ultrasonography-positive microcalcifications; ER, estrogen receptor; HER2, epidermal growth factor receptor 2.
a Values are expressed as No. (%).
b The available number of Ki-67 index was n = 120.
5. Discussion
Based on the present results, microcalcifications detected on MMG and USG were correlated with the histological features and subtypes, based on the immunohistochemical findings. In this study, 66.4% of DCIS lesions were seen as microcalcifications on MMG, which is comparable to previous studies (5, 6, 29). Pure DCIS with a high nuclear grade and comedo necrosis was significantly associated with fine linear branching, pleomorphic, and coarse heterogeneous morphologies of microcalcifications, besides the larger size of DCIS lesion on MMG (10). In the present study, visible microcalcifications on MMG were significantly associated with a high nuclear grade and comedo necrosis, which is consistent with previous studies.
Bae et al. (3) reported that HER2 levels were positively correlated with the probability of malignancy on MMG, whereas the ER status was negatively correlated with the probability of malignancy on MMG. HER2-positive DCIS commonly showed linear branching or segmental microcalcifications, while ER-positive DCIS commonly showed clustered microcalcifications. The present results showed that visible microcalcifications on MMG were significantly associated with ER negative group and HER2 positive group in DCIS. However, the morphology and distribution of microcalcifications were not significantly different between MMG and immunohistochemistry. The discrepancy between the findings may be attributed to differences in patient selection, as the mentioned study (3) included DCIS cases with only calcifications on MMG, whereas our study included all DCIS cases with visible or invisible microcalcifications.
In another study, DCIS with microinvasion was associated with a significantly higher Ki-67 index and HER2 expression and correlated with microcalcifications on USG (30). The Ki-67 index was not correlated with the MMG findings of malignancy, whereas a higher Ki-67 index (≥ 5%) was more frequent in HER2-positive DCIS (3). In the present study, positive microcalcifications on MMG were significantly associated with a high Ki-67 index (≥ 20%). Although masses are the most common USG findings of DCIS, USG can identify 23 to 45% of calcifications found on MMG (7, 8, 31). In this study, USG showed calcifications in 50.4% of cases. The USG findings of calcifications, distortions, and ductal changes were more significantly associated with a high nuclear grade and comedo necrosis in DCIS (32, 33).
It seems that USG can indicate calcifications more frequently in cases of high-grade DCIS, calcified DCIS (on MMG), and DCIS with comedo necrosis (32). The USG microcalcifications were associated with non-mass lesions, which were in turn correlated with poor prognostic factors, such as a high nuclear grade, comedo necrosis, HER2 positivity, and an increased Ki-67 index (34). The present results showed that visible microcalcifications on USG were associated with a high nuclear grade, comedo necrosis, HER2 positive group, and increased Ki 67 index, these findings are in line with the finding of previous study (32-34).
The present study had some limitations. First, the data were analyzed retrospectively. Second, the sample size was relatively small; the number of samples for each imaging feature was especially small, which might have affected the statistical significance of data. Third, this study focused on pure DCIS showing microcalcificaions on MMG and USG, while other features of DCIS on MMG and USG were not compared with the pathological features. Finally, MMC microcalcifications were not evaluated using marker or specimen MMG to determine their correlations with microcalcifications on USG or pathology reports. Therefore, further studies with a prospective design are needed with a large sample size.
In conclusion, DCIS mirocalcifications on MMG and USG were correlated with the pathological and immunochemistrical prognostic factors. Microcalcifications detected via imaging were significantly associated with poor prognostic pathological factors such as high nuclear grade and comedo necrosis, as well as poor prognostic biological factors including ER negative group, HER2 positive groups and high Ki-67 index.


