1. Background
Cervical lymphadenopathy is a common clinical finding, which can potentially indicate the presence of an unknown origin malignancy (1, 2). Identification of malignancy in cervical lymph nodes, whether as a primary or secondary origin of cancer, plays a crucial role in determining the prognosis and guiding the treatment approach (3, 4). Different paraclinical diagnostic methods have been proposed for assessing the malignant nature of lymphadenopathy. In cervical lymphadenopathy, history-taking and fine-needle aspiration (FNA) are the primary diagnostic procedures, while histopathology is the gold standard (5). The accuracy of FNA depends on different variables, such as the physician’s skills and ultrasound guidance. In some cases, the presence of several suspicious lymph nodes limits the application of FNA (6, 7). Also, in some cases, when a lymph node is not easily accessible, non-aggressive or minimally invasive methods are often required for diagnosis.
A range of sensitivity and specificity values have been reported for ultrasound in the literature (8). The computed tomography (CT) scan is reported to have higher accuracy than ultrasound and is often utilized in the staging of tumors. However, metastasis in normal-sized lymph nodes can be missed, and reactive lymph node enlargement cannot be reliably differentiated from metastatic involvement (9). Meanwhile, although positron emission tomography (PET) scan can provide useful information, it is expensive and may not be available (10). While conventional magnetic resonance imaging (MRI) is another practical method, its performance in assessing lymph node metastases, especially in small lymph nodes, is limited when considering morphological characteristics, such as size, shape, margin, and homogeneity of the lymph node (11, 12).
In recent years, dynamic contrast-enhanced MRI (DCE-MRI) has been considered for differentiating malignant from benign tumors. In this approach, the absorption and excretion of a contrast medium, as reflected in a time-signal intensity curve (TIC), can provide valuable criteria for distinguishing between malignant and benign conditions (13-16). There is limited data available on the role of DCE-MRI in distinguishing malignant from benign lymph nodes. However, it has been suggested that DCE-MRI could potentially enhance the accuracy of MRI in detecting malignant lymph nodes (17-19).
2. Objectives
The current study aimed to examine the specificity and sensitivity of DCE-MRI based on some TIC parameters compared to histopathology in diagnosing malignant cervical lymph nodes.
3. Patients and Methods
3.1. Patients
This case-control study was conducted in a tertiary referral hospital in 2019 after receiving the Ethics Committee approval and collecting informed consent from the patients. Patients with neck bulging and a sonographic diagnosis of lymphadenopathy, who were candidates for excisional biopsy or cervical lymph node dissection, were enrolled in this study. On the other hand, patients with a high clinical suspicion for infectious lymphadenopathies, such as painful lymph nodes and infectious diseases (e.g., pharyngitis and tuberculosis), patients with a recent history of head and neck surgery or radiotherapy, and patients with contraindications for MRI or gadolinium infusion, were excluded from the study.
3.2. Dynamic Contrast-Enhanced MRI
A maximum of one week prior to tissue sampling, patients who were candidates for lymph node excision underwent DCE-MRI examinations. Imaging was performed using a 3T GE 750w superconductive magnet scanner (GE Healthcare, Waukesha, WI, USA). The patients were required to fast for two hours and ensure proper hydration before the imaging procedure. Once the patient was positioned on the magnet, their head and neck were secured using 8-channel head and cervical coils. Axial T1-weighted images, as well as non-fat saturated and fat-saturated T2-weighted images, were acquired, according to defined standards prior to the infusion of the contrast medium. Next, a bolus gadolinium dose (0.1 mg/kg, 2.5 mL/s) and 20 mL of normal saline were infused consecutively through the antecubital vein, followed by dynamic scanning. The scanning continued immediately after the contrast medium infusion every 15 seconds up to 10 minutes after normal saline infusion.
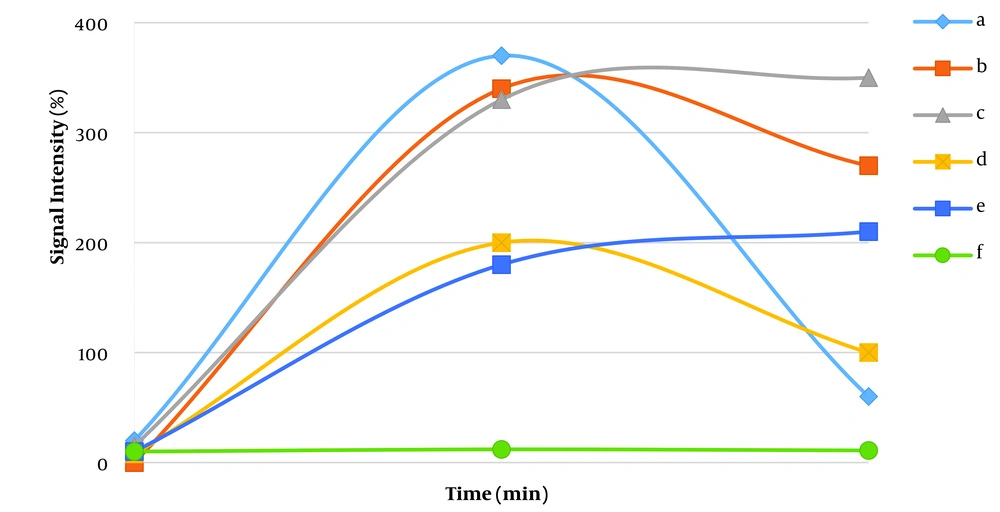
Axial sections with the largest lymph node size were used for examinations. Lymph nodes with a minimum short axis diameter (SAD) of 10 mm were examined. The region of interest (ROI) with maximum dimensions of 5 × 5 mm was drawn at different parts of the selected axial section. Cystic, necrotic, or hemorrhagic areas were not included. Among the ROIs in each lymph node, TIC with the highest degree of enhancement was selected and analyzed by an expert head and neck radiologist. The TICs were divided into the following types (Figure 1) (13, 20-22): (a) Fast enhancement/fast washout, (b) fast enhancement/slow washout, (c) fast enhancement/no washout, (d) slow enhancement with washout, (e) gradual enhancement/no washout, and (f) plateau (no enhancement).
In the TIC, the X-axis represents time, while the Y-axis represents the ratio of signal intensity after the contrast medium infusion to the intensity before the infusion. The studied TIC parameters were as follows (13, 20):
• Signal intensity (SI%) at 45 seconds, 90 seconds, 120 seconds, 5 minutes, and 10 minutes.
• SImax%: It is the maximum SI ratio during the 10-minute period.
• Tmax: It is the time corresponding to the SImax.
• SI peak: It is the first signal intensity that holds in [SI > 0.9 (SImax – SIpre) + SIpre].
• T peak: It is the time corresponding to the SI peak.
• Enhancement slope (ES): It is calculated as [SIpeak – SIpre/SIpre × (Tpeak – Tpre)].
• Washout slope at 5 and 10 minutes (WS-5 min and WS-10 min): It refers to the signal intensity losing slope at 5 and 10 minutes after the contrast medium infusion according to the following formula: [SIpeak – SI-5 or 10 min/SI-5 or 10 min × (5 or 10 min – Tpeak)].
• Washout ratio: It refers to the losing SI ratio at 5 and 10 minutes after the contrast medium infusion according to the following formula: [SImax - SI 5 or 10 min/SImax – SIpre]. The SIpre is the signal intensity in TIC before the contrast medium infusion.
The anatomic position of lymph nodes was examined and arranged by an expert surgeon before excisional biopsy. An expert pathologist, who was not involved in the study, examined the lymph nodes using hematoxylin and eosin (H&E) staining and provided the potential histopathology reports. The lymph nodes were classified into malignant and benign groups based on the pathologist’s report and were compared in terms of the TIC parameters. Malignant cases were considered as the case group and benign cases were considered as the control group.
3.3. Statistical Analysis
Statistical analyses were performed in SPSS Version 18 (SPSS Inc., Released in 2009, PASW statistics for windows, SPSS Inc., Chicago, USA). Descriptive statistics are expressed as mean ± standard deviation (SD) for continuous variables and as number and percentage for categorical variables. Comparison of categorical variables in different groups was performed using chi-square test. For continuous variables, comparisons between the groups were performed after examining the normal distribution of data using Kolmogorov-Smirnov test. If the data showed a normal distribution, t-test was used; otherwise, Mann-Whitney U test was conducted. The diagnostic efficacy of continuous variables for distinguishing between malignant and benign lymph nodes was evaluated using the receiver operating characteristic (ROC) curve analysis. The area under the ROC curve (AUC) was also calculated to measure the accuracy of the test. For variables with statistically significant AUCs, the best cutoff points were calculated according to the Youden’s index, and then, the diagnostic indices and 95% confidence intervals (CIs) were calculated for these cutoff points.
4. Results
Sixty-three patients with suspicious lymph nodes were examined in this study. Overall, 75% of the patients were male, while the rest were female. The mean age of the patients was 51.3 ± 15 years (range, 14 - 71 years). Out of the 63 specimens examined, 31 (49.2%) were identified as benign lymph nodes, while the remaining were classified as malignant. The mean age of patients with malignant and benign lesions was 59.3 ± 8.9 and 36.3 ± 12.4 years, respectively (P < 0.001). Table 1 presents the different pathologies of malignant lymph nodes. Metastatic adenocarcinoma and laryngeal squamous cell carcinoma (SCC) were the most prevalent types of malignancy in this study.
| Diagnosis | No. (%) |
|---|---|
| Benign | 31 (49.2) |
| Malignant | |
| Metastatic adenocarcinoma | 12 (19) |
| Laryngeal squamous cell carcinomas | 7 (11.1) |
| Papillary thyroid carcinoma | 6 (9.5) |
| Lymphoma | 4 (6.4) |
| Parotid cancers | 3 (4.8) |
| Total | 63 (100) |
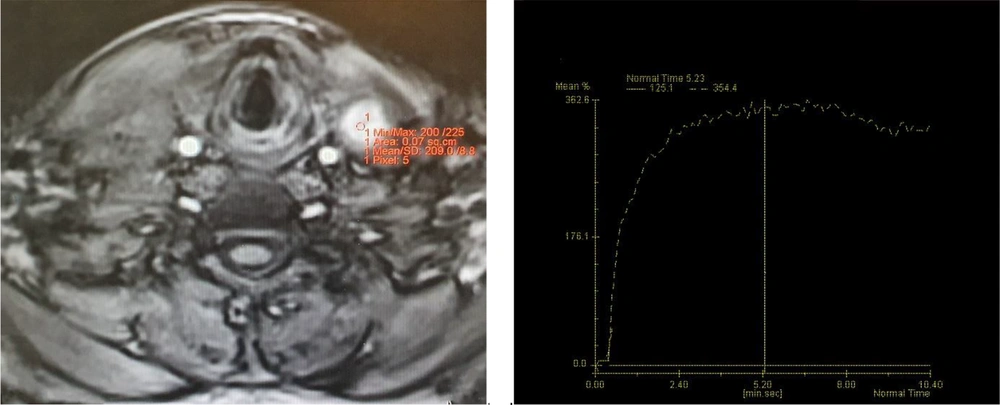
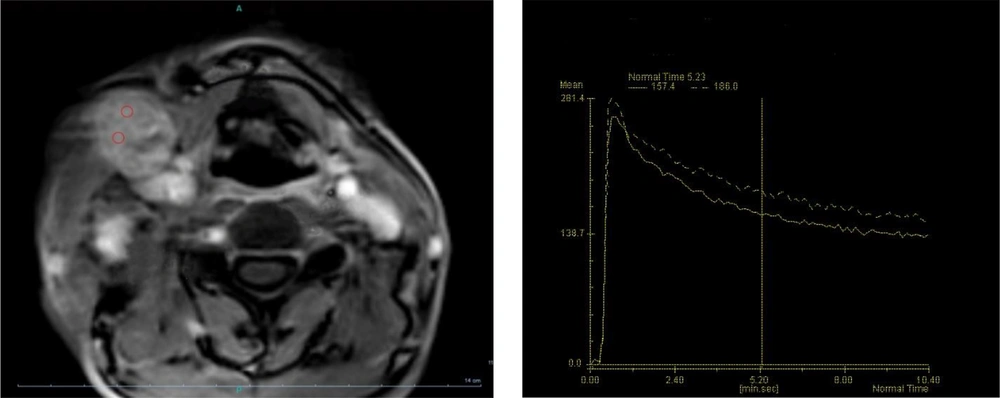
The T2 heterogeneity was not significantly different between benign and malignant lymph nodes (58.8% in benign lymph nodes vs. 75% in malignant lymph nodes; P = 0.24). Necrotic areas were only observed in 25% of malignant lymph nodes (P = 0.038). Based on the classification of contrast medium absorption and excretion patterns in TIC, all lymph nodes absorbed the contrast medium (patterns a - e). In the benign lymph nodes, the most common TIC pattern was fast enhancement/slow washout, which was observed in 14 lymph nodes (45.2%), followed by the fast enhancement/no washout pattern (25.8%). Among malignant lymph nodes, the two most common patterns were fast enhancement/no washout (Figure 2) and slow enhancement with washout, which were detected in 15 (46.9%) and 9 (28.1%) lymph nodes, respectively. Figure 3 presents type-b TIC in two distinct sections of metastatic lymphadenopathy associated with papillary thyroid carcinoma (PTC). The distribution of TIC enhancement patterns showed significant differences between malignant and benign lymph nodes (P = 0.043) (Table 2).
| Patterns | Benign, No. (%) | Malignant, No. (%) | Total, No. (%) | P-value |
|---|---|---|---|---|
| Fast enhancement/fast washout | 4 (12.9) | 1 (3.1) | 5 (8) | 0.043 |
| Fast enhancement/slow washout | 14 (45.2) | 7 (21.9) | 21 (33.3) | |
| Fast enhancement/no washout | 8 (25.8) | 15 (46.9) | 23 (36.5) | |
| Slow enhancement with washout | 4 (12.9) | 9 (28.1) | 13 (20.6) | |
| Gradual enhancement | 1 (3.2) | 0 (0) | 1 (1.6) | |
| Total | 31 (100) | 32 (100) | 63 (100) |
The mean values of all continuous variables were compared between malignant and benign lymph nodes. The mean SAD was measured to be 15.1 ± 6.9 (4 - 34). It was not significantly different between malignant and benign lymph nodes (P = 0.75). The average value of the minimum/maximum diameter was 0.70 ± 0.18 (range, 0.40 - 1). This parameter did not exhibit a significant difference between malignant and benign lymph nodes (P = 0.31) (Table 3).
| Study variables | Benign, Mean ± SD | Malignant, Mean ± SD | P-value |
|---|---|---|---|
| Min/max diameter | 0.67 ± 0.19 | 0.72 ± 0.18 | 0.31 |
| T2 heterogenicity | 1.41 ± 0.51 | 1.25 ± 0.44 | 0.25 |
| Max. time | 159.74 ± 152.07 | 189.78 ± 116.26 | 0.38 |
| Max. enhancement | 270.74 ± 130.74 | 258.13 ± 101.61 | 0.67 |
| Peak time | 95.52 ± 101.47 | 100.66 ± 59.92 | 0.15 |
| Peak enhancement | 251.32 ± 134.12 | 232.94 ± 92.86 | 0.53 |
| SI-45 sec | 182.91 ± 137.19 | 139.47 ± 127.17 | 0.20 |
| SI-90 sec | 222.29 ± 117.44 | 205.38 ± 90.81 | 0.52 |
| SI-120 sec | 220.00 ± 115.49 | 223.59 ± 89.31 | 0.89 |
| SI-5 min | 124.39 ± 145.01 | 219.19 ± 93.85 | 0.003 |
| SI-10 min | 109.87 ± 134.65 | 188.94 ± 83.70 | 0.001 |
| ES | 4.99 ± 4.38 | 3.49 ± 2.69 | 0.10 |
| WR-45 sec | 0.37 ± 0.35 | 0.45 ± 0.59 | 0.23 |
| WR-90 sec | 0.20 ± 0.14 | 0.20 ± 0.17 | 0.96 |
| WR-120 sec | 0.20 ± 0.11 | 0.13 ± 0.12 | 0.028 |
| WR-5 min | 0.58 ± 0.38 | 0.15 ± 0.13 | < 0.001 |
| WR-10 min | 0.63 ± 0.36 | 0.26 ± 0.17 | < 0.001 |
| WS-5 min | 0.93 ± 1.20 | 0.49 ± 1.77 | 0.25 |
| WS-10 min | 0.35 ± 0.19 | 0.16 ± 0.13 | < 0.001 |
Abbreviations: SI, signal intensity; WR, washout ratio; WS, washout slope; ES, enhancement slope.
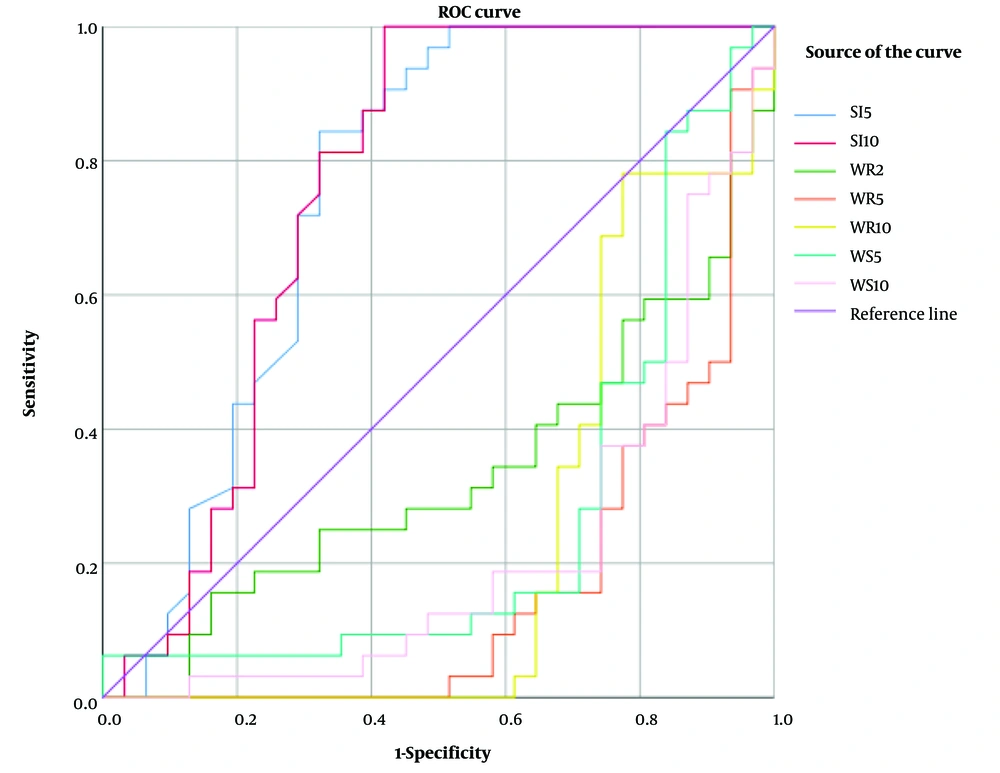
The mean values of SI-5 min, SI-10 min, WR-120 sec, WR-5 min, WR-10 min, and WS-10 min were significantly different between malignant and benign lymph nodes (P < 0.03). Additionally, the diagnostic accuracy of all continuous variables for differentiating malignant from benign lymph nodes was assessed based on the ROC curve analysis. Among all variables, SI-5 min, SI-10 min, WR-2 min, WR-5 min, WR-10 min, WS-5 min, and WS-10 min showed significant AUCs in diagnosing malignant lymph nodes (P < 0.05 for all) (Table 4) (Figure 4). Among the variables studied, the best predictor was WR-5 min, which showed an AUC of 0.16 (P < 0.001). At its selected cutoff point, the sensitivity, specificity, positive predictive value, and negative predictive value were 0.84, 0.74, 0.77, and 0.82, respectively. Based on the best cutoff points for these variables, the diagnostic accuracy indices were calculated, which are presented in Table 4.
| Variables (cutoff point) | AUC [95% CI] | Sensitivity [95% CI] | Specificity [95% CI] | PPV [95% CI] | NPV [95% CI] | PLR [95% CI] | NLR [95% CI] | P-value |
|---|---|---|---|---|---|---|---|---|
| SI-5 min (≥ 140) | 0.75 [0.62 - 0.88] | 0.84 [0.67 - 0.95] | 0.68 [0.49 - 0.83] | 0.73 [0.56 - 0.86] | 0.81 [0.61 - 0.93] | 2.6 [1.5 - 4.5] | 4.3 [1.9 - 10.1] | 0.001 |
| SI-10 min (≥ 70) | 0.76 [0.63 - 0.89] | 1 [0.89 - 1] | 0.58 [0.39 - 0.75] | 0.71 [0.56 - 0.84] | 1 [0.81 - 1] | 2.4 [1.6 - 3.6] | - | 0.001 |
| WR-2 min (≤ 0.605) | 0.33 [0.20 - 0.47] | 0.59 [0.41 - 0.76] | 0.1 [0.02 - 0.26] | 0.40 [0.26 - 0.56] | 0.19 [0.04 - 0.46] | 0.66 [0.48 - 0.90] | 0.24 [0.08 - 0.76] | 0.021 |
| WR-5 min (≤ 0.26) | 0.16 [0.06 - 0.27] | 0.84 [0.67 - 0.95] | 0.74 [0.55 - 0.88] | 0.77 [0.60 - 0.90] | 0.82 [0.63 - 0.94] | 3.3 [1.8 - 6.0] | 4.7 [2.1 - 10.9] | < 0.001 |
| WR-10 min (≤ 0.50) | 0.23 [0.11 - 0.36] | 0.97 [0.84 - 0.99] | 0.65 [0.45 - 0.81] | 0.74 [0.58 - 0.86] | 0.95 [0.76 - 0.99] | 2.7 [1.7 - 4.4] | 20.6 [2.9 - 144.6] | < 0.001 |
| WS-5 min (≤ 0.4) | 0.27 [0.13 - 0.40] | 0.84 [0.67 - 0.95] | 0.71 [0.52 - 0.86] | 0.75 [0.58 - 0.88] | 0.81 [0.62 - 0.94] | 2.9 [1.6 - 5.1] | 4.5 [2 - 10.5] | 0.0021 |
| WS-10 min (≤ 0.233) | 0.22 [0.10 - 0.33] | 0.81 [0.64 - 0.93] | 0.74 [0.55 - 0.88] | 0.76 [0.59 - 0.89] | 0.79 [0.60 - 0.92] | 3.1 [1.7 - 5.9] | 4.0 [1.9 - 8.4] | < 0.001 |
Abbreviations: SI, signal intensity; WR, washout ratio; WS, washout slope; AUC, area under the curve; PPV, positive predictive value; NPV, negative predictive value; PLR, positive likelihood ratio; NLR, negative likelihood ratio; CI, confidence interval.
5. Discussion
This study aimed to investigate the diagnostic potential of certain TIC parameters derived from DCE-MRI in evaluating cervical lymph nodes suspected of malignancy and to compare them against histopathology, which is considered the gold standard in diagnosis. The findings revealed that the washout ratio at 5 minutes can be considered sensitive or specific for determining malignant cervical lymph nodes.
A few studies have been published on the diagnostic role of TIC parameters in differentiating malignant cervical lymph nodes. In a study by Fischbein et al., 21 patients with head and neck SCC, without treatment, were examined by histopathology and DCE-MRI. Their findings indicated that malignant lymph nodes exhibited a significantly longer peak enhancement time and lower values for peak enhancement, maximum enhancement slope, and washout ratio compared to benign lymph nodes (18). In our study, we observed similar findings. However, significant differences were only noted in some parameters, as shown in Table 3.
In another study, Noworolski et al. examined 68 lymph nodes of 21 patients with head and neck SCC. In the TIC analysis, the peak time enhancement was found to be higher in the malignant group compared to the benign group. Conversely, the maximum slope, washout slope, and peak enhancement were lower in the malignant group than in the benign group. In their study, malignant and benign nodes had slow enhancement/slow washout and fast enhancement/slow washout patterns, respectively, which are almost similar to the findings of the current study. Also, the enhancement intensity was lower in the malignant group (19), which is consistent with the pattern generally observed in the current study.
The current study involved a comparative analysis of various types of malignancies (not limited to SCC) and benign conditions. Upon further examination, the WR-5 min, WR-10 min, and WS-10 min of laryngeal SCC were significantly lower in comparison to the benign group, which is consistent with the results of studies conducted by Fischbein et al. and Noworolski et al. (18, 19). Contrary to the aforementioned results, Cintra et al. found that malignant nodes, encompassing a variety of recognized pathologies, demonstrated quicker and superior enhancement. Interestingly, there was no significant difference in the intensity of washout or the TIC area when compared to the benign group (23). However, they did not provide a detailed definition of the TIC variables under study, nor did they elaborate on the specifics of the imaging process, such as the timing post contrast medium infusion.
While the behavior of tumor cells can exhibit a spectrum of absorption and excretion rates for the contrast medium, both enhancement and washout intensity are typically lower in malignant cases. Furthermore, tumor cells tend to remain enhanced for a longer duration compared to benign cells (18, 19, 22, 24). In this regard, Oomori et al. studied 17 cervical lymph nodes of 10 patients with oral SCC and found that fast enhancement/fast washout was the predominant pattern for benign lymph nodes, while fast enhancement/fast washout, fast enhancement/slow washout, and gradual enhancement were the predominant patterns in malignant lymph nodes, respectively (22); nevertheless, these findings contradict the results of our study.
In conclusion, the present study showed that the washout ratio at 5 minutes after the contrast medium infusion can be considered a sensitive or a highly specific TIC index to identify malignant lymph nodes. The small sample size was the limitation of the current study; therefore, further studies with a larger sample size are required to reach a more definitive conclusion.


