


1. Background
According to the International Agency for Research on Cancer (IARC), breast cancer is the most prevalent cancer and the fifth cause of mortality among Iranian women. Screening enables diagnosis in earlier stages and improves the treatment success rate (1). Although the use of breast X-rays dates back to 1913, mammography in its current form and purpose was established in the late 1950’s. Since the 1970’s, mammography has transformed into a screening tool (2). Over time, novel devices and techniques, such as tomosynthesis, have improved the functionality of mammography. Although breast magnetic resonance imaging (MRI) is highly sensitive, it is not a major screening tool due to its high cost and inaccessibility. MRI is especially recommended to screen women with an increased risk of breast cancer. Breast ultrasound is an operator-dependent modality, which can significantly increase the recall rates, as well as the need for further interventions, especially biopsy, without increasing the cancer detection rate (3, 4).
The American Cancer Society (ACS) has established the majority of screening guidelines. In screening programs, mammography should be accessible to women aged 40 - 44 years. Annual mammography is recommended to women aged 45 - 54 years. Women aged 55 years and older can switch to a mammogram every two year or they can choose to continue annually. Screening should continue as long as a woman is in good health and is expected to live at least 10 more years (5). The Iranian Non-Communicable Disease Control Department has provided Iranian guidelines, which are similar to those of the ACS. Generally, screening is opportunistic in Iran, and people are not covered by a comprehensive registry system.
2. Objectives
This study aimed to evaluate the accuracy of breast cancer screening via mammography without interfering in the screening process, while considering the current participation rate of opportunistic screening in Iran.
3. Patients and Methods
3.1. Study Sample and Setting
This observational study evaluated the accuracy of breast cancer screening based on mammography. It was performed at the Cancer Institute of Imam Khomeini Hospital Complex in Tehran, Iran, which is the largest university hospital in Iran and a major facility for breast imaging services. The patients belonged to different socioeconomic classes. The sample size was calculated to be 450 (final sample size, 491), based on the formula for sensitivity and specificity (6). The inclusion criteria were women undergoing screening mammography, with an available and proper follow-up according to the American College of Radiology (ACR) breast imaging-reporting and data system (BI-RADS) classification. The follow-up required for each BI-RADS category is explained in the tools and follow-up section (7). Diagnostic and additional studies were not included in this study. Also, patients with signs or symptoms suggesting disease were excluded.
Since this is a diagnostic test study, and the referral rate does not have a specific weekly or seasonal pattern, individuals entered the study continuously from April 2016 in order of attendance. This study was conducted during 2019 - 2020, two recommended screening intervals after primary screening. Screening was evaluated in the follow-ups; the time gap between the primary screening and the study date increased the number of patients undergoing another screening. All these data were collected from the patients’ records.
3.2. Tools and Follow-up
Bilateral or unilateral mammography reports were evaluated from two views, that is, craniocaudal and mediolateral views. The device was a full-field digital mammography system (Selenia Dimensions, Hologic Inc., USA). According to the BI-RADS categories, the patients were divided into positive and negative groups. Categories 1 (negative findings) and 2 (benign findings) indicated negative screening. Negative cases were followed-up in subsequent screenings at least once and at least one year after the primary screening. If the result of secondary screening was also negative, they were considered true negative due to stability over time. On the other hand, cases of BI-RADS categories 4 (suspicious findings) and 5 (highly suspicious findings) were considered positive. In cases of positive screening, pathology confirmed the diagnosis. Cases with positive screening and pathology results for malignancy were considered true positive. The BI-RADS category 0 in reports indicated the need for additional studies (other modalities and views), and the screening status was determined in further evaluations. Cases of BI-RADS category 3 (possibly benign) had short-term follow-ups, including six months and one year after the primary screening. In the follow-up studies, cases were allocated to the positive group when higher categories were reported. For a case to be considered negative, they should not have a positive mammogram for at least two years. Cases with an initial BI-RADS category 0 or 3 were allocated to the positive or negative screening group, based on additional studies described above, and their disease status was determined based on their group. The patients were divided into groups according to age, family history, history of intervention, and breast density. Sensitivity and specificity were also compared between the groups.
3.3. Statistical Analysis
The patients’ age, family history, and history of interventions, as well as the BI-RADS categories and breast density, were extracted from their records. None of these variables had a normal distribution based on Kolmogorov-Smirnov normality test. Non-parametric tests were used for data without a normal distribution. Finally, the test accuracy indices (sensitivity and specificity) were calculated using a matrix of screening results and disease status. Accuracy, negative predictive value (NPV), and positive predictive value (PPV) were also calculated using frequencies and indices measured in the study. SPSS for Windows Version 24.0 (IBM Corp. Released 2016. IBM SPSS Statistics for Windows, Version 24.0. Armonk, NY: IBM Corp.) and MedCalc Version 20.027 (MedCalc Software., Ostend, Belgium) were used for data analysis. Moreover, a subgroup analysis was carried out using Mann-Whitney test, Kruskal-Wallis test. Additionally, Spearman’s correlation coefficient test was performed to evaluate correlations. The significance level was set at 0.05.
3.4. Ethical Considerations
No participants were involved in the implementation of this study. The patients’ records were used anonymously according to their consent. The ethics committee reviewed and approved the study (IR.TUMS.IKHC.REC.1397.328, available on: ethics.research.ac.ir/EthicsProposalViewEn.php?id=52181).
4. Results
4.1. Patients Characteristics
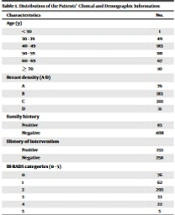
A total of 491 patients were enrolled in this study (Figure 1). The patients’ age ranged from 29 to 84 years, with a mean ± standard deviation (SD) of 50.56 ± 8.52 years. The median and mode for age were 50.00 and 47 years, respectively. The distribution of the patients’ demographic and clinical information is presented in Table 1.

The process of patient entry and follow up
| Characteristics | No. |
|---|---|
| Age (y) | |
| < 30 | 1 |
| 30 - 39 | 49 |
| 40 - 49 | 183 |
| 50 - 59 | 181 |
| 60 - 69 | 67 |
| ≥ 70 | 10 |
| Breast density (A-D) | |
| A | 76 |
| B | 183 |
| C | 201 |
| D | 31 |
| Family history | |
| Positive | 83 |
| Negative | 408 |
| History of intervention | |
| Positive | 233 |
| Negative | 258 |
| BI-RADS categories (0 - 5) | |
| 0 | 76 |
| 1 | 62 |
| 2 | 293 |
| 3 | 33 |
| 4 | 22 |
| 5 | 5 |
Abbreviation: BIRADS, breast imaging-reporting and data system.
4.2. Diagnostic Test Accuracy Indices
Table 2 indicates the cross-tabulation of disease status based on the gold standard versus screening mammography. The test accuracy indices are shown in Table 3. The receiver operating characteristic (ROC) curve was drawn by assuming screening as the index test and disease status as the reference test. The area under the curve (AUC) was 0.837, with a 95% confidence interval of 0.735 - 0.94 (P < 0.001).
| Disease status | |||
|---|---|---|---|
| No cancer | Cancer | Total | |
| Screening status | |||
| Negative | 439 | 7 | 446 |
| Positive | 26 | 19 | 45 |
| Total | 465 | 26 | 491 |
| Test indices | Values (95% CI) |
|---|---|
| Sensitivity | 73.08% (55.21 - 88.43) |
| Specificity | 94.41% (91.91 - 96.32) |
| Accuracy | 93.28% (90.69 - 95.33) |
| Negative predictive value (NPV) | 98.43% (97.08 - 99.16) |
| Positive predictive value (PPV) | 42.22% (31.99 - 53.16) |
Abbreviation: CI, confidence interval.
4.3. Correlation Analysis
Considering the distribution of data based on Spearman’s correlation test, the correlations between age, BI-RADS category, and breast density were measured. The correlation between age and the BI-RADS category was positive (coefficient = 0.101, P = 0.025). On the other hand, there was an inverse correlation between age and density (coefficient = -0.263, P < 0.001). However, there was no significant correlation between the BI-RADS category and breast density (P = 0.562).
4.4. Subgroup Analysis
For the age subgroups, the patients were first divided into six groups with a 10-year gap and then into two groups of < 50 years and ≥ 50 years. Sensitivity was higher in the age group of ≥ 50 years, while specificity was higher in the group of < 50 years. Sensitivity and specificity differences were insignificant in both classifications. The test performance indices were also calculated in subgroups based on the family history and breast density. Differences between the groups in general and between any two groups were not significant. Besides, the participants were divided into two groups based on their history of biopsy, lumpectomy, or mastectomy (prior interventions). Sensitivity was higher in the group with a positive history, and specificity was higher in the opposite group; however, the differences were not significant (Table 4).
| Subgroups | Number of samples in contingency | Sensitivity | P-value | Specificity | P-value | |||
|---|---|---|---|---|---|---|---|---|
| S- and D- | S- and D+ | S+ and D- | S+ and D+ | |||||
| Age (two groups) | 0.407 | 0.687 | ||||||
| < 50 | 211 | 4 | 11 | 7 | 63.6% (30.8 - 89.1) | 95.0% (91.3 - 97.5) | ||
| ≥ 50 | 228 | 3 | 15 | 12 | 80.0% (51.9 - 95.7) | 93.8% (90.0 - 96.5) | ||
| Breast density | 0.826 | 0.267 | ||||||
| A | 72 | 1 | 2 | 1 | 50.0% (1.3 - 98.8) | 97.3% (90.6 - 99.7) | ||
| B | 163 | 2 | 13 | 5 | 71.4% (29.0 - 96.3) | 92.6% (87.7 - 96.0) | ||
| C | 175 | 3 | 11 | 12 | 80.0% (51.9 - 95.7) | 94.1% (89.7 - 97.0) | ||
| D | 29 | 1 | 0 | 1 | 50.0% (1.3 - 98.7) | 100.0% (88.1 - 100.0) | ||
| Family history | 0.794 | 0.800 | ||||||
| Positive | 76 | 1 | 4 | 2 | 66.7% (9.4 - 99.2) | 95.0% (87.7 - 98.6) | ||
| Negative | 363 | 6 | 22 | 17 | 73.9% (51.6 - 89.8) | 94.3% (91.5 - 96.4) | ||
| History of intervention | 0.120 | 0.061 | ||||||
| Positive | 218 | 4 | 8 | 3 | 42.9% (9.9 - 81.6) | 96.5% (93.1 - 98.5) | ||
| Negative | 221 | 3 | 18 | 16 | 84.2% (60.4 - 96.6) | 92.5% (88.4 - 95.5) | ||
Abbreviations: S, screening result; D, disease status in the follow-up.
5. Discussion
Screening in Iran is opportunistic, despite the high prevalence of cancer and the availability of screening tools. A relatively small proportion of the Iranian population is encouraged by the media and healthcare providers to participate in screening. However, there is no registry system, and the participation rate cannot be accurately measured. The current study aimed to measure the accuracy of screening regarding the current attendance of patients, without any interventions to increase their attendance. For screening, the test accuracy was assessed according to the patient's status in the follow-ups. The majority of previous studies in Iran have evaluated smaller sample sizes and hospitalized patients. They were based on previous mammography reports, regardless of centers and devices. Compared to these approaches, our method can provide a better estimate of the current status because of the calculated sample size, the process of patient follow-up, and attention to the pattern of patients’ future referrals (8-10).
According to the present study, the sensitivity of breast cancer screening based on mammography was 73.08%, which is lower than the values reported in studies at population level or meta-analyses of crude data. Nonetheless, based on the confidence intervals, the difference was insignificant in some cases (11-15). The PPV was also relatively low; opportunistic screening may be the cause of low sensitivity. Generally, people are not required to attend screening or continue the process at regular intervals. The values are similar to those reported in studies of first time implementation of screening at the population level, as both types of screening need to diagnose prevalent (women who already have cancer, but are unaware of it) and incident (new cases of cancer in a screening interval) cases (16, 17).
It can be interpreted that the sensitivity of a screening test is similar to study power and that a larger study sample is associated with a higher detection power. Also, in a screening test, a higher population coverage resulted in higher sensitivity. Overall, organized screening can detect cancer in earlier stages compared to opportunistic screening, leading to a lower incidence of metastatic breast cancer (17). Another contributing factor is the frequency of referrals. In organized screening, the frequency of referrals is higher, and there are fewer interval cases. Besides, more people with more referrals can be accessed using a registry system; overall, the difference between organized and opportunistic screening may diminish by establishing a registry system.
Strategies for increasing the sensitivity of screening can be divided into three categories. The first category is personalization of screening programs based on the risk factors, such as family history and breast density; MRI is especially recommended for these patients. The second strategy is the use of computer aids, although there are controversies about their advantages. Some studies have reported improved sensitivity and specificity by using this strategy, along with the reduction of operator dependence (18, 19). However, this strategy is not routinely applied and is mainly in the research phase (20). Evidence suggests that it can increase sensitivity to more than 90% (21). In previous research, including a study conducted by Lehman, this strategy had no positive effects and showed reduced sensitivity (11); nevertheless, it is evolving currently similar to any other technology.
Finally, the third solution is double-reading. It has been shown that double-reading can lead to a significant increase in costs, without a proportional improvement in performance (22, 23). Besides, it may be influenced by the radiologist’s characteristics. Overall, factors, such as years of experience in breast imaging, age, and number of annual mammograms, affect the individual performance. In our academic center, mammograms are read by a trainee (a fellow or resident) and then reviewed by a faculty member; the additive effect of double-reading in this center is not probably as significant as readings by two experts. Studies also suggest that this solution may be at the cost of reduced test specificity (22, 24, 25).
In the present study, the test specificity was estimated at 94.41%, which is considered acceptable, even compared to population-level studies. According to previous research, this finding can be attributed to the high number of annual mammograms (about 6000) and the relatively high radiologist experience (15 years on average). Overall, higher specificity can reduce the need for additional interventions and improve the cost-effectiveness of screening. However, it is challenging to increase the sensitivity and detection rate of incidence cases and avoid overdiagnosis (26, 27).
In the current study, breast cancer screening showed an accuracy of 93.28%. Considering the prevalence rate, PPV and NPV were estimated at 42.22% and 98.43%, respectively. The high accuracy indicates the great value of mammography, even in opportunistic screening.
There was no significant difference between the subgroups of breast density. According to previous studies, increased breast density reduces the sensitivity of mammography; on the other hand, ultrasounds can be helpful for these cases. Additionally, breast density is a risk factor for cancer, and breasts with a higher density are three to five times more likely to develop cancer. Incorporating ultrasound into mammography can increase sensitivity and biopsies by 2% to 5%, only 7.4% of which are positive. It seems that incorporation of tomosynthesis into mammography may increase sensitivity in these patients, although there are controversies regarding its cost-effectiveness (28-32).
The highest sensitivity of mammography was found in the two age groups of 50 - 59 and 60 - 69 years, and the highest specificity was reported in the group of 60 - 69 years. However, differences between the groups were not significant. In a meta-analysis by Mushlin et al. investigating pioneer research studies, the sensitivity was higher in the group of ≥ 50 years in five out of six studies (33). Besides, in another study, women aged ≥ 65 years were more likely to benefit from screening mammography (34). In some studies with two age groups, sensitivity was higher in the age group of ≥ 50 years (33). However, in the present study, the difference was not significant. Van-Landeghem et al. attributed the observed difference to the lower indices of initial screening (40 - 49 years) compared to subsequent evaluations, and the difference between subsequent evaluations was not significant (35). In our system, it was not essential to refer women at the onset of screening age, which particularly prevented us from observing the trend.
Additionally, in a study by van Breest Smallenburg et al., screening mammography was less sensitive for people with a history of breast surgery, and it was more likely to find cancer in screening intervals (36). In the present study, sensitivity was higher in the group without a history of breast interventions, although the difference was not significant. Overall, scars and the effects of previous interventions may interfere with the identification of suspicious findings. The results of a study by Corkum et al. showed that the frequency of follow-up and acceptance of cancer screening was higher among patients with a history of cancer (37), which could improve cancer detection. There are several factors other than the frequency of screening associated with cancer diagnosis in people with a history of cancer. There was no significant difference between the groups in terms of family history in this study.
The limitations of this study can be divided into two groups. First, there was no access to the other risk factors in patients, such as the body mass index (BMI). In a study by Elmore et al., overweight women may require a supplementary test. As BMI increases, the specificity of test results decreases, whereas sensitivity does not significantly change (38). Second, in our setting, the patients were not committed to attending screening or continuing screening annually. Lack of follow-up in the absence of a registry system cannot be interpreted as the lack of adherence to screening. Finally, the present study was designed to evaluate the accuracy of screening, and the sample size was calculated accordingly. It is recommended to calculate a separate sample size for comparison of subgroups to increase the study power.
In conclusion, the sensitivity of mammography was lower in our setting, which might be related to opportunistic screening and lack of data documentation. The accuracy of mammography is acceptable as a screening test even in opportunistic setting. Considering the accuracy of screening and its NPV and PPV, besides its affordable cost and insurance coverage, the best decision is to establish a comprehensive screening system and registry. If screening covers the whole population, and a registry system is developed, accuracy indices will improve. Future studies are recommended to investigate the effects of different factors separately.
