1. Background
If patients with pulmonary embolism (PE) are left untreated, the risk of death will drastically increase. However, appropriate and timely treatment can save the life of the majority of these patients (1). Currently, pulmonary computed tomography (CT) angiography (PCTA) plays an important role in diagnosing and managing hemodynamically stable patients with PE (2). Although the patient’s health condition is assumed to be a significant determinant of PE outcomes, early death is significantly attributed to the right ventricular (RV) dysfunction (3).
Various abnormal morphometric parameters in PCTA, such as bowing of the interventricular septum toward the left ventricle, increased right ventricular to left ventricular diameter ratio (RVD/LVD), contrast material reflux into the inferior vena cava (IVC) (4), dilation of the pulmonary trunk (5), and deranged parameters in bolus-tracking time-intensity curve analysis (6) have been proposed as potential indicators of RV compromise; therefore, they may be of prognostic value (7).
Although there are extensive research studies on the application of certain PCTA-derived parameters for risk stratification of patients with acute PE in the literature, the available data remain inconclusive, and further studies are warranted (5). In this study, PCTA was used to examine hemodynamically stable patients with acute PE.
2. Objectives
To evaluate the prognostic value of certain PCTA-derived indicators of RV dysfunction in hemodynamically stable patients with acute PE.
3. Patients and Methods
3.1. Study Design and Population
In this prospective cohort study, a total of 61 adult patients with acute PE, who were referred to our hospital for PCTA, were examined from January 2016 to January 2017. Patients with hemodynamic instability, any interstitial lung diseases, pulmonary hypertension, chronic PE, chronic obstructive pulmonary disease, neoplasms, or chronic cardiac insufficiency were excluded from the study. Written informed consent was obtained from the participants, and the ethics committee of our university approved this study.
3.2. PCTA Imaging Protocol
Contrast-enhanced, non-electrocardiography-gated (non-ECG-gated) PCTA was carried out within two hours of patient admission, using a 64-slice multi-detector CT scanner (discovery 750 HD, GE Healthcare, Milwaukee, USA). The following parameters were applied: Tube voltage, 100 kV per slice; tube charge, 150 - 450 mAs; slice collimation, 0.8 - 1.25 mm; pitch, 0.9; and rotation time, 0.4 seconds. Using a power injector (A250), 10 mL of the contrast medium [Omnipaque-350 755 mg (iodine 350 mg)/mL injection, GE Healthcare, USA] was injected at a rate of 5 mL/s. Next, a 30-mL saline chaser bolus was injected at 5 mL/s. Five seconds later, a series of dynamic, low-dose scans (120 kV, 20 mAs) were performed at the main pulmonary artery level every one second. The patients were asked to breathe freely during imaging.
A round region of interest (ROI) on the main pulmonary artery was selected and drawn to plot an enhancement curve, which indicated the time needed to reach maximum enhancement by the test bolus. Accordingly, a time-enhancement curve was plotted. For diagnostic (angiographic) imaging, an additional 60 mL of the same contrast medium was injected intravenously. A three-second delay was added to the time of reaching the peak according to the test bolus curve to calculate the interval between the injection and the onset of scan. Caudocranial imaging was performed between the lowest hemidiaphragm and the top portion of the lungs.
3.3. Study Variables
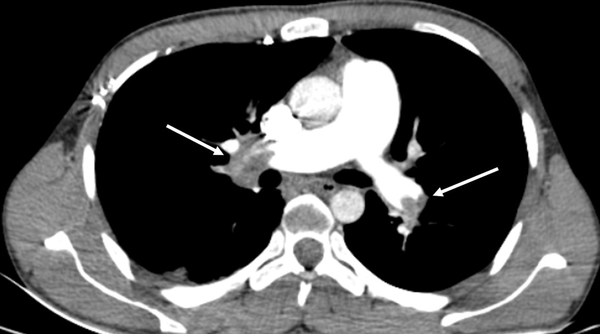
Two radiologists (an attending radiologist and a fourth-year radiology resident) independently examined the images on a clinical workstation (Multimodality Workplace, Siemens, Germany). A third attending radiologist arbitrated in the event of any discrepancy. Any endoluminal central pulmonary artery occlusion that was found as a low-attenuation filling defect confirmed the diagnosis of acute PE (8). Standard therapeutic protocols were applied (9). Central PE was diagnosed when the most proximal embolus was found in the main right or left pulmonary artery, right interlobar pulmonary artery, or lobar arteries (Figure 1). PE was considered peripheral when the embolus involved segmental and subsegmental pulmonary arteries (Figure 2) (10).
CT pulmonary angiography (CTPA) of a male patient with central pulmonary embolism (PE). The right main pulmonary artery is completely occluded (right arrow). In the left main pulmonary artery, however, the occlusion is partial (left arrow). The calculated Qanadli score is 30 (10 × 2 + 10 × 1).
The pulmonary arterial obstruction score (PAOS) was reported according to the criteria described in a previous study (Qanadli index) (11). Briefly, the Qanadli index is derived from CT images, incorporating the location and size of a thrombus. This index is the product of N × D, where N is the number of segmental branches located distal to the affected area, and D is the degree of obstruction (1; partial, 2; total). An abnormal position of the ventricular septum, that is, bowing toward the left ventricle, was confirmed or rejected subjectively. To report the RVD/LVD ratio, the largest right and left ventricular short-axis dimensions (RVD and LVD, respectively) were obtained in the plane of the widest distance between the interventricular septum and the free wall of the right ventricle or left ventricle, perpendicular to the long axis (12) (Figure 3).
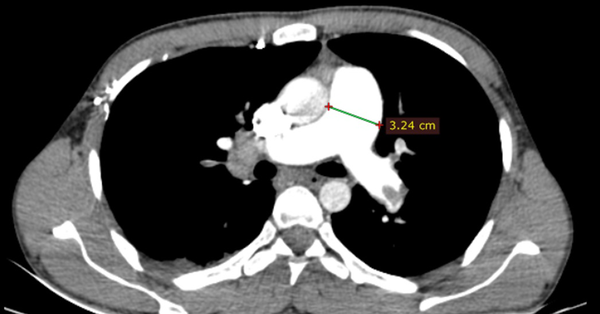
The degree of contrast material backwash into the IVC or hepatic veins in the axial view was reported according to a previously developed scale, which was as follows (13): (1) grade 1, no reflux; (2) grade 2, reflux trace into the IVC only; (3) grade 3, IVC involvement only; (4) grade 4, grade 3 along with the involvement of proximal hepatic veins; (5) grade 5, grade 3 along with the involvement of the mid-portion of hepatic veins; and (6) grade 6, grade 3 along with the involvement of distal hepatic veins. The pulmonary trunk diameter was also measured at 1.5 cm proximal to the bifurcation of the main pulmonary artery on the axial plane (14) (Figure 4).
The time-intensity curve generated by the bolus tracking system had three components: (1) bolus time curve peak; interval between the beginning of the upslope and maximum enhancement; (2) maximum enhancement; and (3) bolus-time curve peak at 50%, that is, the time between maximum enhancement and half the baseline enhancement (15) (Figure 5). All patients were followed-up for 60 days after admission, and the 60-day mortality rate was considered as an outcome variable. The other outcome variable was the Qanadli index, which was used to represent the PE severity. The Qanadli score ranges from 0 to 100% and indicates the severity of arterial obstruction based on the total count of involved arteries corrected by the severity of occlusion (1, partial obstruction; 2, complete obstruction) (11).
3.4. Statistical Analysis
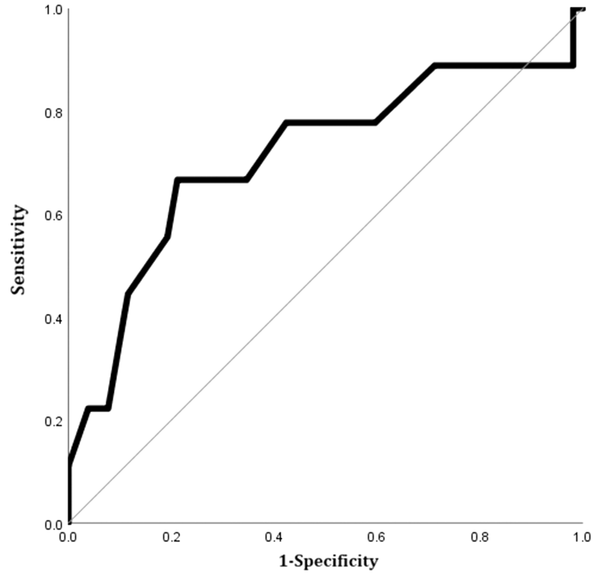
SPSS for Windows version 21.0 (IBM Corp. Released 2021. IBM SPSS Statistics for Windows, Version 28.0. Armonk, NY: IBM Corp) was used for statistical analysis. Pearson’s chi-square test, Fisher’s exact test, and independent samples t-test were used where appropriate. Pearson’s coefficient (r) was calculated to determine the correlations between variables. The receiver operating characteristic (ROC) curve was also plotted to determine the area under the curve (AUC) and the relevant cutoff value. A P-value ≤ 0.05 was considered statistically significant.
4. Results
4.1. General Information of the Participants
The study group consisted of 32 (52.5%) males and 29 (47.5%) females, with a mean age of 60.61 ± 16.77 years (range, 30 - 90 years). PE was located centrally in 39 patients (63.9%) and peripherally in 22 patients (36.1%). During the follow-up period, cardiopulmonary resuscitation (CPR) followed by intubation was required for three patients (4.9%). Thrombolytic therapy was administered for 11 patients (18%). The mean score of Qanadli index was 15.44 ± 7.50 (range, 1 - 30). Nine patients (14.8%) expired within 60 days of admission.
4.2. CT Findings on Admission
The interventricular septum was normal in 36 patients (59%), flattened in 20 patients (32.8%), and convex toward the left ventricle in 5 patients (8.2%). The mean RVD/LVD ratio was 1.05 ± 0.19 (range, 0.7 - 1.7). The reflux of the contrast medium into the IVC was graded as I in nine patients (14.8%), II in 19 patients (31.1%), III in six patients (9.8%), IV in 10 patients (16.4%), V in 14 patients (14%), and VI in three patients (4.9%). The mean pulmonary trunk diameter was 32.48 ± 4.46 mm (range, 24 - 46). Also, the mean bolus time curve peak was 7.09 ± 3.26 s (range, 2 - 16). Moreover, the mean maximum enhancement was 10.14 ± 4.48 HU (range, 3.4 - 28), and the mean bolus-time curve peak at 50% was 10.14 ± 4.48 s (range, 3.4 - 28)
4.3. Prediction of PE Severity
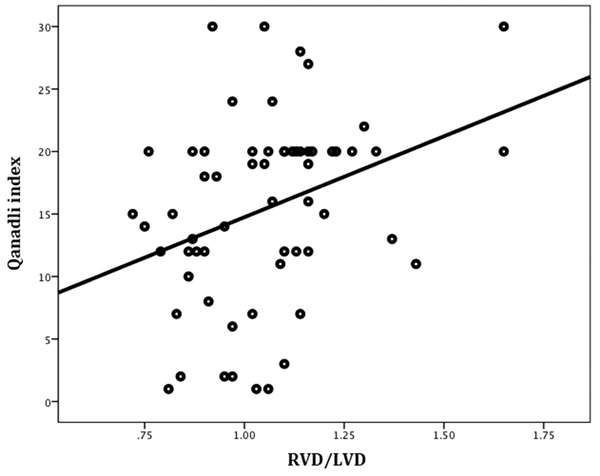
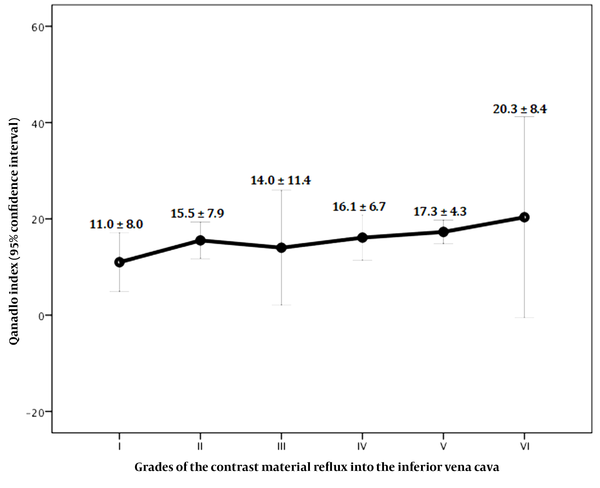
Significant positive correlations were found between the Qanadli index and the RVD/LVD ratio (Pearson’s r = 0.33, P = 0.01) (Figure 6) and also between the Qanadli index and the severity of contrast medium reflux into the IVC (Pearson’s r = 0.30, P = 0.04) (Figure 7). There were no significant correlations between the Qanadli index and other study variables, such as the patient’s age (Pearson’s r = -0.11, P = 0.34), pulmonary trunk diameter (Pearson’s r = 0.17, P = 0.18), bolus time curve peak (Pearson’s r = 0.14, P = 0.29), maximum enhancement (Pearson’s r = 0.01, P = 0.93), and bolus curve peak at 50% (Pearson’s r = 0.26, P = 0.06). The mean Qanadli index was significantly higher in patients with flattened and deviated interventricular septa compared to patients with a normal-appearing interventricular septum (19.20 ± 5.78, 17.80 ± 3.90, and 13.03 ± 7.85, respectively; P = 0.01).
4.4. Prediction of 60-Day Mortality
The study variables were compared between the expired and surviving patients in Table 1. Only the mean diameter of the pulmonary trunk was significantly larger in the expired group compared to surviving patients. The AUC of the pulmonary trunk diameter for predicting 60-day mortality was 0.71 (95% CI, 0.50 - 0.93; P = 0.04). The optimal cutoff value was 33.5 mm (sensitivity, 66.7%, specificity, 65.4%) (Figure 8).
| Variables | Groups | P-value | |
|---|---|---|---|
| Expired | Surviving | ||
| Sex | 0.72 | ||
| Male | 4 (44.4) | 28 (53.8) | |
| Female | 5 (55.6) | 24 (46.2) | |
| Age (y) | 65.00 ± 13.18 | 59.85 ± 17.31 | 0.40 |
| Location of PE | 0.59 | ||
| Central | 6 (66.7) | 33 (63.5) | |
| Peripheral | 3 (33.3) | 19 (36.5) | |
| Cardiopulmonary resuscitation and intubation | 1 (11.1) | 2 (3.8) | 0.37 |
| Thrombolytic therapy | 2 (22.2) | 9 (17.3) | 0.66 |
| Qanadli index | 15.22 ± 5.36 | 15.48 ± 7.85 | 0.92 |
| Interventricular septum | 0.55 b | ||
| Normal | 5 (55.6) | 31 (59.6) | |
| Flattened | 2 (22.2) | 18 (34.6) | |
| Convex to the left | 2 (22.2) | 3 (5.8) | |
| Right to left ventricular diameter ratio | 1.15 ± 0.30 | 1.04 ± 0.17 | 0.32 |
| Contrast medium reflux into the inferior vena cava | 0.72 c | ||
| I | 1 (11.1) | 8 (15.4) | |
| II | 4 (44.4) | 15 (28.8) | |
| III | 0 (0.0) | 6 (11.5) | |
| IV | 1 (11.1) | 9 (17.3) | |
| V | 3 (33.3) | 11 (21.2) | |
| VI | 0 (0.0) | 3 (5.8) | |
| Pulmonary trunk diameter (mm) | 35.67 ± 6.08 | 31.92 ± 3.94 | 0.02 d |
| Bolus time curve peak (s) | 8.46 ± 4.09 | 6.85 ± 3.07 | 0.17 |
| Maximum enhancement (H) | 160.89 ± 82.78 | 167.00 ± 54.03 | 0.84 |
| Bolus time curve peak at 50% (s) | 10.70 ± 4.75 | 10.06 ± 4.49 | 0.75 |
The Study Variables Examined in Expired and Surviving Patients with Pulmonary Embolism (PE) a
5. Discussion
In this prospective study, some CT findings could predict the severity or 60-day mortality of patients with acute PE. According to our findings, an abnormal interventricular septum morphology, an abnormal RVD/LVD ratio, and the contrast medium reflux into the IVC significantly predicted the severity of PE. While the bolus time curve indicators were not significantly prognostic, the pulmonary trunk diameter significantly predicted the 60-day mortality (optimal cutoff value, 33.5 mm; sensitivity, 66.7%; and specificity, 65.4%).
An abnormal interventricular septum morphology (leftward shift) indicates increased pressure on the right side of the heart after severe obstruction of the pulmonary artery (16). This finding was also a significant predictor of PE severity; however, it was not significantly associated with short-term mortality. Other studies have reported similar findings (4, 14, 17-19). The RV dilation has been suggested as a marker of right-sided heart dysfunction (20). In the current study, the RVD/LVD ratio on transverse sections had a significant positive correlation with the Qanadli score in our patients. However, it was not a significant predictor of 60-day mortality. This finding is consistent with the results of previous studies, which showed that although the RVD/LVD ratio might serve as an indicator of PE severity (21), it is not a reliable predictor of mortality in stable patients without shock (22).
The contrast medium reflux into the IVC is another suggested indicator of increased RV pressure (5). In line with a previous study (4), the presence of backwash contrast in the IVC was only an indicator of PE severity, but not associated with early mortality in the present study. In two other studies, this indicator was not a reliable prognostic predictor (23, 24). The only significant predictor of 60-day mortality was the increased pulmonary trunk diameter in our series. The size of the pulmonary trunk is another suggested index for evaluating RV function (25). Contrary to our findings, Lyhne et al. (23) did not find the pulmonary trunk diameter to be a robust predictor of PE outcomes. However, in another study by Aviram et al. (5), a dilated pulmonary trunk was the strongest predictor of high-risk PE among all CT indices.
An acute increase in the pulmonary vascular resistance of patients with PE delays pulmonary artery enhancement; this delay leads to the extension of the test bolus curve (6). In the present study, however, none of the variables related to the time-intensity curve were found to be of prognostic significance. In this regard, there are scarce and conflicting data in the literature. For example, in a study by Lin et al. (15) on 71 patients with acute PE, both bolus curve upslope time > 6 seconds and 50% downslope time > 6 seconds predicted PE mortality. In line with our findings, John et al. (26) concluded that variables which were related to the time-intensity curve were not accurate enough for identifying right ventricular dysfunction in 114 patients with PE. One possible explanation for this inconsistency is that the right ventricular dysfunction is more likely to occur in patients with central PE, in whom the main pulmonary vasculature becomes acutely obstructed (15). Hemodynamic stability at the time of the study is another factor that may compromise the prognostic performance of CT parameters associated with right ventricular dysfunction (5).
This study had some limitations, such as the use of non-ECG-gated CT scan, missing concomitant echocardiography for measuring the RV diameter, and excluding unstable patients and those with massive PE. In a recent study, however, Ammari et al. (27) showed a high correlation between the RVD/LVD measurements by CT and echocardiography. The accuracy and reproducibility of other CT parameters were confirmed in another study (28); therefore, they were not examined in the present study. Although to achieve the goals of this study, the number of patients was adequate, to perform a survival analysis, a larger sample size is required. By enrolling more patients, we can extend our methodology in future studies. Besides, further studies with a larger sample size may yield higher sensitivity/specificity for major prognostic parameters, such as the pulmonary artery diameter. Another important limitation of the present study is that the diameter of the pulmonary artery might not be a constant parameter and could be associated with variabilities that may be unrelated to PE, such as pulmonary diseases and pulmonary hypertension. We excluded patients with pulmonary hypertension and/or pulmonary disease in this study, while they should be examined in future studies, as well.
In conclusion, an abnormal interventricular septum morphology, CT-derived RVD/LVD ratio, and contrast medium reflux into the IVC were significant predictors of PE severity in hemodynamically stable patients with acute PE. The pulmonary trunk diameter was the only predictor of 60-day mortality. No prognostic role was found for variables related to the time-intensity curve.
