1. Background
T-cell lymphomas represent a large group of hematological malignancies, which can be classified into different categories, based on various histological and clinical features, accounting for 15% of all non-Hodgkin lymphomas (1). This group of malignancies consists of peripheral T-cell lymphoma, angioimmunoblastic lymphoma, and natural killer (NK)/T-cell lymphoma among others (2). Diagnosis of T-cell lymphomas is based on the histological findings of lymph node biopsy, which represent different features, enabling the World Health Organization (WHO) classification (3). These findings include morphological, cytogenetic, immunophenotypic, and molecular characteristics. Another available option is to conduct a biopsy on an extranodal organ, such as the spleen or bone marrow, depending on the clinical and radiological findings. Additionally, 18F - fluorodeoxyglucose positron emission tomography/computed tomography (18F-FDG PET/CT) scan completes the baseline evaluation to determine the progression and extension of disease before deciding on any therapeutic option (4).
T-cell lymphoma treatments consist of a combination of several chemotherapy drugs. The majority of T-cell lymphomas have globally poor outcomes, regardless of the T-cell type. The five-year survival is generally short after diagnosis (around 30%), with frequent and rapid progression. Treatment of these patients often requires multiple lines of chemotherapy (5). The most frequently used combination of chemotherapy drugs is cyclophosphamide, doxorubicin, vincristine, and prednisolone (CHOP) regimen. Complete response to first-line treatment with CHOP is approximately 20 - 30% for peripheral T-cell lymphoma, which is the most frequent T-cell lymphoma (6). Novel agents and methods, such as immunotherapies, antifolates, and cellular products, may be also used (7).
Different indices have been developed to better evaluate the outcomes of T-cell lymphoma patients. The international prognostic index (IPI), as the most commonly used index, is based on five criteria: Age, performance status, extranodal involvement, serum lactate dehydrogenase (LDH) level, and Ann Arbor staging classification (8). Other indices are more recent and include the prognostic index for T-cell lymphoma (PIT), the modified prognostic index for T-cell lymphoma (mPIT), and the index presented by the International Peripheral T-cell Lymphoma Project (IPTCLP) (9). These indices provide extensive biological data and are not necessarily evaluated for all types of T-cell lymphomas (10).
Although there are many indices available, prediction of survival remains a challenge in T-cell lymphomas. T-cell lymphomas with a low-risk IPI category may have poor outcomes, indicating the low reliability of this marker; therefore, there is a need for a reliable predictive biomarker of survival (11). According to a recent study, the baseline total metabolic tumor volume (TMTV), combined with PIT, can identify patients with a high risk of early progression of peripheral T-cell lymphomas (12); however, this finding needs to be validated in future studies. Besides, the evaluation of TMTV has major drawbacks, such as being time-consuming and not being a routine practice.
Another recent and promising technique to quantify tumor heterogeneity is CT-based texture analysis (CTTA). This technique analyzes and describes the distribution and relationship of pixels or voxel gray levels in an image (13). Five first-order parameters are usually extracted from the pixel intensity histogram, including the mean intensity (average of pixels in a region of interest), skewness reflecting asymmetry and entropy (irregularity), standard deviation (SD), and kurtosis reflecting the peakedness or flatness of the pixel histogram (13).
The CTTA has been already used in several studies on various solid tumors, such as colorectal cancer, renal cell cancer, non-small-cell lung cancer, esophageal cancer, head and neck squamous cell carcinoma, hepatocellular carcinoma, and melanoma (14-21). This index has shown promising results in survival prediction, potentially allowing for a tailored treatment of these malignancies. Although texture analysis based on PET images has been performed on lymphomas, with promising results for the prediction of survival (22-24), CTTA has been scarcely studied in hematological malignancies with preliminary results (25) Therefore, application of CTTA as a possible predictive biomarker of survival in patients with T-cell lymphomas has not been analyzed yet.
2. Objectives
The present study aimed to determine if texture parameters extracted from the CT scan of pretreatment 18FDG PET/CT examination are independently associated with the survival of patients with T-cell lymphomas.
3. Patients and Methods
3.1. Study Population
In this retrospective cohort study, consecutive patients with a diagnosis of T-cell lymphoma, admitted to Reims University Hospital (France) from December 2008 to June 2019, were recruited from the institutional computer database. Only patients with available baseline 18FDG PET/CT scans at the time of diagnosis and within two months before treatment were included in the study. Patients without any lesions with a high focal uptake in the baseline 18FDG PET scan were excluded. The following data were collected in this study: Age, sex, Eastern Cooperative Oncology Group Performance Status (ECOG PS), B-type symptoms, Ann Arbor stage, extranodal involvement, IPI score, IPTCLP score, LDH level, β2 microglobulin level, serum albumin level, histopathological type, and maximum standardized uptake value (SUVmax) in the baseline 18F-FDG PET/CT scan.
3.2. Ethical Considerations
This retrospective study evaluating the patients’ medical records was authorized by the Commission Nationale Informatique et Libertés (National Commission on Informatics and Liberty, CNIL; authorization No., 1118523) in accordance with the French law, allowing for the computerized management of medical data at Reims University Hospital. Considering the design of this retrospective study, the requirement to obtain written informed consent was waived.
3.3. Follow-up and Endpoints
All patients were followed-up based on different clinical and biological criteria, as well as radiological evaluations according to institutional protocols until February 2021. The time of follow-up was defined as the time interval between diagnosis and the final follow-up. Three endpoints were determined, including progression-free survival (PFS), PFS at 24 months (PFS24), and overall survival (OS). The PFS was defined as the interval between the onset of the first chemotherapy line and detected tumor progression. The secondary endpoint, PFS24, was defined as the time interval between the onset of chemotherapy and detected progression within the first 24 months. Finally, OS was defined as the time interval between the onset of chemotherapy and death. For the PFS analysis, patients without recurrence at the end of follow-up were excluded, and for the PFS24 analysis, patients without any progression within 24 months were excluded. Finally, for the OS analysis, alive patients at the end of follow-up were removed.
3.4. 18F-FDG PET/CT Analysis
All patients underwent a skull base to proximal thigh 18F-FDG PET/CT scan at the time of diagnosis. The helical CT scan protocols varied owing to the long period of recruitment. Nonetheless, the milliampere-seconds (mAs) varied between 59 and 287 (median, 83), the voltage was 120 kV for all scans, the exposure time varied from 606 to 728 (median, 655), and the slice thickness varied from 1.25 to 2.5. The pitch factor was 1.375, except for one at 0.9375. A nuclear medicine physician, blinded to the patient outcomes, retrospectively analyzed the baseline 18F-FDG PET/CT scans, selected up to five hypermetabolic lesions (lymph nodes or extranodal involvement), and reported the SUVmax for each lesion.
3.5. Computed Tomography Based Texture Analysis
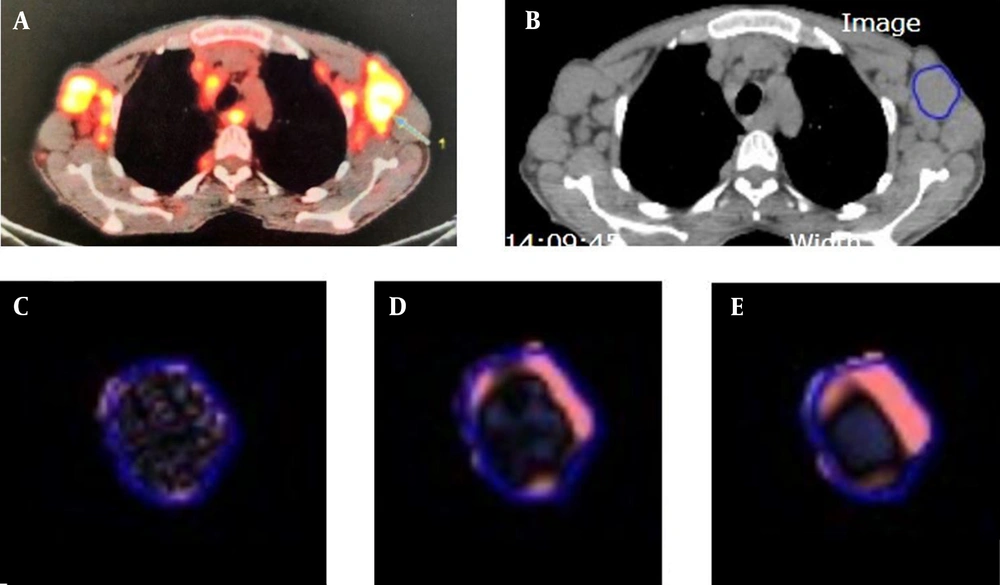
The CTTA was performed using the commercially available TexRAD software (TexRAD Ltd, Cambridge, UK) on the pretreatment non-contrast-enhanced CT images, extracted from the baseline 18F-FDG PET/CT scan. A radiologist plotted a semi-automatic circular region of interest (ROI) in up to five target lesions per patient; he had previously selected these ROIs, based on both their high focal uptake on 18F-FDG PET and their well-defined contours. The CTTA was performed in two steps. First, a spatial scale filter (SSF) was applied (Laplacian of Gaussian [LoG] spatial band-pass filter) to extract different features at different anatomic scales, including fine, medium, and coarse texture scales [fine SSF, 2 mm (object radius, 2 mm); medium SSF, 3 - 5 mm; and coarse SSF, 6 mm] (Figure 1). Conventional CT images corresponded to SSF = 0. Next, a statistical quantification was performed to determine five CT histogram parameters corresponding to SD, kurtosis, mean grey-level intensity, skewness, and entropy. In case there were multiple target lesions, the texture parameters of the lesions were averaged.
3.6. Statistical Analysis
All quantitative variables were described as median, followed by interquartile range (Q1 - Q3), along with minimum-maximum range. Also, categorical variables are presented as raw number and percentage. To identify independent predictors of PFS, PFS24, and OS, a multivariable analysis was performed on the clinical, biological, and texture parameters. The correlation between the estimates of each texture parameter using different filter values and events was evaluated based on a multivariable L1 [least absolute shrinkage and selection operator (Lasso)] penalized Cox regression model (26), given the small number of events compared to the number of included covariates.
Moreover, the regularization parameter was established using 10-fold cross-validation. Generally, the Lasso method shrinks the coefficient weights to zero coefficients for variables unrelated to the outcome. The potential predictors of outcome were evaluated by including variables with non-zero coefficients. Next, to estimate the corresponding hazard ratios (HRs) and 95% confidence intervals (95% CIs), a multivariate Cox regression analysis was performed by including variables with non-zero coefficients selected by the Lasso model.
Additionally, the bivariate Kaplan-Meier estimate, receiver operating characteristic (ROC) curve, and maximal Youden index were assessed for each non-zero texture feature in the Lasso regression to identify the optimal threshold differentiating patients with good and poor prognosis, using non-parametric log-rank test. Sensitivity, specificity, and 95% CIs were determined for the optimal thresholds of texture parameters. All statistical analyses were performed using R Core Team software (2019) (R: A language and environment for statistical computing, R Foundation for Statistical Computing, Vienna, Austria) (27).
4. Results
4.1. Patients’ Characteristics
A total of 62 patients were found eligible for this study. However, 33 patients were excluded, as they did not have any available baseline 18FDG PET/CT findings, and six were removed because of the absence of at least one lesion, showing a high signal uptake in the baseline 18FDG PET/CT scan. Twenty-three patients constituted the final population of this study, including 16 males and seven females, with a median age of 69.2 years (Q1 - Q3, 56 - 74.7; range, 33 - 86 years). Table 1 presents the main clinical, biological, histological, and nuclear medicine characteristics of 23 remaining patients.
| Characteristics | Patients (n = 23); No. (%) |
|---|---|
| Median age (y) | 69.2 (56.0 - 74.7) [33-86] |
| Age, > 60 y | 15 (65.2) |
| Sex | |
| Male | 16 (69.6) |
| Female | 7 (30.4) |
| ECOG PS > 1 | 10 (43.5) |
| B symptoms | |
| Present | 18 (78.3) |
| Absent | 5 (21.7) |
| Ann Arbor stage | |
| Stage I | 0 (0) |
| Stage II | 0 (0) |
| Stage III | 5 (22) |
| Stage IV | 18 (78) |
| Extranodal involvement | |
| Yes | 19 (82.6) |
| No | 4 (17.4) |
| Histopathology | |
| Angioimmunoblastic T-cell lymphoma | 16 (69.6) |
| ALK-negative anaplastic large cell lymphoma | 4 (17.4) |
| Peripheral T-cell lymphoma, not otherwise specified | 1 (4.3) |
| Primary cutaneous CD8+ aggressive epidermotropic cytotoxic T-cell lymphoma | 1 (4.3) |
| Nasal type, extranodal NK/T-cell lymphoma | 1 (4.3) |
| IPI score > 2 | 17 (73.9) |
| IPTCLP | |
| 0 | 5 (21.7) |
| 1 | 8 (34.8) |
| 2 | 6 (26.1) |
| 3 | 4 (17.4) |
| Β2 microglobulin > 3 mg/L | 17 (73.9) |
| Albumin level < 35 g/L | 16 (69.6) |
| Elevated LDH | |
| Yes | 17 (73.9) |
| No | 6 (26.1) |
| Median SUVmax | 10.3 (7.1 - 13.2) [2.2-51] |
| Progression | |
| Yes | 18 (73.3) |
| No | 5 (21.7) |
| Failure to achieve PFS24 | |
| Yes | 17 (73.9) |
| No | 6 (26.1) |
| Death | |
| Yes | 13 (56.5) |
| No | 10 (43.5) |
Abbreviations: ECOG PS, Eastern Cooperative Oncology Group performance status; IPI, international prognostic index; IPTCLP, International Peripheral T-Cell Lymphoma Project; LDH, serum lactate dehydrogenase; SUVmax, maximum standardized uptake value; PFS24, progression-free survival at 24 months.
a Qualitative variables are expressed as raw numbers, with percentages in parentheses. Quantitative variables are expressed as median, followed by interquartile ranges in parentheses. Numbers in brackets are ranges.
The IPI score was > 2 in 17 (73%) patients. The IPTCLP score was zero in 5 (21%) patients, one in 8 (34%) patients, two in 6 (26%) patients, and three in 4 (17%) patients. The ECOG PS score was > 1 in 10 (43%) patients. The majority of target lesions consisted of lymph nodes (53/60, 88.3%), with other lesions detected in the spleen (3/60, 5%), bones (1/60, 1.7%), lungs (1/60, 1.7%), skin (1/60, 1.7%), or liver (1/60, 1.7%).
The median follow-up duration was 402 days (Q1 - Q3: 275 - 1303; range: 64 - 3746). The median OS was 391 days (Q1 - Q3: 86.5 - 780.5; range: 10 - 3463), and the median PFS was 268 days (Q1 - Q3: 263.5 - 1270.0; range: 10 - 2321). Eighteen patients (18/23, 78%) progressed during the follow-up after the onset of treatment, and 17 (17/23, 73%) patients progressed in the first 24 months of follow-up. Death occurred in 13 (13/23, 56%) patients.
4.2. PFS Analysis
Twenty-three patients were included in the PFS analysis. The Lasso-penalized Cox regression analysis identified three possible clinical and biological predictors with non-zero coefficient weights (CWs): ECOG PS > 1 (CW, 0.086), albumin level < 35 g/L (CW, 0.34), and IPI score > 2 (CW, 0.40) (Table 2). None of these parameters were significant independent predictors of PFS in the multivariable analysis.
| Parameters | HR (95% CI) | P-Value |
|---|---|---|
| ECOG PS > 1 | 1.17 (0.23 - 5.81) | 0.84 |
| IPI > 2 | 3.34 (0.54 - 20.76) | 0.19 |
| Albumin level < 35 g/L | 2.03 (0.40 - 10.33) | 0.39 |
Abbreviations: IPI, international prognostic index; ECOG PS, Eastern Cooperative Oncology Group performance status; HR, hazard ratio; 95% CI, 95% confidence interval.
4.3. PFS24 Analysis
Twenty-three patients were included in the PFS24 analysis. The Lasso-penalized Cox regression analysis identified four possible clinical and biological predictive factors: ECOG PS > 1 (CW, 0.088), IPI score > 2 (CW, 0.13), IPTCLP score (index presented by the International Peripheral T-cell Lymphoma Project) (CW, 0.029), and albumin level < 35 g/L (CW, 0.61) (Table 3). None of these parameters were significant independent predictors of PFS24 in the multivariable analysis.
| Parameters | HR (95% CI) | P-Value |
|---|---|---|
| ECOG PS > 1 | 2.10 (0.29 - 14.82) | 0.45 |
| IPI > 2 | 1.53 (0.21 - 11.47) | 0.67 |
| IPTCLP | 1.09 (0.47 - 2.52) | 0.83 |
| Albumin < 35 g/L | 2.27 (0.3 - 16.80) | 0.42 |
Abbreviations: ECOG PS, Eastern Cooperative Oncology Group performance status; IPI, international prognostic index; IPTCLP, International Peripheral T-cell Lymphoma Project; HR, hazard ratio; 95% CI, 95% confidence interval.
4.4. Overall Survival Analysis
Twenty-three patients were included in the OS analysis. The Lasso-penalized Cox regression analysis identified two texture parameters as potential predictors of OS: SD at a coarse texture scale (SSF = 6; CW, 0.003) and skewness at a mean texture scale (SSF = 5; CW, 0.19). Two clinical and biological parameters showed non-zero coefficient weights: ECOG PS > 1 (CW, 0.67) and albumin level < 35 g/L (CW, 0.11). One texture parameter, i.e., SD at a coarse texture scale (SSF = 6) (HR = 1.009, 95% CI: 1.0012 - 1.016, P = 0.02), was an independent predictor of OS in the multivariable analysis (Table 4).
| Parameters | HR (95% CI) | P-Value |
|---|---|---|
| ECOG PS >1 | 3.79 (0.81 - 17.68) | 0.08 |
| Albumin level < 35 g/L | 3.88 (0.47 - 32.25) | 0.21 |
| SSF6 SD | 1.009 (1.0012 - 1.016) | 0.02 a |
| SSF5 skewness | 1.78 (0.91 - 3.49) | 0.09 |
Abbreviations: ECOG PS, Eastern Cooperative Oncology Group performance status; SSF6 SD, standard deviation at a coarse texture scale; HR, hazard ratio; 95% CI, 95% confidence interval; SSF, spatial scale filter.
a Significant P-value.
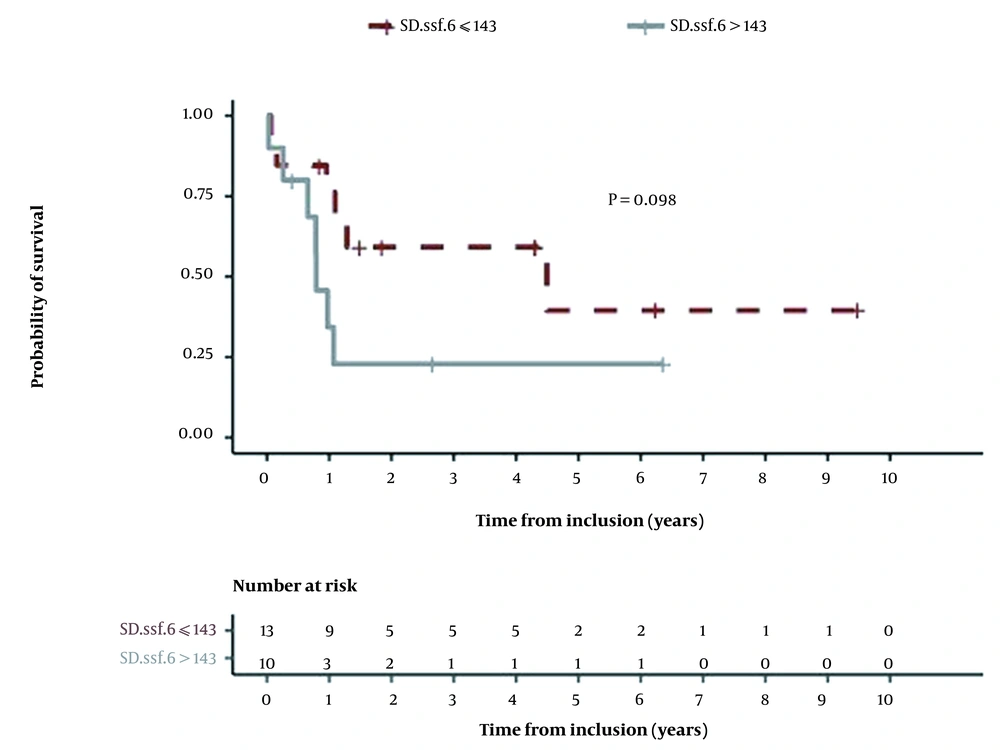
Additionally, a Kaplan-Meier analysis was performed for both SD at a coarse texture scale and skewness at a mean texture scale after an optimal threshold was determined for each parameter. To determine the performance of SD at SSF = 6 as a survival biomarker, a ROC curve was plotted, and the maximal Youden index was measured to be 0.28. The optimal cutoff point was estimated at 143. A SD value above 143 at SSF = 6 was associated with a poor prognosis; however, the result of log-rank test was not statistically significant (P = 0.09) (Figure 2). This threshold yielded a sensitivity of 47% (95% CI: 0.2669, 0.675) and a specificity of 81% (95% CI: 0.6443, 0.9676) in predicting OS.
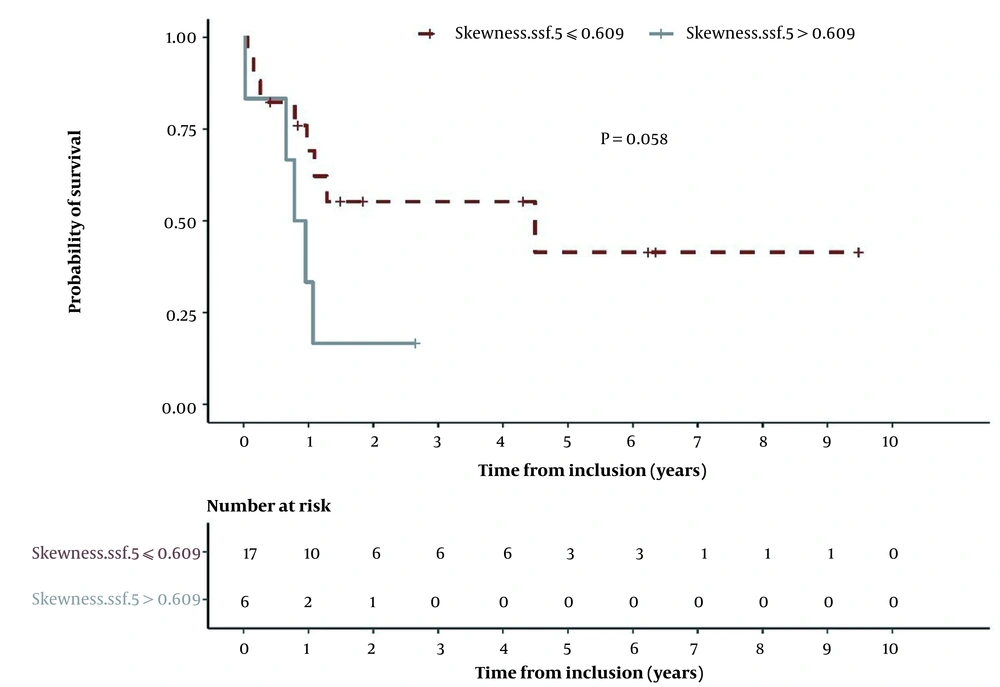
Moreover, a Kaplan-Meier survival curve was plotted for skewness at SSF = 5. A ROC curve was also plotted, and the maximal Youden index was estimated at 0.26 for a threshold of 0.609. This threshold was associated with a poor OS (P = 0.058) and yielded a specificity of 93% (95% CI: 0.8308, 1) and a sensitivity of 33% (95% CI: 0.1344, 0.5175) to predict OS (Figure 3).
5. Discussion
The present study revealed that a texture parameter derived from non-contrast-enhanced CT scan of the baseline 18FDG PET/CT study may independently predict OS in patients with T-cell lymphomas. The SD at a coarse texture scale (SSF = 6) was an independent predictive factor of OS. Overall, T-cell lymphomas have global poor outcomes, depending on various predictive indices, such as IPI or IPTCLP, along with clinical and biological features (28). Identification of the histological subgroup, such as anaplastic lymphoma kinase (ALK) tumor status, can also help predict the prognosis of these tumors (29). In peripheral T-cell lymphomas, a recent approach to predict progression was to evaluate TMTV. This method has been reported to predict the outcomes of peripheral T-cell lymphomas, especially using a threshold of 230 cm3 (12). However, this threshold is debated due to the multiple existing techniques and the absence of consensus for the evaluation of TMTV. Morevover, this is a time-consuming and cumbersome technique (30).
The outcomes of T-cell lymphomas remain challenging to predict, particularly since these lymphomas comprise many heterogeneous subgroups. Some studies have described texture parameters derived from the pretreatment FDG/PET examination as predictive factors of survival in lymphomas. In this regard, a study on 82 patients with non-Hodgkin lymphoma (almost exclusively diffuse large B-cell lymphoma) revealed that a first-order radiomic parameter, namely, kurtosis, was correlated with OS (22). Moreover, Mayerhoefer et al. found that in patients with mantle cell lymphoma (n = 107), entropy was a predictive factor of two-year PFS (31).
In another study, Wang et al. compared a radiomic model with a metabolism-based model (consisting of clinical variables and metabolic parameters) in 110 patients with nasal-type extranodal NK/T-cell lymphoma. They found that texture parameters could predict the patient outcomes, although the performance of the radiomic model was poorer than that of the metabolism-based model (32). Despite these interesting results and the findings of preliminary research (33) on CTTA in a population of both Hodgkin and aggressive non-Hodgkin lymphomas, to the best of our knowledge, CTTA has been never investigated in a specific population of T-cell lymphoma patients.
Since 18FDG PET/CT is the reference technique for the baseline evaluation of lymphomas, CTTA can be a potentially valuable tool for the prediction of patient outcomes as early as the pretreatment 18FDG PET/CT examination. Tumor heterogeneity is a potentially important parameter in routine clinical practice. It has been suggested that heterogeneity is correlated with microenvironmental features, particularly hypoxia, oxidative stress, and genomic instability (34, 35). TA, particularly CTTA, has shown its added value compared to the naked eye in the assessment of tumor heterogeneity (20).
In the present study, increased variability in the pixel values (SD) with a coarse filter was associated with poor outcomes. For image analysis, SD tends to represent the heterogeneity of pixels in an image and therefore indicates the heterogeneity of tumor lesions. Ng et al. also found that SD, regardless of the type of filter, was associated with poor OS in colorectal cancer (14). Colorectal cancer lesions are globally more heterogeneous than T-cell lymphomas. This may explain why the present results were only correlated with a coarse filter, which represents heterogeneity better than fine or medium filters, as indicated in colorectal cancer lesions. Although the present findings were close to the level of significance, probably due to a lack of statistical power, a threshold of 143 for SD at SSF = 6 yielded a specificity of 81% for the determination of OS in T-cell lymphomas. Moreover, a threshold of 0.609 for skewness at SSF = 5 yielded a high specificity in the prediction of OS (93%).
Recently, convolutional neural networks (CNNs) have shown that MTV and baseline whole-body total lesion glycolysis (TLG) are good predictors of PFS and OS in patients with nasal type, extranodal NK/T-cell lymphoma, although it has been only shown in a univariate analysis (36). Similarly, deep learning methods have shown potential in the automatic assessment of TMTV in PET scans of patients with large B-cell lymphomas and enabled prognosis analysis. As reported in some studies, TMTV was an independent predictor of PFS and OS (37, 38). However, to the best of our knowledge, the prognostic evaluation of T-cell lymphomas using radiomics and CNN has not been conducted so far.
The present study had some limitations. Few patients were eligible to be included in this study, mostly due to a lack of available baseline 18FDG PET/CT examinations, which were performed outside our institution and were not recoverable. The present retrospective monocentric study was performed on a T-cell lymphoma population, who represent only nearly 15% of non-Hodgkin lymphoma patients. This subtype of lymphoma is a rare pathology, and the small number of patients may explain why there was a correlation between the texture parameters and OS, but not PFS or PFS24; therefore, further larger-scale studies are necessary to validate the present findings.
In conclusion, the pretreatment CTTA-derived tumor SD at a coarse filter scale may be a predictive biomarker of OS in patients with T-cell lymphomas. However, the sample size of this study was small, and the results need to be confirmed in large-scale research


