1. Background
In recent years, positron emission tomography/computed tomography (PET/CT) imaging has focused on the detection of small lesions, tumor staging, radiotherapy treatment planning, and evaluation of response to therapy (1-3). The quality of PET/CT images plays an important role in the accurate diagnosis of cancers (4). Besides, to reach an accurate diagnosis, accurate quantification is essential (5). It is known that the image quality of overweight patients is poor due to the high level of noise, which originates from scattering and photon attenuation (6).
In this regard, Nagaki et al. reported that image noise was 10.98% ± 2.54% in patients weighing 60 - 74 kg and 14.15% ± 2.35% in patients weighing over 75 kg (7). Also, in a study by Taniguchi et al., image noise of a large-body phantom was almost twice as high as the image noise of the National Electrical Manufacturers Association (NEMA) phantom (6). Generally, use of a smaller crystal size and point spread function (PSF) modeling can enhance the spatial resolution (8) and signal-to-noise ratio (SNR) of images (9) and improve the quantitative analysis of lymph nodes (10) and lesions in the lungs (11). Munk et al. found that the PSF protocol did not yield a monotonic recovery coefficient (RC) when the lesion size decreased (12). However, the post-reconstruction filter could somehow decrease the PSF artifacts (12).
The quality of PET/CT images may be degraded due to respiratory motions in the thorax and abdomen (13, 14), which lead to a lower standardized uptake value (SUV) (15), a larger lesion size, and inaccurate anatomical localization (16, 17). The time-of-flight (TOF) method, which includes the time information to correctly localize the annihilation point along the line of responses, can be appropriate in the thorax and abdomen due to higher detectability and SNR (16, 18, 19). In this regard, Hashimoto et al. found that the TOF method increased the detectability of subcentimeter lesions at a voxel size of 2 mm (20). Evidence shows that TOF reduces the coefficient of variation (COV) (20, 21), improves the SNR for low-contrast lesions (20), and even enhances the contrast (22), especially for small lesions (11) and overweight patients (6).
A study on a NEMA phantom showed that the combination of TOF with Bayesian penalized likelihood (BPL) algorithm with an optimal beta value could yield better results for quantification, as well as higher SNR values for subcentimeter lesions compared to ordered subset expectation maximization (OSEM)-based reconstruction (23); it could also decrease the edge artifacts generated in the PSF protocol. However, the intensity of this suppression was related to the lesion-to-background ratio (LBR) and lesion size (24). Nonetheless, some studies have reported that the use of optimal parameters, such as subset, iteration, and full width at half maximum (FWHM) of Gaussian filter size, served vital roles in PSF modeling and TOF effects on image quality improvement (25, 26). Rezaei et al. (26) showed that intrinsic FWHM improved by increasing iteration × subset from 32 to 54.
2. Objectives
This study aimed to find a proper reconstruction protocol with an optimized subset number and filter size at different LBRs and background activity concentrations to improve the quality of FDG PET/CT images in overweight patients using a large-body phantom.
3. Materials and Methods
3.1. Positron Emission Tomography/Computed Tomography Scanner
All PET/CT images were acquired using a Discovery 690 VCT system (GE Healthcare, Milwaukee, Wisconsin, USA), along with a 64-slice CT system (LightSpeed VCT system). The PET scanner consisted of 24 detector rings with 13,824 lutetium-yttrium oxyorthosilicate (LYSO) crystals. The crystal size of the PET scanner was 4.2 × 6.3 × 25 mm, with axial and transaxial fields of view of 16.2 and 70 cm, respectively. The timing resolution of TOF and the coincidence time window of the scanner were 555 ps and 4.9 ns, respectively. The energy window of the scanner was within the range of 435 - 650 keV.
3.2. Phantom Study
In this study, an in-house phantom, with an inner diameter of 35 cm and volume of 10,400 mL, containing six-sphere lesions with diameters of 10, 13, 17, 22, 28, and 37 mm, was used to simulate overweight patients. The phantom was filled with an 18F-fluorodeoxyglucose (18F-FDG) solution. Background activity concentrations of 3 and 5 kBq/cc representing the liver and the lungs respectively, as well as LBRs of 2: 1 and 8: 1 representing low and high tumor-to-background ratios (TBRs), were used in this study.
The emission data were obtained for three minutes per bed position. The list-mode data were reconstructed with a matrix size of 256 × 256 and a pixel size of 2.73 mm. Different reconstruction protocols, including OSEM plus PSF modeling (OSEM + PSF), OSEM plus TOF (OSEM + TOF), OSEM plus PSF plus TOF (OSEM + PSF + TOF), and OSEM without PSF and TOF (OSEM), were evaluated three times to obtain reliable results. The number of iterations was set at two, and the number of subsets was set at 18, 24, 32, and 36 for all reconstruction protocols. Besides, post-smoothing Gaussian filters with FWHM of 4.5, 5.5, and 6.5 mm were applied. Finally, CT acquisition for attenuation correction and localization was performed at a tube voltage of 120 kVp, tube current of 100 mA, and rotation time of 1 sec.
3.3. Assessment Strategy
The COV was calculated in the present study. The SNR and RC were measured for each lesion size at different LBRs and background activity concentrations. To calculate the COV, 60 spherical volumes of interest (VOIs), with a diameter of 30 mm, were drawn on the central slice; slices of ± 1 and ± 2 (12 VOIs for each slice) were away from the center of the phantom. The COV was determined as the ratio of standard deviation in the background (SDBG) of VOIs and the average count of 60 VOIs (CtBG, mean). The SNR was also calculated as the ratio of maximum count for each hot lesion VOI (CtHot) minus the average count in 60 background VOIs (CtBG, mean) over SDBG. The RCs were calculated as the ratio of CtHot, max to CtBG, mean minus one, divided by the true activity ratio in the phantom minus one. It should be noted that the VOIs of the lesions were drawn based on the CT images.
The box-and-whisker plot was applied to compare different subset numbers and reconstruction protocols. Moreover, the correlation plot of COV and SNR was drawn for different lesion sizes. The correlation coefficient was also calculated.
3.4. Statistical Analysis
Statistical analysis was performed using SPSS version 23.0 (IBM Corp. Released 2015. IBM SPSS Statistics for Windows, Version 23.0. Armonk, NY: IBM Corp.). A P-value less than 0.05 was considered statistically significant. The normal distribution of variables was assessed using Kolmogorov-Smirnov test. Mann-Whitney U test and Kruskal-Wallis test were also used for non-parametric variables. Finally, the box-and-whisker plot was drawn to determine the effects of variables.
4. Results
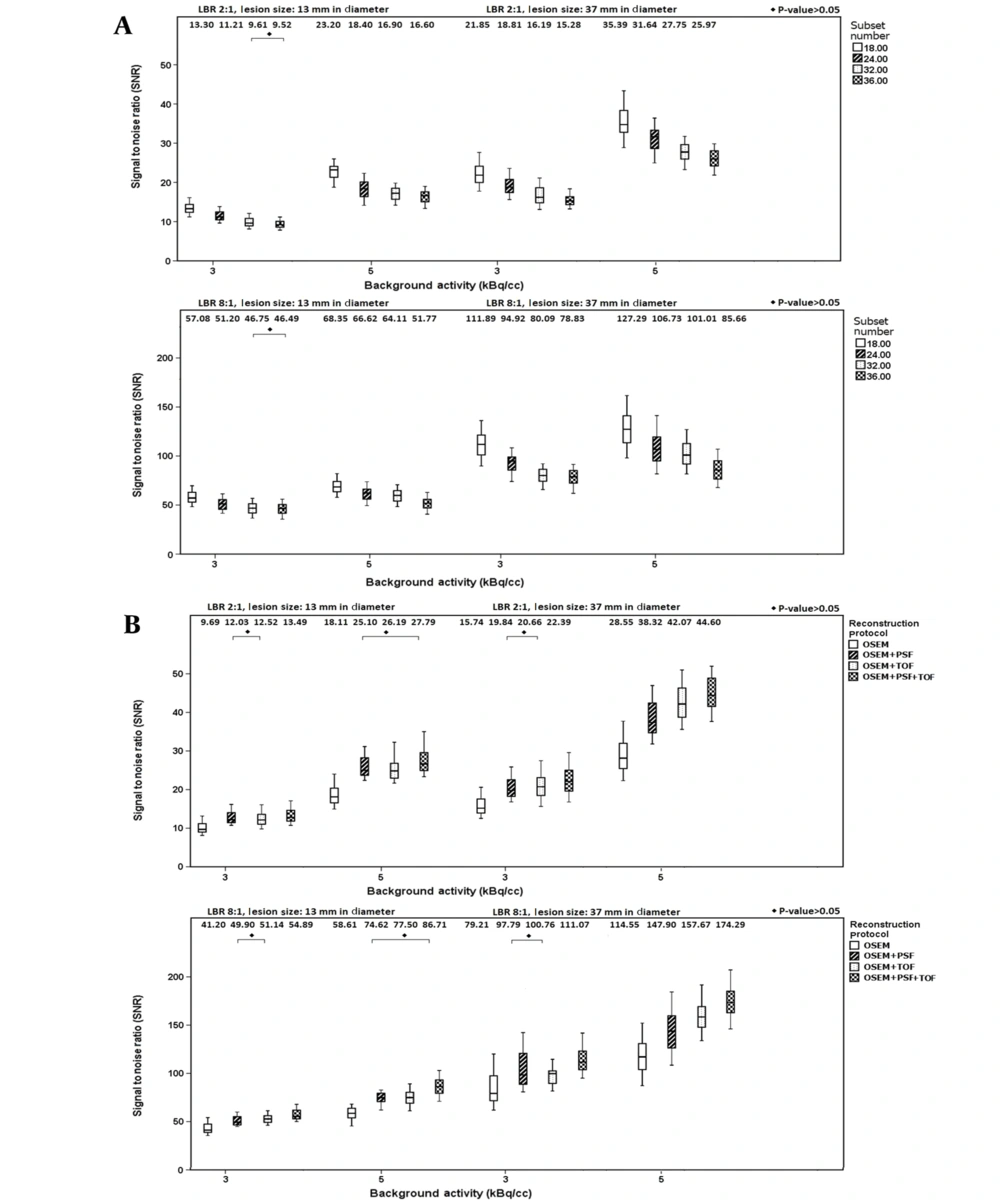
Figure 1A shows variations in SNR values for lesion sizes of 13 and 37 mm when using different subset numbers and filter sizes. According to this figure, by increasing the subset number, the SNR of different lesions increased at both LBRs (P < 0.05). At LBR of 2: 1, by increasing the subset number from 18 to 36, the percentage of relative differences in the median value were -28.42% (-30.06%) and -28.44% (-26.61%) at background activity concentrations of 3 and 5 kBq/cc for a sphere of 13 mm (37 mm), respectively. Additionally, at LBR of 8: 1, by increasing the subset number from 18 to 36, the percentage of relative differences of the median value were -18.55% (-29.54%) and -24.25% (-32.70%) at background activity concentrations of 3 and 5 kBq/cc for a sphere of 13 mm (37 mm), respectively. By increasing the background activity from 3 to 5 kBq/cc, the percentage of relative differences of the median value for a sphere of 13 mm (37 mm) were 74.43% and 74.36% (61.96% and 69.96%) for subset numbers of 18 and 36 respectively at LBR of 2: 1; nonetheless, at LBR of 8: 1, variations of 19.74% and 11.35% (13.76% and 8.66%) were reported, for subset numbers of 18 and 36 respectively.
Figure 1B presents the SNR values for lesion sizes of 13 and 37 mm when using different reconstruction protocols and subset numbers. According to this figure, the reconstruction protocol significantly influences the SNR of lesions (P < 0.05). At LBR of 2: 1, by changing the protocol from OSEM to OSEM + PSF + TOF, the median value of SNR increased by 39.25% (42.22%) and 53.45% (56.21%) for a lesion size of 13 mm (37 mm) at background activity concentrations of 3 and 5 kBq/cc, respectively. However, at LBR of 8: 1, by changing the protocol from OSEM to OSEM + PSF + TOF, the median value of SNR increased by 33.22% (40.22%) and 48.94% (52.15%) for a lesion size of 13 mm (37 mm) at background activity concentrations of 3 and 5 kBq/cc, respectively.
Table 1 presents the COV values and percentage of relative differences of COV by increasing the subset number from 18 to 36. For all reconstruction protocols, the COV value decreased for smaller subset numbers, higher background activity concentrations, and larger smoothing filter sizes. According to Table 1, by increasing the subset number from 18 to 36, at a background activity of 3 kBq/cc (5 kBq/cc), variations in the relative percentage difference of COV were 42.01 - 44.06% (47.96 - 51.49%), 55.66 - 55.76% (57.59 - 59.14%), 46.16 - 47.71% (48.71 - 53.36%), and 54.61 - 56.29% (59.39 - 65.33%) for the OSEM, OSEM + PSF, OSEM + TOF, and OSEM + PSF + TOF reconstruction protocols, respectively. The relative differences of COV were greater at higher background activity concentrations and smaller post-smoothing filter sizes.
| Subset number | 18 | 36 | Percentage of relative difference | |||
|---|---|---|---|---|---|---|
| Reconstruction protocol and background activity (kBq/cc)/ filter size (mm) | 3 | 5 | 3 | 5 | 3 | 5 |
| OSEM | ||||||
| 4.5 | 9.35 | 5.34 | 13.47 | 8.09 | 44.06 | 51.49 |
| 5.5 | 8.46 | 4.80 | 12.16 | 7.19 | 43.73 | 49.79 |
| 6.5 | 7.83 | 4.42 | 11.12 | 6.54 | 42.01 | 47.96 |
| OSEM + PSF | ||||||
| 4.5 | 8.68 | 4.70 | 13.52 | 7.48 | 55.76 | 59.14 |
| 5.5 | 7.96 | 4.41 | 12.32 | 6.98 | 54.77 | 58.27 |
| 6.5 | 7.33 | 4.15 | 11.19 | 6.54 | 52.66 | 57.59 |
| OSEM + TOF | ||||||
| 4.5 | 8.76 | 5.64 | 12.94 | 8.65 | 47.71 | 53.36 |
| 5.5 | 7.66 | 4.87 | 11.23 | 7.28 | 46.60 | 49.48 |
| 6.5 | 6.78 | 4.27 | 9.91 | 6.35 | 46.16 | 48.71 |
| OSEM + PSF + TOF | ||||||
| 4.5 | 8.10 | 4.99 | 12.66 | 8.25 | 56.29 | 65.33 |
| 5.5 | 7.23 | 4.41 | 11.23 | 7.15 | 55.32 | 62.13 |
| 6.5 | 6.50 | 3.94 | 10.05 | 6.28 | 54.61 | 59.39 |
Abbreviations: COV, Coefficient of variation; LBR, lesion-to-background ratio; OSEM, ordered subset expectation maximization; PSF, point spread function; TOF, time of flight.
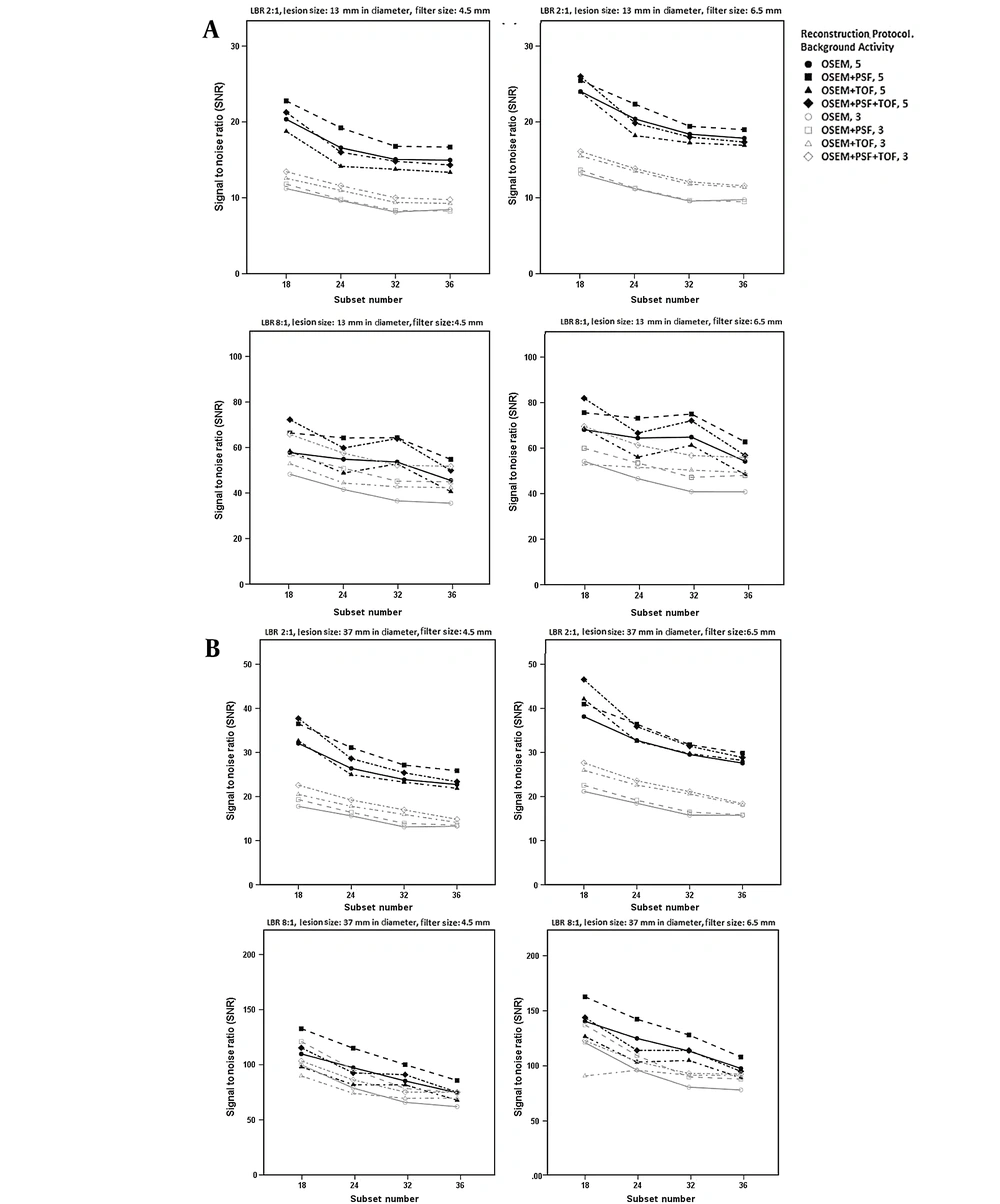
Figure 2 presents the correlation of SNR with the subset number using different reconstruction protocols at various LBRs and filter sizes of 4.5 and 6.5 mm. Overall, for both LBRs of 2: 1 and 8: 1, higher SNRs were reported for higher background activity concentrations, smaller subset numbers, and larger smoothing filter sizes. For LBRs of 2: 1 and 8: 1, at a background activity of 3 kBq/cc, an increase in the subset number (18 → ≥ 24) reduced the SNR for all reconstruction protocols. For a background activity of 5 kBq/cc, an increase in the subset number (18 → ≥ 24) showed significant variations in the SNR values in the TOF protocols (OSEM + TOF and OSEM + PSF + TOF) compared to the OSEM and OSEM + PSF protocols.
The signal-to-noise ratio (SNR) at subset numbers of 18, 24, 32, and 36 at lesion-to-background ratios (LBR) of 2: 1 (up) and 8: 1 (down) and background activity concentrations of 5 and 3 kBq/cc using filter sizes of 4.5 mm (left) and 6.5 mm (right) for lesions with diameters of A, 13 mm; and B, 37 mm
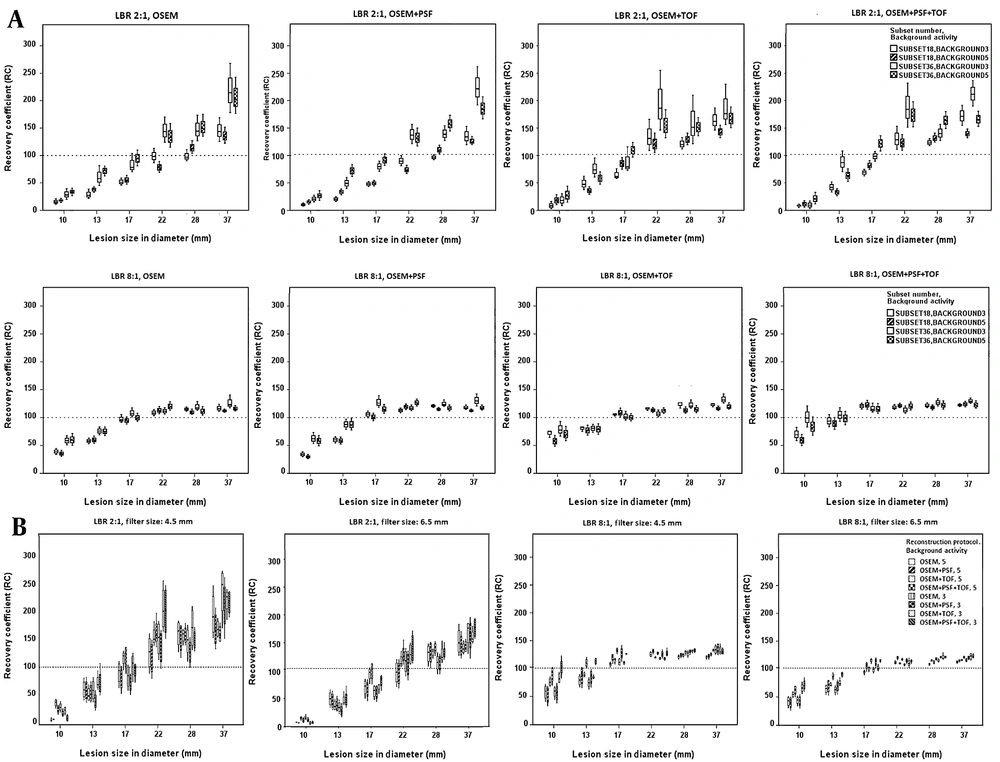
Figure 3A presents the box-and-whisker plot for the RC values when using different reconstruction protocols with subset numbers of 18 and 36. Higher subset numbers could lead to higher RC values at LBR of 2: 1 for all protocols and lesion sizes. It should be emphasized that greater RC variations were observed at low background activity concentrations versus high background activity concentrations. On the other hand, greater variations, along with an increase in the RC value, were apparent for larger lesion sizes (22, 28, and 37 mm) in all protocols. The OSEM + TOF and OSEM + PSF + TOF protocols showed higher detectability for small lesion sizes (13 and 17 mm) compared to other protocols at LBR of 8: 1. Overall, higher subset numbers showed higher RC values at LBR of 8: 1.
The box-and-whisker plot of recovery coefficient (RC) values for different lesion sizes and lesion-to-background ratios (LBRs) using different reconstruction protocols at various background activity concentrations and subset numbers (A), as well as RC values at different lesion sizes and LBRs using different subset numbers, background activity concentrations, and reconstruction protocols for filter sizes of 4.5 and 5.5 mm (B)
The effects of different reconstruction protocols and subset numbers on the RC values were evaluated at various background activity concentrations and LBRs, with filter sizes of 4.5 and 6.5 mm (Figure 3B). For all lesion sizes, higher RC values, in addition to significant variations, were observed for a low LBR, low background activity, and smaller filter size. More caution was taken to choose an appropriate subset number and filter size, especially for small lesions at a low background activity and LBR of 2: 1.
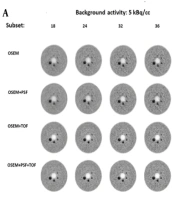
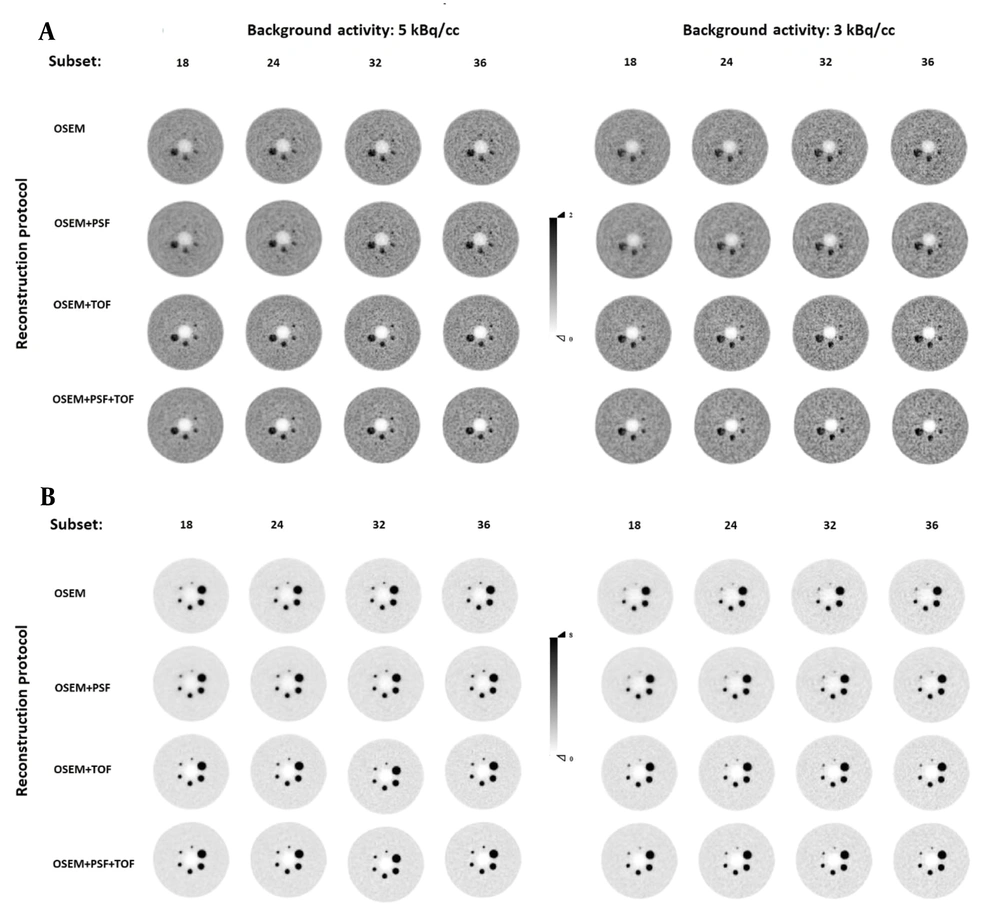
The transverse view of the in-house large-body phantom (35 cm in diameter) was appraised at LBRs of 2: 1 and 8: 1 and two background activity concentrations by three nuclear medicine specialists, who were blinded to the reconstruction protocols. According to Figure 4, the lesion detectability increased with an increase in the subset number, and the COV also increased in all reconstruction protocols. Among different reconstruction protocols, superior detectability was observed for LBR of 8: 1 at a background activity of 5 kBq/cc, where all lesion sizes were visible. Also, lesion sizes of 10 and 13 mm were visible and became even more detectable with an increase in the subset number in OSEM and OSEM + PSF protocols at a background activity concentration of 3 kBq/cc.
The transverse view of the in-house large phantom at lesion-to-background ratios (LBRs) of 2: 1 (A) and 8: 1 (B) at background activity concentrations of 5 kBq/cc (left) and 3 kBq/cc (right) reconstructed with a 5.5-mm full width at half maximum (FWHM) filter. Abbreviations: OSEM, ordered subset expectation maximization; PSF, point spread function; TOF, time of flight.
Generally, a higher image quality was observed in TOF protocols; the highest image quality was attributed to the OSEM + PSF + TOF protocol at all background activity concentrations and LBRs. None of the reconstruction algorithms could clearly visualize a lesion size of 10 mm at background activity concentrations of 3 and 5 kBq/cc at LBR of 2: 1. At a background activity concentration of 3 kBq/cc, a lesion size of 13 mm was not visible using the OSEM and OSEM + PSF protocols. Nonetheless, a lesion size of 17 mm could be hardly visualized in the OSEM and OSEM + PSF protocols, and lesions became visible by increasing the subset number.
5. Discussion
The PET image quality of overweight patients is deteriorated due to high photon attenuation, scattering, and noise levels (6, 27). Therefore, the present study aimed to evaluate the effects of different LBRs and background activity concentrations in an in-house, 35-cm phantom (for the simulation of overweight) to obtain the optimal subset number and post-smoothing filter when using TOF and PSF protocols to achieve a high image quality. The results showed that at both low and high LBRs and background activity concentrations, by increasing the subset number, the SNR decreased. For all subset numbers, SNR variations were observed, with a greater impact on larger lesion sizes at a high background activity, especially at LBR of 8: 1; however, these variations were less observed at higher subset numbers (Figure 1A). It is apparent that by increasing the background activity concentration, SNR enhancement was more significant at LBR of 2: 1 versus LBR of 8: 1 for all lesion sizes, with more impact on smaller lesion sizes and smaller subset numbers (Figure 1A and B).
It has been shown that intrinsic spatial resolution can be improved by increasing the background activity concentration in the NEMA phantom (26). By increasing the iteration × subset, significant variations were observed in intrinsic FWHM based on different protocols, with more impact at high LBRs. Additionally, greater variations were observed in spatial resolution at higher background activity concentrations and higher LBRs (26). Moreover, Matheoud et al. studied the detectability of lesions with different dimensions at different activity concentrations and LBRs (28). The results of visual detection indicated low image quality at low activity concentrations and low LBRs. They also found that it is unlikely to detect lesions with dimensions ≤ 6.5 mm at LBRs ≤ 21.2, lesions with dimensions ≤ 8.1 mm at LBRs ≤ 8.8, and lesions with dimensions ≤ 13 mm at LBRs ≤ 5.0 (28).
An increase in the COV can increase the false positive rate and lead to a reduction in specificity and positive predictive value (29). By increasing the activity concentration or emission scan duration, the noise value and contrast can be altered, leading to the enhancement of image quality in both phantom and clinical studies (28, 30). Morey and Kadrmas, by comparing the baseline maximum likelihood expectation maximization (MLEM) algorithm with OSEM, showed that the lesion-detection performance declined as the number of subsets increased (31). In a study by Taniguchi et al., by increasing the iteration number, the COV increased in both NEMA and large-body phantoms (6). The present results showed that by increasing the subset number from 18 to 36 in all reconstruction protocols, the COV significantly increased, as well, with more impact on a high background activity concentration (5 kBq/cc) and a smaller post-smoothing filter size (4.5 mm). Besides, the greatest variations in COV were observed in the OSEM + PSF + TOF protocol, followed by OSEM + PSF and OSEM + TOF reconstruction protocols, respectively (Table 1). The evaluation of subset number at various LBRs and background activity concentrations showed that at both low and high LBRs and background activity concentrations, by increasing the subset number, the COV of images also increased, while the SNR of lesions decreased.
Generally, the TOF information improves the detectability of small lesions (20), increases the SNR of low-contrast lesions (32, 33), and yields images with a higher contrast (27). In a study by Hashimoto et al. (20), the detectability of 10-mm spheres (or smaller) was superior in OSEM + TOF images compared to OSEM images. In the current study, the SNR value was superior in TOF protocols (OSEM + PSF + TOF and OSEM + TOF, especially OSEM + PSF + TOF) using both filter sizes at all lesion sizes, especially at LBR of 2: 1 and background activity concentration of 3 kBq/cc, with different subset numbers. However, the OSEM + PSF + TOF and OSEM + PSF protocols provided the best results for small and large lesions at a background activity concentration of 5 kBq/cc and LBR of 2: 1; they also provided the best results for all lesion sizes at LBR of 8: 1 at both low and high background activity concentrations (Figure 2).
In the present study, the effects of subset number and background activity on RC were apparent at LBR of 2: 1 for all lesion sizes and protocols, especially for larger lesion sizes (22, 28, and 37 mm) (Figure 3A). A higher RC was measured at a low background activity concentration, which increased rapidly with an increase in the subset number at LBR of 2: 1 for each lesion size, using different filter sizes. It should be emphasized that using an appropriate filter size can be important at LBR of 2: 1 for all lesion sizes and background activity concentrations, especially at higher subset numbers. According to previous investigations, more attention must be paid to the filter size at higher iteration × subset when using PSF protocols (26). Nonetheless, at LBR of 8: 1, the filter size is of great importance for lesion sizes of 10, 13, and 17 mm in OSEM and OSEM + PSF protocols and lesion sizes of 10 and 13 mm for OSEM + TOF and OSEM + PSF + TOF protocols (Figure 3A).
The RCs in the PSF method were non-monotonic in small subcentimeter lesions, which could lead to the misinterpretation of SUVs of lymph nodes in follow-ups; therefore, it is recommended to choose optimized reconstruction parameters (12). By increasing the lesion size from 10 to 37 mm in diameter, the RC value also increased. Besides, by increasing the LBR, the RC value increased, which is in line with the findings of a study by Gallivanone et al., that was done on a NEMA phantom and anthropomorphic oncological phantoms to determine the partial volume effect (PVE) on LBR (34); our results are also consistent with the findings of a study by Roghasch et al., evaluating patients with colorectal liver metastasis (35).
There were significant variations in the RC values for all lesion sizes at LBR of 2: 1, background activity concentrations of 3 and 5 kBq/cc, and filter sizes of 4.5 and 6.5 mm, with more impact at a background activity concentration of 3 kBq/cc, especially when using a filter size of 4.5 mm (Figure 3B). Less variation in the RC value was also observed in the OSEM + TOF and OSEM + PSF + TOF protocols. For lesion sizes of 10 and 13 mm, great caution was exercised to choose the proper subset number, especially when smaller filter sizes and low background activity concentrations were considered at LBR of 8: 1. However, the OSEM + TOF and OSEM + PSF + TOF protocols showed the least variations in the RC value for all lesion sizes.
In conclusion, the results of the present study revealed that subset numbers of 18 and 24 can be appropriate for all protocols, although a subset number of 32 can be also used for the OSEM and OSEM + PSF protocols. It is strongly recommended to choose TOF protocols for smaller lesion sizes (10, 13, and 17 mm), especially at LBR of 2: 1 at both low and high background activity concentrations and smaller filter sizes. Besides, at LBR of 8: 1, it is recommended to choose TOF protocols for lesion sizes of 10 and 13 mm at a low background activity concentration with a smaller filter size.
There were some limitations in this study. It is suggested to use larger phantom sizes, as well as phantoms with a diameter of 35 cm. It is also recommended to add different subcentimeter lesions to each phantom. For a comprehensive evaluation, future studies need to evaluate patients with a body mass index ≥ 25 kg/m2.
