1. Background
Temporomandibular joint disorders (TMDs) are the most common causes of non-odontogenic pain in the maxillofacial region, affecting between 28% and 86% of the adult population. They may involve abnormalities in the masticatory muscles, bones, ligaments, and nerves related to temporomandibular joints (TMJs). The TMJs withstand significant masticatory stress throughout the mastication process and are consequently of great importance (1-4). Internal derangement (ID) is an orthopedic term for a mechanical imperfection, which hinders the normal function of a joint. It is one of the most prevalent causes of TMDs (4-6). Internal derangement may alter the function of the joint and may subsequently cause morphological alterations in the surrounding tissue (7, 8). Disc displacement (DD) is the most common type of ID (9), which is frequently accompanied by symptoms, such as clicking, pain, and constrained mouth opening (10, 11).
Considering the high resolution of magnetic resonance imaging (MRI) in the detection of both hard and soft tissue disorders, as well as the location and morphological shape of the articular disc and adjacent structures, it is currently the modality of choice for the evaluation of TMDs, with approximately 95% accuracy (3, 12-14). Since the masticatory muscles are among anatomical structures involved in TMDs, their size and cross-sectional area often match their functions and may be influenced by TMDs (15). The relationship between joint structures and ID has been investigated in several studies, with contradictory results reported in different populations. Some studies reported a reduction in the dimensions of the masticatory muscles in TMD patients, while some others reported their hypertrophy in patients with ID (14, 16-18).
2. Objectives
Despite the existing controversies, MRI is the modality of choice for evaluating the masticatory muscles. The present study aimed to assess the correlation of masticatory muscle dimensions with TMJ ID using MRI.
3. Patients and Methods
This descriptive cross-sectional study was conducted on the TMJ MRI images of 145 patients, retrieved from the archives of an MRI diagnostic and research center during 2020 - 2021. The inclusion criteria were the MRI images of patients with ID of TMJ, including both TMJs, and the availability of MRI images in both open and closed mouth positions. The exclusion criteria were patients under 18 years, history of maxillofacial trauma or fracture, TMJ ankylosis, condylar hyperplasia, TMJ sclerosis, congenital maxillofacial anomalies, coronoid hyperplasia, neoplasm of TMJ or related structures (external ear and parotid gland), stuck disc, rheumatoid arthritis, bone marrow changes, and osteophytes.
3.1. Magnetic Resonance Imaging Acquisition
All examinations were performed on a 1.5 Tesla MRI scanner (MAGNETOM Avanto, Siemens Healthcare GmbH, Germany). In MRI, the sequences and imaging parameters were as follows for T1 coronal spin echo: Repetition time (TR) (msec)/echo time (TE) (msec)/number of excitations (NEX): 460/30/1; acquisition matrix size, 256 × 256; field of view, 160 × 160 mm; and slice thickness, 2.5 mm. Also, the MRI parameters for T1 sagittal spin echo sequences (for both right and left sides) were as follows: TR/TE/NEX: 544/15/2; acquisition matrix size, 256 × 512; field of view, 160 × 200 mm; and slice thickness, 2.0 mm. Additionally, the parameters for images acquired with sagittal T2-weighted spin echo restore sequence (for both right and left sides) were as follows: TR/TE/NEX, 2210/14/2; acquisition matrix size, 336 × 448; field of view, 180 × 180 mm; and slice thickness, 3.0 mm.
3.2. Image Analysis
A radiologist analyzed the MRI images of the patients in the obtained sequences. Initially, 229 participants were included in the study. Out of 229 patients, 23 had neoplasms and lesions in the joints or related structures. Twenty-one patients were only prepared in the open or closed mouth position, 17 patients had a stuck disc, nine cases had ankylosis, nine cases had rheumatoid arthritis, four cases had a history of trauma or fracture of the joints, and one case had a congenital anomaly; they were all excluded from the study according to the exclusion criteria. Finally, 145 samples of ID of TMJ, where the disc had an abnormal relationship with the condyle in the closed and open mouth positions, were included in the study (4). The MRI images were used to classify the patients into three main groups: (1) Normal disc position (NP); (2) disc displacement with reduction (DDR); and (3) disc displacement without reduction (DDWR). According to a study by Koh et al. (19), the disc position was classified as follows:
(1) NP: In the closed mouth position, the posterior band of the disc was located above the condylar head at a 12 o’clock position, and in the one-inch open mouth position, there was a thin intermediate zone between the condyle and the articular eminence.
(2) DDR: In the closed mouth position, the posterior band of the disc was located anteriorly to the 12 o’clock position, but the disc had a normal relationship with the condyle in the one-inch open mouth position.
(3) DDWR: In the closed and open mouth positions, the posterior band of the disc was located anteriorly relative to the condylar head.
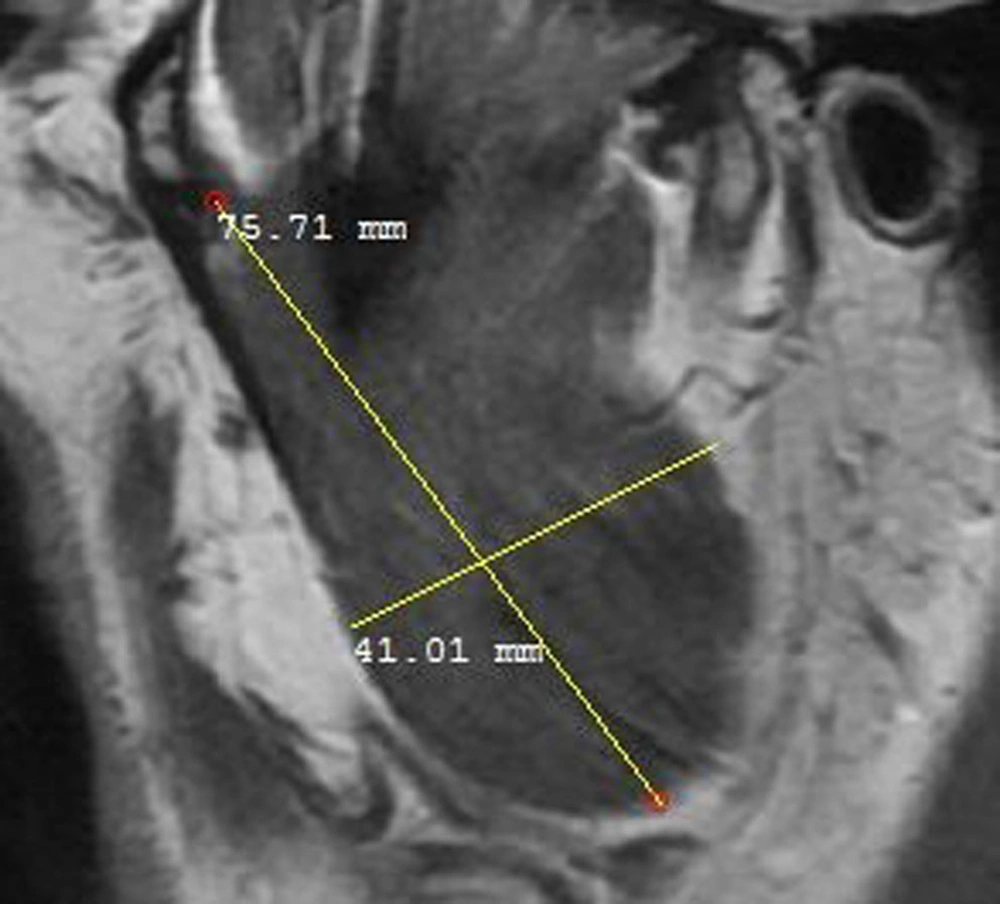
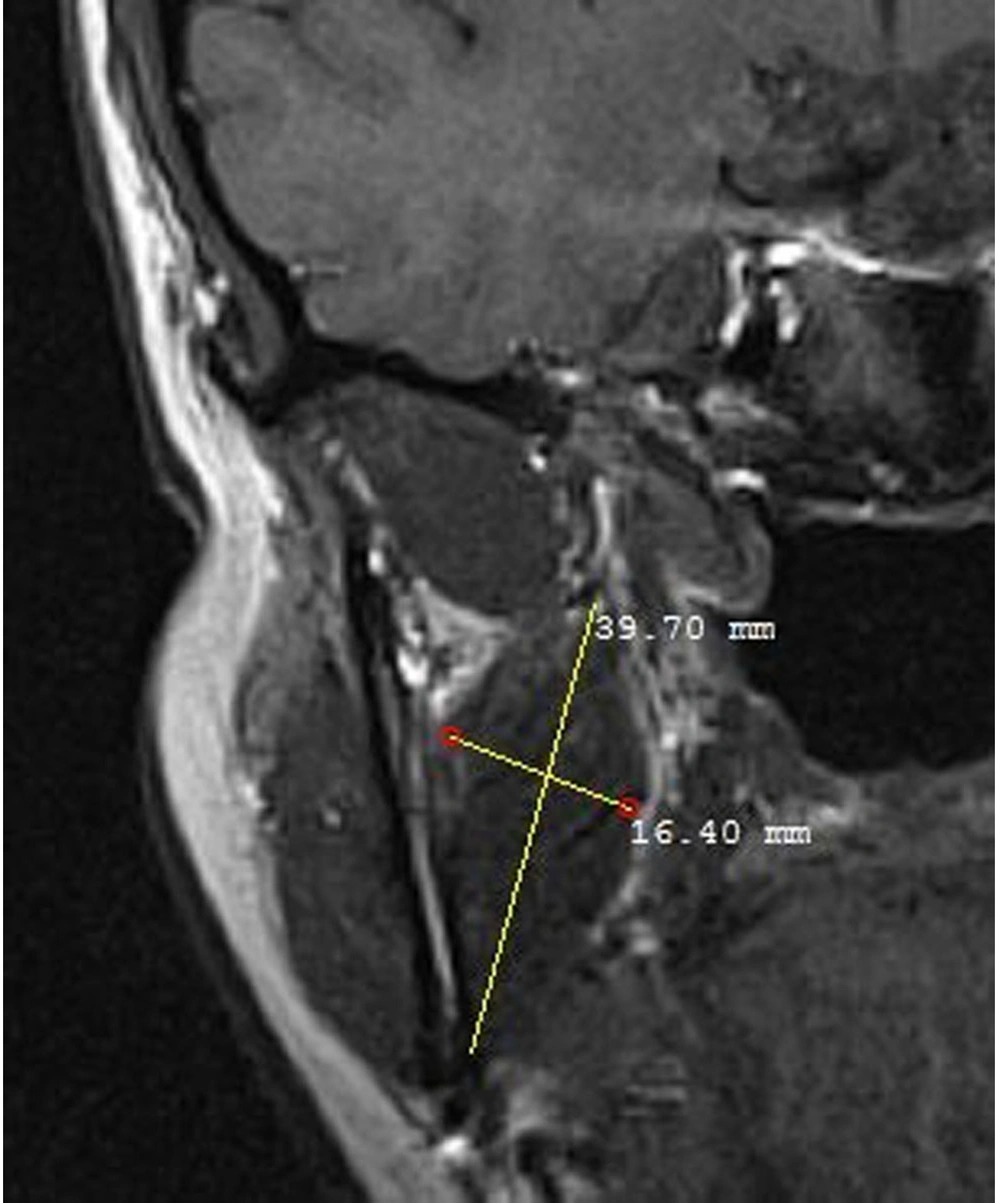
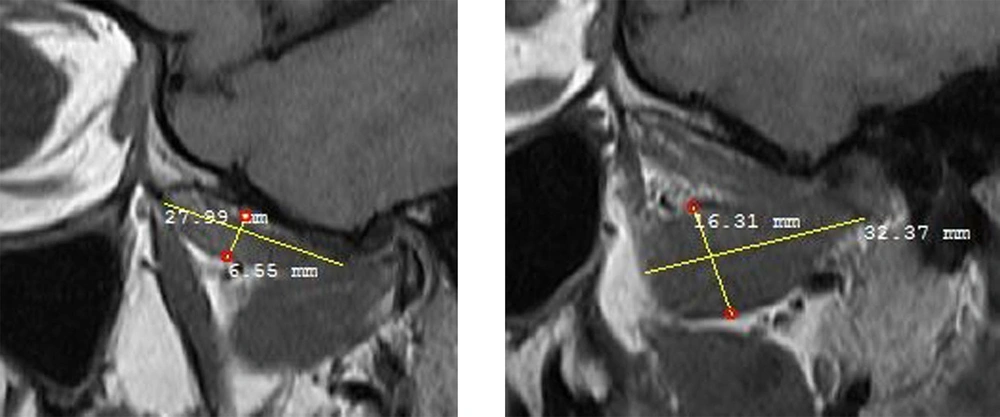
The three main muscles evaluated in this study were as follows: Height (superoinferior) and width (anteroposterior) of the masseter muscle; height (superoinferior) and length (anteroposterior) of the superior and inferior heads of the lateral pterygoid muscle; and height (superoinferior) and width (mediolateral) of the medial pterygoid muscle, measured on MRI images (in millimeters), using a Picture Archiving and Communication system (PACS).
The masseter muscle was evaluated in a sagittal open-mouth T1W sequence by measuring its height and width (Figure 1). The medial pterygoid muscle was also evaluated using the coronal T1W sequence by measuring its height and width (Figure 2). Besides, the lateral pterygoid muscle (superior and inferior heads) was evaluated by measuring its height and length in the sagittal T1W closed mouth position (Figure 3) (17). To increase the reliability of measurements, they were repeated twice and reexamined for possible associated anatomical features in the sagittal T2W sequence. Moreover, the maximum diameter of the muscles was selected by considering the anatomical landmarks. All measurements were presented in tables for further evaluation.
3.3. Statistical Analysis
For statistical analysis, t-test was used to assess significant differences in the dimensional changes of masticatory muscles between males and females. Also, Pearson’s correlation test was performed to examine the correlation of masticatory muscle dimensions with age. Additionally, one-way ANOVA test was performed to compare mean differences in the masticatory muscle dimensions between the three groups. Pairwise comparisons were carried out using Tukey’s post-hoc test. All statistical analyses were performed in SPSS version 26 (IBM Corp., released in 2019., IBM SPSS Statistics for Windows, Version 26.0, Armonk, NY, IBM Corp, USA). The significance level was set at α < 0.05.
4. Results
This study was performed on 145 patients (23.44% male) in the same age range. The male participants were 43.52 ± 20.38 years old, and the females were 39.66 ± 14.05 years old (P > 0.05). Table 1 presents the descriptive data of the masticatory muscle dimensions in terms of sex. All masticatory muscle dimensions were significantly greater in males than females (P < 0.05), except for the width of the medial pterygoid muscle (P = 0.064).
| Variables | Mean ± SD | P-value |
|---|---|---|
| Length of the inferior head of the lateral pterygoid muscle | 0.0003 a | |
| Females | 27.509 ± 4.1 | |
| Males | 30.771 ± 4.275 | |
| Height of the inferior head of the lateral pterygoid muscle | 0.0002 a | |
| Females | 15.833 ± 1.986 | |
| Males | 17.775 ± 2.2 | |
| Length of the superior head of the lateral pterygoid muscle | 0.000 a | |
| Females | 23.677 ± 3.412 | |
| Males | 27.16 ± 4.091 | |
| Height of the superior head of the lateral pterygoid muscle | 0.001 a | |
| Females | 5.729 ± 1.357 | |
| Males | 6.602 ± 1.359 | |
| Masseter muscle width | 0.036 a | |
| Females | 34.933 ± 3.144 | |
| Males | 36.442 ± 4.931 | |
| Masseter muscle height | 0.0003 a | |
| Females | 63.296 ± 5.308 | |
| Males | 67.937 ± 5.608 | |
| Height of the medial pterygoid muscle | 0.0004 a | |
| Females | 45.005 ± 6.136 | |
| Males | 50.386 ± 8.984 | |
| Width of the medial pterygoid muscle | 0.064 | |
| Females | 15.717 ± 2.207 | |
| Males | 16.616 ± 3.156 |
Abbreviation: SD, standard deviation.
a Statistically significant
Table 2 presents the central dispersion indices for the masticatory muscle dimensions in the NP, DDR, and DDWR groups. The results of one-way ANOVA showed significant differences between the NP, DDR, and DDWR groups regarding the height (P < 0.001) and length (P < 0.001) of the superior head of the lateral pterygoid muscle (P < 0.05). Pairwise comparisons using Tukey’s post-hoc test showed the highest height and length of the superior head of the lateral pterygoid muscle in the NP group, followed by the DDR and DDWR groups, respectively. According to the Pearson’s correlation coefficient, the height of the masseter muscle (r = 0.190, P = 0.022) and the medial pterygoid muscle (r = 0.166, P = 0.046) had significant positive correlations with age (Table 3).
| Variables | Mean ± SD | ANOVA P-value | Tukey’s SD P-value | ||
|---|---|---|---|---|---|
| Length of the inferior head of the lateral pterygoid muscle | 0.753 | ||||
| NP | 28.7 ± 4.29 | ||||
| DDR | 28.07 ± 3.81 | ||||
| DDWR | 28.13 ± 4.99 | ||||
| Height of the inferior head of the lateral pterygoid muscle | 0.093 | ||||
| NP | 16.59 ± 2.26 | ||||
| DDR | 16.56 ± 2.04 | ||||
| DDWR | 15.73 ± 2.24 | ||||
| Length of the superior head of the lateral pterygoid muscle | 0.001 a | ||||
| NP | 26.95 ± 3.57 | ||||
| DDR | 25.4 ± 3.26 | NP | DDR | 0.045 a | |
| DDWR | 21.39 ± 2.47 | DDWR | 0.001 a | ||
| Height of the superior head of the lateral pterygoid muscle | 0.0025 a | ||||
| NP | 6.55 ± 1.04 | DDR | DDWR | 0.0001 a | |
| DDR | 6.51 ± 1.37 | NP | DDR | 0.043 a | |
| DDWR | 4.78 ± 0.92 | DDWR | 0.001 a | ||
| Masseter muscle width | 0.846 | ||||
| NP | 35.56 ± 3.52 | DDR | DDWR | 0.0023 a | |
| DDR | 35.22 ± 3.89 | ||||
| DDWR | 35.12 ± 3.64 | ||||
| Masseter muscle height | 0.50 | ||||
| NP | 64.04 ± 6.68 | ||||
| DDR | 65.11 ± 5.75 | ||||
| DDWR | 63.88 ± 4.73 | ||||
| Height of the medial pterygoid muscle | 0.073 | ||||
| NP | 48.36 ± 7.35 | ||||
| DDR | 45.75 ± 7.69 | ||||
| DDWR | 45.04 ± 6.35 | ||||
| Width of the medial pterygoid muscle | 0.365 | ||||
| NP | 15.9 ± 2.76 | ||||
| DDR | 16.27 ± 2.58 | ||||
| DDWR | 15.58 ± 2.08 | ||||
Abbreviations: NP, normal reduction; DDR, disc displacement with reduction; DDWR, disc displacement without reduction; SD, standard deviation.
a Statistically significant
| Variables | Pearson’s correlation coefficient a | P-value |
|---|---|---|
| Length of the inferior head of the lateral pterygoid muscle | -0.052 | 0.534 |
| Height of the inferior head of the lateral pterygoid muscle | 0.084 | 0.317 |
| Length of the superior head of the lateral pterygoid muscle | 0.024 | 0.770 |
| Width of the superior head of the lateral pterygoid muscle | 0.055 | 0.510 |
| Masseter muscle height | 0.190 | 0.022 b |
| Masseter muscle width | -0.152 | 0.069 |
| Height of the medial pterygoid muscle | 0.166 | 0.046 b |
| Width of the medial pterygoid muscle | -0.118 | 0.159 |
a Significance level α = 0.05
b All Pearson’s coefficients are estimated for the masticatory muscle dimensions and age.
5. Discussion
This study assessed the correlation of masticatory muscle dimensions and TMJ ID using MRI. To the best of our knowledge, this is the first study to address the correlation of masticatory muscle dimensions with ID of TMJ using MRI. The results showed a significant difference between the NP, DDR, and DDWR groups regarding the height (P = 0.000) and length (P = 0.000) of the superior head of the lateral pterygoid muscle; both variables were significantly greater in the NP group, followed by the DDR and DDWR groups (P < 0.05). All masticatory muscle dimensions were significantly greater in males than females (P < 0.05), except for the width of the medial pterygoid muscle (P = 0.064), which suggested no sex differences. According to Pearson’s correlation coefficient, the height of the masseter (r = 0.190, P = 0.022) and medial pterygoid (r = 0.166, P = 0.046) muscles showed significant positive correlations with age.
In this regard, Duman et al. (17) reported that the length and width of the masticatory muscles reduced dramatically in TMD patients, resulting in muscular atrophy, which might cause limited jaw mobility. Due to restricted jaw mobility, the masticatory muscles may no longer operate within their normal range, leading to their long-term atrophy. Also, the length of the masseter muscle, the superior head of the lateral pterygoid muscle, and the medial pterygoid muscle on both sides, along with the width of the masseter and medial pterygoid muscles on the left side, were significantly shorter in TMD patients compared to the control group. In the present study, the height and length of the superior head of the lateral pterygoid muscle were significantly larger in the NP group compared to the DDR and DDWR groups, which is contrary to the findings of the study by Duman et al. (17). This discrepancy may be attributed to the fact that the inclusion criteria for TMDs in the study by Duman et al. did not include cases of ID and DD, and only patients with mouth opening restrictions were included (17). On the other hand, in the current study, TMD patients were classified into three main groups: NP, DDR, and DDWR. Besides, the sample size of the study by Duman et al. was smaller than that of our study (17).
Additionally, in a study by Melke et al., a total of 24 patients with anterior DD, TMJ effusion, and abnormal discs were evaluated (20). They found that the superior head of the lateral pterygoid muscle was smaller than its inferior head on both sides in both open and closed mouth positions (20). Moreover, in the open mouth position, the total volume of the lateral pterygoid muscle and its inferior head on both sides was substantially lower than that of the closed mouth position. Sex had a significant effect on the muscle volume, namely, the superior head of the lateral pterygoid muscle.
In line with the results of a study by Melke et al., the current study revealed that males had larger muscle dimensions than females, except for the width of the medial pterygoid muscle (20). Moreover, in our study, the height and length of the superior head of the lateral pterygoid muscle were significantly greater in the NP group compared to the DDR and DDWR groups. However, Melke et al. did not include a control group and did not differentiate patients with DD, TMJ effusion, and abnormal disc (20). They neither disclosed the type of anterior DD and only compared open and closed mouth positions (20).
Additionally, Hasan and Abdelrahman reported that the probability of effusion and degenerative modifications of the joint increased dramatically by increasing the anterior DD (18). They reported that the degree of anterior DD was strongly associated with the thickening of the lateral pterygoid muscle attachments and retrodiscal tissue abnormalities. It may be assumed that both atrophy and hypertrophy of the masticatory muscles result in muscular dysfunction. In the current study, there was a possible correlation between the ID of TMJs and masticatory muscle measurements. However, future longitudinal studies are suggested to investigate the effects of various treatments for ID on the structure and function of masticatory muscles.
In conclusion, significant correlations were found between the height and length measurements of the superior head of the lateral pterygoid muscle and ID of TMJs.


