1. Background
In recent years, magnetic resonance imaging (MRI) of the wrist joint for evaluation of its pathologies has been developed. In this imaging modality, depiction of disorders such as ligamentous and tendon injuries, osteonecrosis, osteoarthritis, and synovial effusion is quite possible. The resolution and contrast of MR images are better for visualization of the anatomical structure of the wrist joint in comparison with the other imaging modalities. In addition, its role in the diagnosis of neoplastic, infective, carpal tunnel syndrome (CTS), and triangular fibrocartilage complex (TFCC) disorders has been shown (1).
In previous studies, the important role of MRI in the diagnosis of TFCC lesions has been approved. For many years, visualization of TFCC lesions, arthrography was done which was both invasive and expensive and its application was limited to some special cases. However, it is suggested to utilize the new MRI pulse sequences or the optimized routine ones for diagnosis of TFCC and wrist lesions (2).
TFCC is the most frequent lesion of the wrist joint with non-specific clinical findings. All kinds of distal radial and ulnar fracture and dislocations are able to make injuries and tearing of TFCC. Studies show that TFCC lesions are also important in the evaluation of wrist pain. So, the imaging method is important for both radiologists and orthopedic surgeons in order to visualize the TFCC lesion. However, the complicated and smaller structures like ligaments and TFCC are under investigation (3).
2. Objectives
In this study, we used T2BLADE, PD BLADE, and 3D T2SPACE pulse sequences in the MRI of the wrist joint, especially for TFCC and we compared it to the current pulse sequences quantitative analysis. These MRI protocols were selected because there are some pulsation and motion artifacts in the wrist area. BLADE and SPACE may eliminate them. Therefore, the signal to noise ratio (SNR) and contrast to noise ratio (CNR) would probably increase and visualization of the anatomical structures of the wrist including TFCC may improve.
3. Patients and Methods
3.1. Study Subjects
Our study was done in Imam Khomeini hospital. 3 Tesla-Trio-Siemense MRI machine and circular 3 inches coil was used. In this cross sectional study, twenty patients with a history of wrist trauma or suspected wrist lesions were referred by orthopedic hand surgeons. Ten men and ten women in the age range of 22 to 40 years (mean, 28 years) were enrolled. All patients were imaged in prone position while their wrist was at the center of the magnet (isocenter) and the wrist area was covered by coil and the other upper limb was parallel to the body. The list of used pulse sequences are shown in Table 1. All sequences were performed in coronal section with a fixed Field of view (FOV). Parallel imaging was not utilized in the sequences.
| Pulse Sequence | T1FSE | T2 FSE FS | PDFSE | T2 BLADE | PDBLADE | 3D T2 SPACE |
|---|---|---|---|---|---|---|
| Parameters | ||||||
| Imaging Direction | Coronal | Coronal | Coronal | Coronal | Coronal | Coronal |
| TR (ms) | 830 | 3000 | 3000 | 3500 | 3200 | 1000 |
| TE (ms) | 22 | 77 | 20 | 67 | 52 | 45 |
| Flip Angle (degree) | 150 | 150 | 150 | 160 | 160 | 120 |
| Echo train length | 3 | 18 | 10 | 16 | 13 | 215 |
| field of view (mm) | 100 | 100 | 100 | 120 | 120 | 120 |
| Matrix | 256 × 204 | 256 × 204 | 256 × 204 | 320 × 320 | 320 × 320 | 320 × 320 |
| Section Thickness (mm) | 3 | 3 | 3 | 3 | 3 | 0.6 |
| Intersection Gap (mm) | 0.3 | 0.3 | 0.3 | 0.3 | 0.3 | 0 |
| Number of Sections | 15 | 15 | 15 | 15 | 15 | 80 |
| Band Width (Hz/pixel) | 256 | 256 | 256 | 256 | 256 | 434 |
| Number of Signal Acquisition | 2 | 3 | 1 | 1 | 1 | 1.6 |
| Phase Direction | L-R | L-R | L-R | F-H | F-H | F-H |
| Acquisition Time (S) | 120 | 116 | 107 | 173 | 190 | 360 |
Pulse Sequence Parameters
3.2. Quantitative Analysis
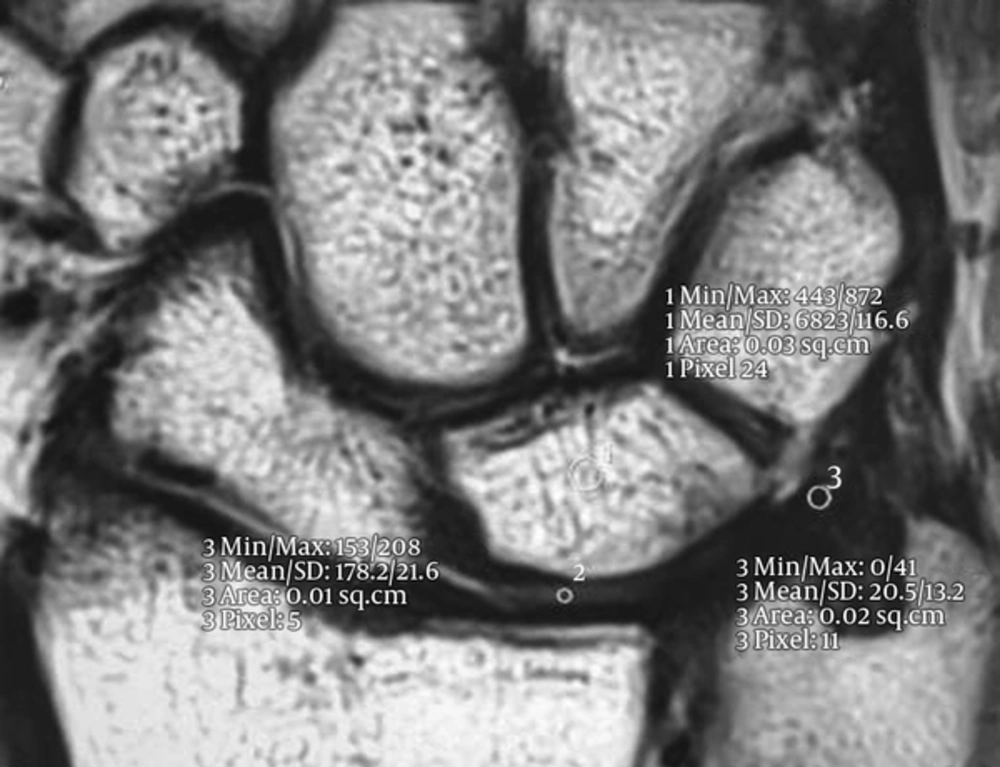
In quantitative analysis, two criteria including SNR and CNR were used to compare all pulse sequences. In each sequence, SNR was earned by locating the region of interest (ROI) on lunate (center of bone), TFCC and cartilage (between radius and ulna) and another ROI beyond the anatomical area on the air outside the wrist, to calculate the air standard deviation (Figure 1).
The size of ROI and the section of study was fixed in all the sequences.
Size of ROI for lunate: 3 mm2;
Size of ROI for TFCC: 2 mm2;
Size of ROI for cartilage: 1 mm2.
SNR was calculated by the following Formula 1:

SI = signal intensity; N = standard deviation.
CNR was calculated by subtracting the average signal intensity of two areas divided by air standard deviation based on the following Formula 2-4


C = cartilage; B = bone; T = TFCC.
3.3. Data Analysis Method
Normality of all variables was evaluated by using Kolmogorov-Smirnov test. If the data were normally distributed, comparison of CNR and SNR between different sequences was accomplished by repeated measure ANOVA. Post hoc comparison between different groups was done after Bonferroni correction. If the data were not normally distributed, the Friedman test was used for comparison of the variables between different groups. We assessed twenty patients in different protocols twice in a 14-day time period. Then we assessed intra observer reliability by intraclass correlation coefficient. All coefficients were higher than 0.8. All P-values lower than 0.05 were considered as statistically significant. SPSS ver. 18 were used for statistical analysis (SPSS Inc. Released 2009. PASW Statistics for Windows, Version 18.0. Chicago, Ill, USA).
4. Results
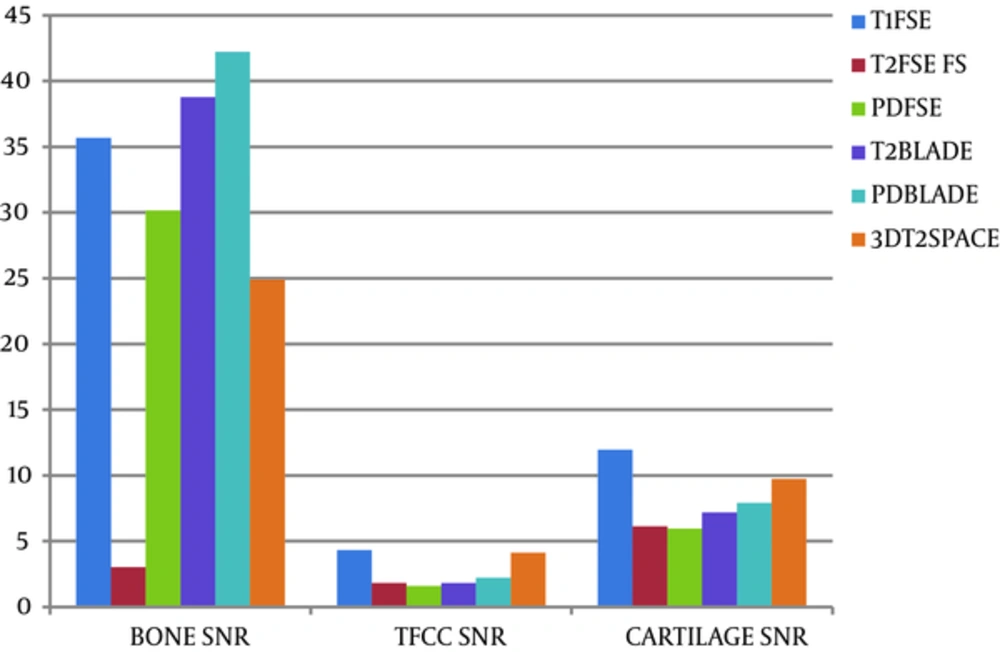
The results of comparison of SNR in TFCC, cartilage and bone within all sequences are shown in Figure 2.
SNR of bone in PD BLADE in comparison with the other sequences was significant (P < 0.001).
SNR of TFCC in T1 FSE and 3D T2SPACE in comparison with the other sequences was higher (P < 0.001). SNR of cartilage in T1 FSE in comparison with the other sequences was better (P < 0.001).
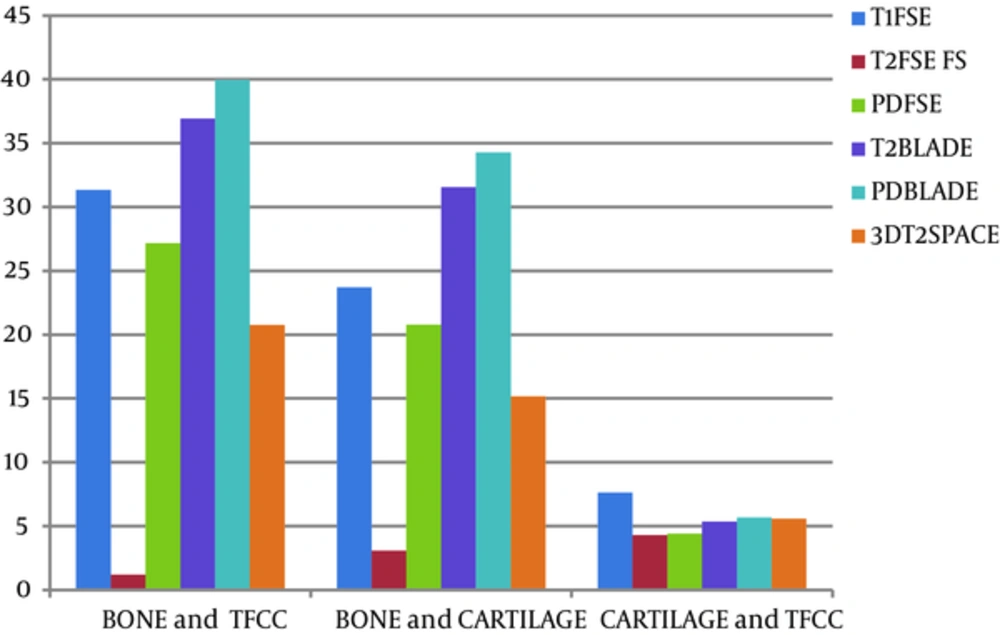
Post hoc test for comparison of different MRI sequences were accomplished and the data are mentioned in Table 2 and 3. The results of comparison between averages CNR, bone with TFCC, bone with cartilage, cartilage with TFCC are depicted in Figure 3. Comparison of CNR between bone and TFCC shows that CNR in T2 BLADE and PD BLADE sequences are better in comparison with the other sequences (P < 0.001). Evaluation of CNR between bone and cartilage in different sequences shows that there is a significant difference between PD BLADE and the other sequences, which shows that this sequence has higher CNR (P < 0.001). CNR between cartilage and TFCC reiterated that T1 FSE in comparison with the other sequences has higher CNR, but the value of differences was clinically small (P < 0.001).
| Physical Parameters | Anatomical Location | Sequences | P value |
|---|---|---|---|
| SNR | Bone | G2 < [G1 = G3 = G4] | P < 0.001 |
| G2 < G5 < G6 [G3 = G4] | |||
| TFCC | [G2 = G3 = G4 = G6] < [G1 = G5] | P < 0.001 | |
| Cartilage | [G2 = G3 = G4 = G6] < G1 | P<0.001 | |
| G1 = G5 | |||
| G2 < G5 | |||
| CNR | Bone, TFCC | G2 < G1 | P < 0.001 |
| G2 < G3 | |||
| G2 < G4 | |||
| G2 < G5 | |||
| G2 < G6 | |||
| G3 = G4 | |||
| G5 < G3 | |||
| G5 < G4 | |||
| G5 < G6 | |||
| Bone, Cartilage | G2 < G1 | P < 0.001 | |
| G2 < G3 | |||
| G2 < G4 | |||
| G2 < G5 | |||
| G2 < G6 | |||
| G5 < G3 | |||
| G5 < G4 | |||
| G5 < G6 | |||
| Cartilage, TFCC | G4 < G1 | P < 0.001 |
Comparison of Mean Signal to Noise Ratio (SNR), Contrast to Noise Ratio (CNR) in Different MRI Sequencesa
| Physical Parameters | Anatomical Location | T1 FSE | T2 FSE FS | PD FSE | T2 BLADE | PD BLADE | 3D T2 SPACE |
|---|---|---|---|---|---|---|---|
| SNR | Bone | 35.66 ± 12.02 | 3.04 ± 2.29 | 30.16 ± 15.10 | 38.76 ± 14.30 | 42.21 ± 20.06 | 24.91 ± 13.35 |
| TFCC | 4.32 ± 2.10 | 1.83 ± 1.69 | 1.60 ± 1.20 | 1.83 ± 1.41 | 2.23 ± 1.75 | 4.14 ± 2.77 | |
| Cartilage | 11.95 ± 3.90 | 6.14 ± 4.42 | 5.96 ± 3.70 | 7.19 ± 4.73 | 7.91 ± 4.74 | 9.73 ± 4.89 | |
| CNR | Bone, TFCC | 31.34 ± 12.10 | 1.21 ± 1.48 | 27.18 ± 13.25 | 36.93 ± 13.20 | 39.97 ± 18.62 | 20.77 ± 10.9 |
| Bone, Cartilage | 23.71 ± 11.29 | 3.09 ± 3.40 | 20.78 ± 11.32 | 31.57 ± 11.51 | 34.29 ± 17.50 | 15.17 ± 8.62 | |
| Cartilage, TFCC | 7.63 ± 2.67 | 4.31 ± 3.78 | 4.41 ± 2.65 | 5.36 ± 3.82 | 5.68 ± 4.38 | 5.59 ± 2.60 |
Average of Signal to Noise Ratio and Contrast to Noise Ratio in Different Sequencesa
5. Discussion
MRI has been considered as the best imaging modality for wrist lesions due to its considerable contrast resolution and the ability to obtain images in every three anatomical planes. MRI has a higher sensitivity and specificity compared to other modalities. In recent studies, it is shown that higher magnetic field like 3T make it possible to obtain images with higher resolution and SNR with higher sensitivity and specificity (4).
The earned information of wrist MRI is quite necessary for the surgeon to manage patient treatment. Due to the small anatomical structures of the wrist joint, the diagnosis of lesions is a challenge. Some new sequences with higher resolution and SNR have been introduced (5).
In our study, we evaluated SNR and CNR of T2 BLADE, PD BLADE, and 3D T2SPACE in comparison with 2D FSE sequences.
BLADE and SPACE is in the same group as Fast spin echo, but they have differences in K-SPACE filling and pulse sequence characteristics such as the type and number of RF pulses with other routine FSE sequences.
In BLADE sequence, the K-SPACE is filled radially while filling of K-SPACE is linear. It causes more filling of central lines of K-SPACE and then SNR would increase and motion artifact would remarkably decrease.
SPACE sequence uses different rotation angles and variable flip angles and limited T2 suppression (which is caused due to prolonged echo train length). Therefore, images with optimized contrast and uniform resolution and lower blurring artifact are produced.
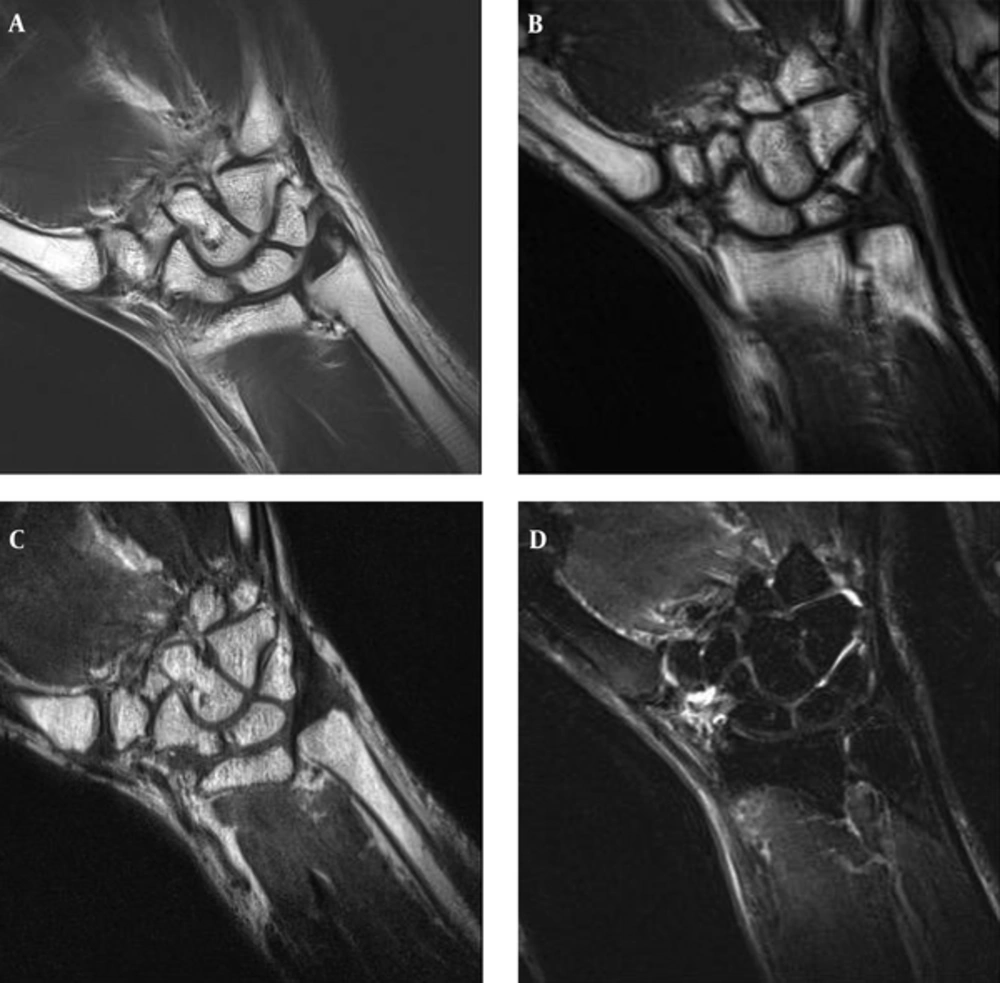
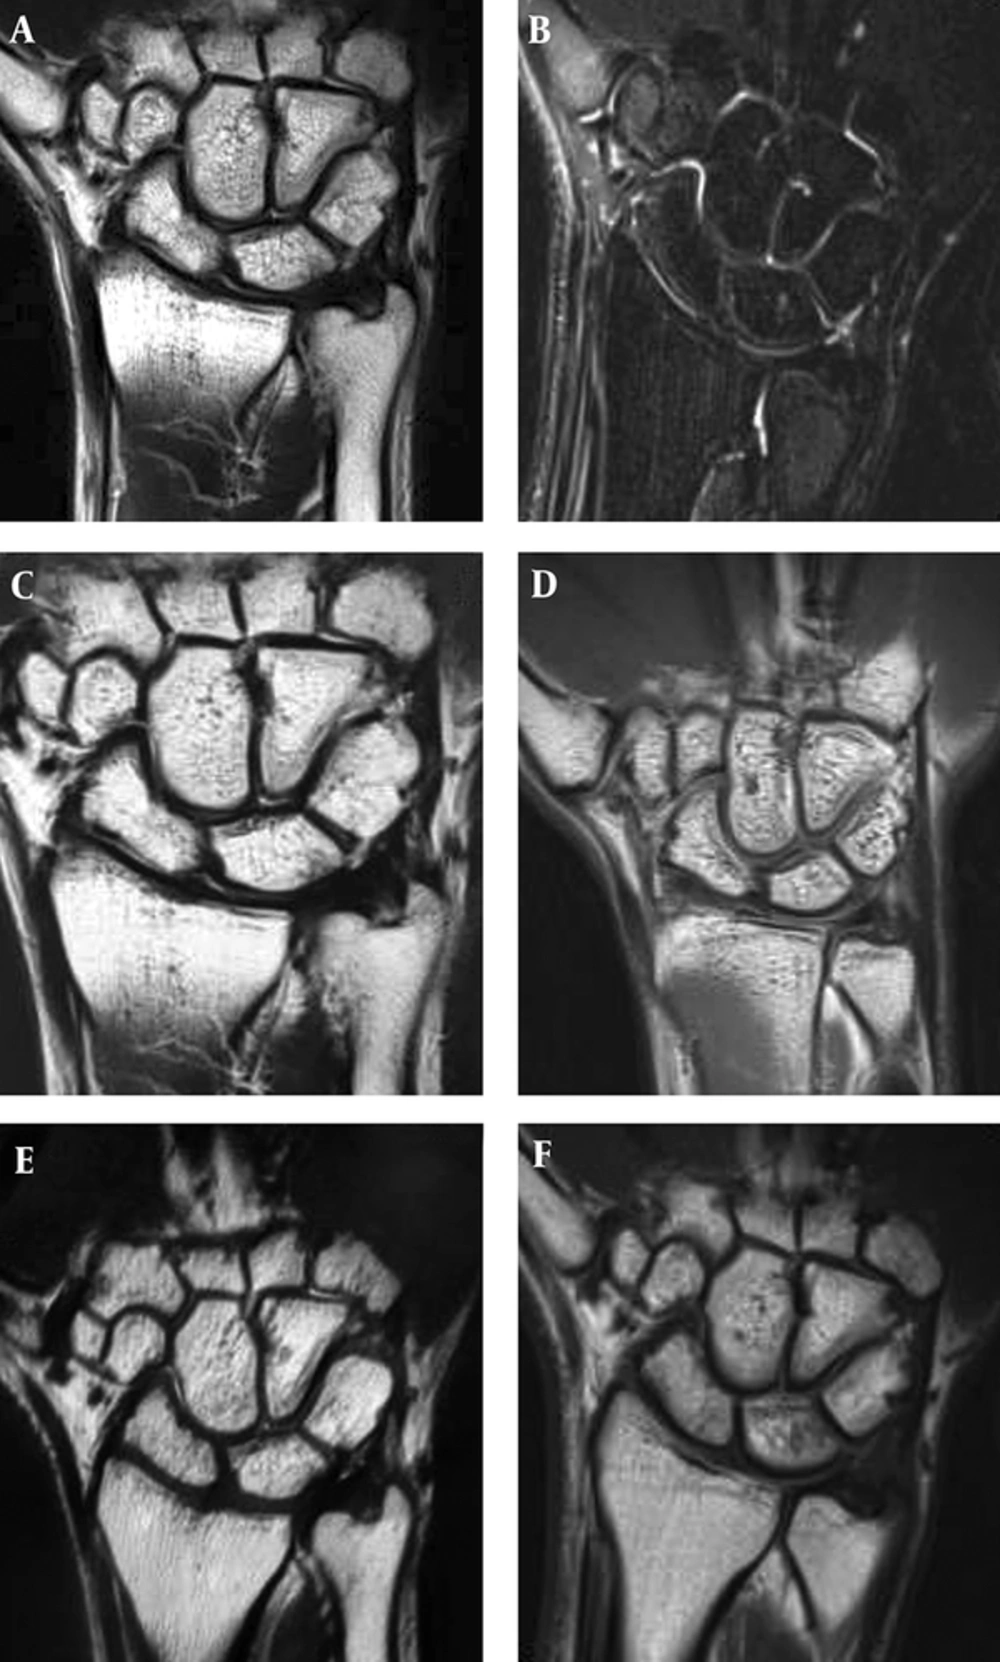
Our study shows that T2 BLADE and PD BLADE in comparison to FSE sequence would significantly produce images with remarkable lower motion artifact and improved image quality (Figure 4). SNR of nearly all cases was higher. Moreover, the study of CNR in different tissues (bone, cartilage, and TFCC) shows that CNR between bone-cartilage and bone-TFCC in T2 and PD BLADE was higher than FSE sequences.
Generally, in previous studies, the comparison of SNR and CNR in 2D and 3D images were different and controversial. In a previous study conducted by Lenk et al. (6), which was done on 2D, 3D MEDIC with a 3T MRI scanner shows that these sequences are suitable in the diagnosis of CTS and TFCC disorders (4). Another study carried out by Bittersohl et al. (7) suggested to use magnetic field of higher than 1.5T for better evaluation of small anatomical structures of the wrist joint. In another study performed by Jung et al. (8) in 2013 with a 3T scanner on the wrist joint, they compared isotropic 3D-turbo spin echo and 3D fast field echo (FFE) with 2D turbo spin echo. Their investigation showed that image quality of 2D sequence in comparison with 3D isotropic sequences in evaluating cartilages and TFCC is better in 2D sequences. In a study carried out by Crema et al. (9) in 2013 on osteoarthritis knee joint showed that SNR of 3D FSE (SPACE) in comparison with 2D FSE is higher and thus more reliable for diagnosis and determining the extension of osteoarthritis.
In our study, the sequences of BLADE and SPACE were compared with current protocols on wrist joint structures with 3Tscanner. 2D FSE sequences are susceptible to pulsation artifacts while the BLADE sequence has direct effect on reducing flow and motion artifact (Figure 5). Changing the phase encoding can realign the motion artifact direction, but it would not be able to eliminate it. SPACE sequence increases the SNR and CNR due to its 3D nature (that increases the volume data), its small pixel size (that improves resolution) and its variable flip angle and decrease of proton saturation. It is expected that increased SNR and decreased artifacts causes better visualization of anatomical structures (especially in small structures) and increased CNR causes better differentiation of anatomical structures in which results in better diagnosis of pathologies. In fact, here we have shown primarily that these sequences could be useful in wrist pathologies and further studies will show diagnostic efficacy of these protocols in this regard.
Our research had some limitations. The examination time was long and some patients were not cooperative enough. We had no multi-channel coil and therefore, parallel imaging was not achievable in order to decrease scan time.
For other investigations, we suggest qualitative comparison of 3D T2SPACE, T2 BLADE, and PD BLADE with current protocols in other pathological disorders of the wrist joint.
