


1. Background
The widespread use of high-resolution computed tomography (HRCT) in lung cancer screening has increased the detection rate of pulmonary ground-glass nodules (GGNs), and this has attracted extensive attention (1). Ground-glass nodules are divided into 2 categories based on the presence of solid components: Pure GGNs (pGGNs) and mixed GGNs (mGGNs). Each category of GGN has a nonspecific presentation in the imaging. Research in recent years has reported that mGGNs are primarily malignant, and the proportion of solid components of mGGNs is positively correlated with the tumorigenesis of lung cancer (2). Interestingly, some GGNs may resolve spontaneously during follow-ups; however, they are not all pGGNs and can also be mGGNs. Inflammatory diseases (eg, chronic mucosal inflammation and granulomatous lesions), focal interstitial fibrosis (tuberculosis), and alveolar hemorrhage also manifest as pGGNs or mGGNs (3).
According to the classification of GGNs, atypical adenomatous hyperplasia (AAH), adenocarcinoma in situ (AIS), and inflammatory nodules are classified as benign GGNs, while minimally invasive adenocarcinoma (MIA) and invasive adenocarcinoma (IAC) are classified as malignant GGNs (4). Therefore, it is important to clinically determine the nature of nodules and initiate appropriate treatment, particularly for the diagnosis and management of malignant nodules. Computed tomography features (such as GGN size, proportion of solid components, and CT values) have been reported for the diagnosis of GGNs of different natures. These features are particularly useful for diagnosing adenocarcinoma-based GGNs (5). Previous studies have been based on retrospective analyses of GGN characteristics in each subtype. Artificial intelligence (AI) systems do not have a completely satisfactory method for CT feature extraction of whole nodules (6).
A commercially available AI pulmonary nodule auxiliary detection and diagnosis software package was used in the current study. The AI system was developed based on deep learning (DL) techniques (7, 8). In brief, 2 convolutional neural networks (CNN) were trained on over 10 000 chest CT scans to realize the detection of pulmonary nodules. The 2 CNN models are Faster R-CNN (Faster Region-Based Convolutional Neural Network) and DenseNet. Faster R-CNN is a DL algorithm for object detection, which is used to detect and classify target objects in images. DenseNet is a DL network structure characterized by the interconnection between layers, which helps to improve the feature transfer efficiency and model performance of the network. Through this combined method, the efficiency and accuracy of lung CT image analysis are improved (8).
Relying on annotated chest CT images via the consensus of 3 experienced radiologists, the CNN models were well-trained to detect pulmonary nodules. The AI system has been clinically validated to be efficient and valuable in many medical centers (9, 10). HRCT was combined with an AI and computer-aided diagnosis (AI-CAD) system that has been basically automated in clinical applications used to predict the nature and malignant risk rate of GGNs.
The employed AI system could also predict the probability of malignancy for the detected pulmonary nodules. Particularly, another DL model was trained on chest CT in patients who underwent lesion resection and obtained pathological results. Deep learning algorithms use pathological results as the gold standard for model training, learn the benign and malignant characteristics of pulmonary nodules, and integrate the surrounding microenvironment characteristics for comprehensive analysis. The trained model outputs the probability of malignancy as a percentage, that is, the probability that each lung nodule is predicted to be malignant. According to Chen et al, in the prediction of benign and malignant pulmonary nodules, if the DL model outputs a probability of malignancy greater than 50%, the nodules will be classified as malignant. On the contrary, if the DL model outputs a probability of malignancy less than or equal to 50%, the nodules are classified as benign (11). The malignancy probability prediction function was previously proven to be effective in differentiating lung cancer with different invasiveness. Radiologists performed manual film reading without knowing the pathological results, which is a traditional method of film reading.
2. Objectives
This study aimed to compare the accuracy of AI systems and radiologists in the diagnosis of benign and malignant GGNs. In addition, the present study investigated HRCT and AI to analyze the CT features of GGNs to improve the prediction of benign and malignant pulmonary GGNs.
3. Patients and Methods
3.1. Patients
This study was conducted by the First Affiliated Hospital of Xinjiang Medical University (Changji, Xinjiang, China) and approved by the ethics committee of the hospital. Furthermore, a total of 198 patients were recruited following the guidelines outlined in the fifth edition of the World Health Organization (WHO) Classification of Thoracic Tumors, which was released in April 2021. All patients signed written informed consent before participating in the study.
Benign or malignant GGN cases confirmed by pathological examination were collected from February 2017 to August 2022. The inclusion criteria for this study were patients with (1) GGN manifestations and (2) complete clinical data. The exclusion criteria of this study were patients with (1) < 3 mm or > 30 mm GGNs in the CT images and (2) poor CT image quality that would affect the subsequent evaluation of the nodules. Finally, 198 patients with 204 GGNs were included in this study.
3.2. Computed Tomography Examination
After inspiration, all patients were scanned from the thoracic inlet to the lung bases in full inspiration using a Gemstone Spectral CT Scanner (Discovery HD750, General Electric Company, Boston, MA). The CT inspection parameters included a 110- to 120-kV tube voltage, a 50- to 150-mA tube current, 1.0 spacing, a 0.625-mm collimator, a 0.5-second rotation time, a 1.0-mm or 0.625-mm reconstruction thickness, and a 1.0-mm or 0.625-mm reconstruction interval.
3.3. Analysis of the Computed Tomography Features
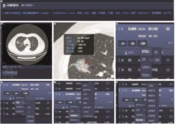
Two senior radiologists who were blinded to clinical and pathological data independently reviewed the images. They used Inferred Lung 3.0 Viewer software (Inferred Medical Technology Co, Ltd, China) to jointly review the film and measure quantitative parameters. Two radiologists manually extract regions of interest. They analyzed the CT features of each lesion, including GGN density (pGGNs or mGGNs), diameter, volume and CT value, internal structure of nodules (such as vacuole sign, air bronchogram, spiculation sign [short and thin, short and thick, tall and thin, and tall and thick], and lobulation sign [superficial and deep]) and surrounding structures (boundaries of GGN [clear and blurry], vascular convergence sign, vascular perforator sign, pleural indentation, and interlobular septal obstruction sign). In cases where there is inconsistency in the diagnosis of benign and malignant pulmonary nodules, a consultation diagnosis is conducted according to the diagnostic criteria outlined in the Chinese Expert Consensus on Diagnosis and Treatment of Pulmonary Nodules (2018 Edition) (12), and consensus is reached through consultation. The lung window setting used a window width of 1500 Hounsfield units (HU) and a window level of 600 HU. The mediastinal window setting used a window width of 350 HU and a window level of 40 HU. The CT images of all patients were sent to the AI-CAD system (Inferred Lung 3.0, Presumption Medical Technology Co, Ltd, China) to automatically evaluate the CT features of each GGN (Figure 1A-G). These features included the lesion size (short and long diameters), mean CT value, GGN density (pGGNs or mGGNs), margin (such as lobulation sign and spiculation sign; Figure 1D-E), internal structure of nodules (such as vacuole sign and air bronchogram; Figure 1F), and surrounding structures (air bronchogram sign, pleural indentation sign, vascular convergence sign, and vascular perforator sign; Figure 1G). The AI system automatically calculates the predicted malignant probability of GGN (benign GGN: < 50%; malignant GGN: ≥ 50%; Figure 1B).
. A and B, A 56-year-old man with a mixed GGN of the anterior segment of the right upper lobe of the lung, with a size of about 2.8 × 2.2 cm, a CT value of 606 23 HU, a volume of 5058.2 mm<sup>3</sup>, and a malignant probability of 90.27%. C, The region of interest extraction (indicated by blue circle), lobation (indicated by red arrow), and spiculation (indicated by blue arrow). Artificial intelligence automatically extracts features such as D, morphology; E, margin; F, internal structures; and G, surrounding structures.")
Artificial intelligence automatically screens pulmonary ground-glass nodules (GGNs). A and B, A 56-year-old man with a mixed GGN of the anterior segment of the right upper lobe of the lung, with a size of about 2.8 × 2.2 cm, a CT value of 606 23 HU, a volume of 5058.2 mm3, and a malignant probability of 90.27%. C, The region of interest extraction (indicated by blue circle), lobation (indicated by red arrow), and spiculation (indicated by blue arrow). Artificial intelligence automatically extracts features such as D, morphology; E, margin; F, internal structures; and G, surrounding structures.
3.4. Pathological Data
The pulmonary nodules included in the grouping are mainly diagnosed by pathology, including surgical pathology or puncture pathology. The lesions were fixed with paraformaldehyde and embedded in paraffin. Hematoxylin and eosin staining and immunohistochemical staining were performed after sectionalization. Classification and classification statistics were carried out according to the pathological classification method of the lung adenocarcinoma subtype published by the WHO in 2021 (4).
Histopathological sections of the GGNs of all patients were read by 2 pathologists. Any discrepancies were resolved through consensus to determine the nature of the nodules. According to the pathological results, AAH, AIS, and other benign GGNs (eg, inflammatory granuloma, tuberculosis, echinococcosis, and hamartoma) were classified as group A; in addition, MIA, IAC, and other malignant GGNs (eg, squamous cell carcinoma, adenoid cystic carcinoma, and small-cell lung carcinoma) were classified as group B. Using the pathological diagnosis as the gold standard, we calculated the diagnostic accuracy of the AI system and radiologists’ reports of the CT images as the number of GGNs with the correct diagnosis/total number of GGNs.
3.5. Statistical Analysis
The measurement data (eg, patient’s age, GGN size, and CT value) were presented as mean ± SD, and these were compared between groups using an independent t test. The qualitative data were presented as numbers or percentages and compared between groups using the chi-square test. Logistic regression analysis was performed on the variables with statistical differences. The receiver operating characteristic (ROC) curves of the combined variables were prepared using SPSS version 23 (IBM Corp. Released 2015. IBM SPSS Statistics for Windows, Version 23.0. Armonk, NY: IBM Corp.). P values less than 0.05 were considered statistically significant.
4. Results
4.1. Patient Clinical Features and CT Features of Benign and Malignant GGNs
This study included a total of 198 patients (mean age of 58.71 ± 11.36 years ranging from 26 to 86 years) that consisted of 98 males (mean age of 59.14 ± 11.31 years ranging from 26 to 86 years) and 100 females (mean age of 58.29 ± 11.45 years ranging from 29 to 82 years). There was a total of 204 GGNs. There were 69 GGNs in group A (which consisted of 8 cases of AAH, 14 cases of AIS, and 47 cases of other benign GGNs), as well as 135 GGNs in group B (which consisted of 15 cases of MIA, 112 cases of IAC, and 8 cases of other malignant GGNs; Table 1 and Figure 2A-C ).
| Variables | Group A | Group B | OR (95%CI) | 2/t | P | ||||||
|---|---|---|---|---|---|---|---|---|---|---|---|
| Toal | AAH (n=8) | AIS (n=14) | Other (n=47) | Toal | MIA (n=15) | IAC (n=112) | Other (n=8) | ||||
| Sex | 2.986 | >0.005 | |||||||||
| Male | 40 | 7 | 8 | 25 | 61 | 5 | 48 | 8 | |||
| Female | 29 | 1 | 6 | 22 | 74 | 10 | 64 | 0 | |||
| Age | 56.62 ± 12.29 | 59.50 ± 10.0 | 56.00 ± 6.92 | 56.32 ± 13.88 | 59.78 ± 10.74 | 54.6 ± 13.09 | 60.04 ± 10.21 | 66.00 ± 10.09 | -1.892 | >0.05 | |
| Diameter (mm) | |||||||||||
| Long | 15.72 ± 9.09 | 10.44 ± 2.38 | 12.65 ± 5.66 | 17.55 ± 10.05 | 18.73 ± 7.91 | 11.18 ± 4.26 | 20.06 ± 7.33 | 14.20 ± 11.63 | -1.892 | 0.016 | |
| Short | 12.45 ± 7.91 | 7.76 ± 3.53 | 10.44 ± 6.30 | 13.84 ± 8.51 | 15.06 ± 7.14 | 8.99 ± 3.33 | 16.23 ± 6.76 | 10.01 ± 10.02 | -2.386 | 0.018 | |
| Volume (mm3) | 380.78 ± 805.39 | 400.27 ± 385.00 | 843.01 ± 589.53 | 3307.92 ± 5899.51 | 847.71 ± 929.79 | 4163.10 ± 7283.18 | -5.740 | <0.001 | |||
| Mean CT value (HU) | -615.54 ± 101.36 | -629.63 ± 113.22 | -607.50 ± 97.48 | -485.56 ± 173.67 | -547.93 ± 190.77 | -457.55 ± 186.69 | -4.648 | <0.001 | |||
| Vacuole sign | 7 (22.32) | 1 | 4 | 2 | 59 (43.68) | 7 | 52 | 0 | 0.441 (1.06-1.22) | 23.50 | <0.001 |
| Lobulated sign | 0.150 (0.06-0.34) | 0.750 | 0.387 | ||||||||
| Superficial a | 19 (32.13) | 3 | 8 | 8 | 76 (62.87) | 11 | 64 | 1 | |||
| Deep a | 3 (8.79) | 0 | 0 | 3 | 23 (22.68) | 1 | 20 | 2 | |||
| Air bronchogram sign | 7 (19.27) | 2 | 3 | 2 | 50 (37.72) | 2 | 45 | 3 | 0.211 (0.9-0.50) | 14.28 | <0.001 |
| Vascular convergence sign | 14 (30.78) | 1 | 7 | 6 | 77 (60.22) | 4 | 72 | 1 | 0.198 (0.10-0.39) | 24.01 | <0.001 |
| Vascular perforator sign | 18 (32.48) | 7 | 10 | 1 | 78 (63.53) | 7 | 70 | 1 | 0.264 (0.14-0.51) | 18.41 | <0.001 |
| Pleural indentation sign | 16 (29.76) | 2 | 3 | 11 | 72 (58.24) | 2 | 68 | 2 | 0.264 (0.14-0.51) | 16.916 | <0.001 |
| Interlobular septal obstruction sign a | 9 (16.57) | 1 | 7 | 1 | 40 (32.43) | 5 | 35 | 0 | 0.356 (0.16-0.79) | 6.883 | <0.01 |
| Tumor-lung interface a | 0.676 (0.26-1.77) | 0.642 | 0.423 | ||||||||
| Clear | 61 (62.57) | 6 | 10 | 45 | 124 (122.43) | 14 | 59 | 51 | |||
| Vague | 8 (6.43) | 1 | 4 | 3 | 11 (3.26) | 1 | 10 | 0 | |||
| Spiculated sign | 0.294 (0.07-4.37) | 24.529 | <0.001 | ||||||||
| Short and thin a | 17 (20.63) | 1 | 2 | 14 | 44 (40.36) | 5 | 36 | 3 | |||
| short and thick a | 5 (10.15) | 0 | 2 | 3 | 25 (19.85) | 2 | 22 | 1 | |||
| Tall and thin a | 9 (14.88) | 1 | 2 | 6 | 35 (29.12) | 0 | 35 | 0 | |||
| tall and thick a | 3 (3.04) | 0 | 0 | 3 | 6 (5.96) | 0 | 6 | 0 | |||
| Density | 1.081 (0.50-2.34) | 0.039 | 0.843 | ||||||||
| pGGN | 12 (11.5) | 6 | 6 | 0 | 22 (12.57) | 5 | 15 | 2 | |||
| mGGN | 57 (57.5) | 2 | 8 | 47 | 113 (112.5) | 10 | 97 | 6 | |||
Comparison of Patients’ Information and Ground-Glass Nodule Imaging Features Between the 2 Groups of Benign Lesions and Malignant Lesions
 and benign ground-glass nodules (GGNs) (groups A): A, Vacuole sign, air bronchogram sign, vascular perforation sign, pleural indentation sign, vascular convergence sign, and interlobular septal obstruction sign CT features of GGNs in groups A and B. B, GGN margins (clear or blurry), degree of lobulation (deep or superficial), and GGN density (pure GGNs or mixed GGNs) in groups A and B. C, Spiculation (short and thick, short and thin, tall and thick, or tall and thin) of GGNs in groups A and B.")
Different imaging findings among malignant (groups B) and benign ground-glass nodules (GGNs) (groups A): A, Vacuole sign, air bronchogram sign, vascular perforation sign, pleural indentation sign, vascular convergence sign, and interlobular septal obstruction sign CT features of GGNs in groups A and B. B, GGN margins (clear or blurry), degree of lobulation (deep or superficial), and GGN density (pure GGNs or mixed GGNs) in groups A and B. C, Spiculation (short and thick, short and thin, tall and thick, or tall and thin) of GGNs in groups A and B.
4.2. Comparison of the Size, Volume, CT Value, and Features of GGNs
As shown in Table 1, the nodule size (long diameter and short diameter) was significantly larger in group B than in group A (P < 0.05; Figure 3A and B). In addition, the volume of the invasive lesions (MIA/IAC) was larger than that of precursor adenopathy (AAH/AIS), with a significant difference in the average CT values (P < 0.01; Figure 3C and D).
. Volume and mean CT values in atypical adenomatous hyperplasia/adenocarcinoma in situ vs minimally invasive adenocarcinoma/invasive adenocarcinoma subgroups (C and D). * P < 0.05 and ** P< 0.01, significant differences between groups. Comparison of imaging measurements between different groups: Short diameter and long diameter in malignant and benign groups (A and B). Volume and mean CT values in AAH/AIS versus MIA/IAC sub AAH/AIS versus MIA/IAC sub--groups (C and D). * Groups (C and D). * PP < 0.05, and ** < 0.05, and ** PP < 0.01, significant < 0.01, significant differdifferences between groups.ences between groups.")
Comparison of imaging measurements between different groups: Short diameter and long diameter in malignant and benign groups (A and B). Volume and mean CT values in atypical adenomatous hyperplasia/adenocarcinoma in situ vs minimally invasive adenocarcinoma/invasive adenocarcinoma subgroups (C and D). * P < 0.05 and ** P< 0.01, significant differences between groups. Comparison of imaging measurements between different groups: Short diameter and long diameter in malignant and benign groups (A and B). Volume and mean CT values in AAH/AIS versus MIA/IAC sub AAH/AIS versus MIA/IAC sub--groups (C and D). * Groups (C and D). * PP < 0.05, and ** < 0.05, and ** PP < 0.01, significant < 0.01, significant differdifferences between groups.ences between groups.
The interlobular septal obstruction sign (Figure 4A and B), vascular perforator sign (Figure 4C and D), air bronchogram sign (Figure 4E and F), pleural indentation sign (Figure 4G and H), vacuole sign (Figure 4I), vascular convergence sign (Figure 4J), and spiculation (Figure 4M to P) in group B were more frequent than the same features in group A (P < 0.01; Table 1).
 in the upper lobe of the right lung, with the red arrow indicating the sign of interlobular septal obstruction. B, Representative image of hematoxylin and eosin staining confirming invasive adenocarcinoma (IAC) pathologically (H&E, ×40). C, Representative CT image showing a pure ground-glass nodule (pGGN) in the lower lobe of the right lung, with the red arrow indicating the sign of vascular penetration. D, Representative image of hematoxylin and eosin staining confirming IAC pathologically (H&E, ×40). E, Representative CT image showing a mGGN in the upper lobe of the right lung, with the red arrow indicating the sign of air bronchogram. F, Representative image of hematoxylin and eosin staining confirming IAC pathologically (H&E, ×40). G, Representative CT image showing a mGGN in the upper lobe of the left lung, with the red arrow indicating the sign of pleural indentation. H, Representative image of hematoxylin and eosin staining confirming IAC pathologically (H&E, ×40). I - P, Representative CT images showing the sign of vacuole, the sign of vascular convergence, the sign of superficial lobulation, the sign of deep lobulation, the sign of short and thin spiculation, the sign of short and thick spiculation, the sign of tall and thin spiculation, the sign of tall and thick spiculation, with the red arrow indicating the sign in each panel.")
A, Representative CT image showing a mixed ground-glass nodule (mGGN) in the upper lobe of the right lung, with the red arrow indicating the sign of interlobular septal obstruction. B, Representative image of hematoxylin and eosin staining confirming invasive adenocarcinoma (IAC) pathologically (H&E, ×40). C, Representative CT image showing a pure ground-glass nodule (pGGN) in the lower lobe of the right lung, with the red arrow indicating the sign of vascular penetration. D, Representative image of hematoxylin and eosin staining confirming IAC pathologically (H&E, ×40). E, Representative CT image showing a mGGN in the upper lobe of the right lung, with the red arrow indicating the sign of air bronchogram. F, Representative image of hematoxylin and eosin staining confirming IAC pathologically (H&E, ×40). G, Representative CT image showing a mGGN in the upper lobe of the left lung, with the red arrow indicating the sign of pleural indentation. H, Representative image of hematoxylin and eosin staining confirming IAC pathologically (H&E, ×40). I - P, Representative CT images showing the sign of vacuole, the sign of vascular convergence, the sign of superficial lobulation, the sign of deep lobulation, the sign of short and thin spiculation, the sign of short and thick spiculation, the sign of tall and thin spiculation, the sign of tall and thick spiculation, with the red arrow indicating the sign in each panel.
4.3. Multivariate Logistic Regression Analysis
Multivariate logistic regression analysis results for predicting the malignancy of GGN based on lung CT features. According to logistic regression analysis, the prediction model included the following morphological characteristics: The GGN short and long diameters, vacuole sign, air bronchogram sign, vascular perforation sign, pleural indentation sign, vascular convergence sign, and interlobular septal obstruction sign. The regression model was logistic (P) = 3.167 - 1.075X3 (Vacuole sign)- 0.967X6(Vascular perforator sign)- 1.235X8 (Interlobular septal obstruction sign) (Table 2).
| Variables | B | Wald 2 | P-Value | Exp (B) | 95% CI for Exp (B) | |
|---|---|---|---|---|---|---|
| Lower | Upper | |||||
| X1 (long diameter) | 0.023 | 0.205 | 0.651 | 1.023 | 0.928 | 1.128 |
| X2 (short diameter) | 0.015 | 0.073 | 0.788 | 1.015 | 0.910 | 1.133 |
| X3 (vacuole sign) | 1.075 | 5.113 | 0.024 | 0.341 | 0.135 | 0.867 |
| X4 (air bronchogram sign) | 0.54 | 0.924 | 0.336 | 0.582 | 0.194 | 1.753 |
| X5 (vascular convergence sign) | 0.342 | 0.553 | 0.457 | 0.710 | 0.288 | 1.751 |
| X6 (vascular perforator sign) | 0.967 | 5.127 | 0.024 | 0.380 | 0.165 | 0.878 |
| X7 (pleural indentation sign) | 0.223 | 0.245 | 0.621 | 0.800 | 0.332 | 1.932 |
| X8 (interlobular septal obstruction sign) | 1.235 | 5.031 | 0.025 | 0.291 | 0.099 | 0.856 |
| Constant | 3.167 | 7.351 | 0.007 | 23.746 | ||
Multivariate Logistic Regression Analysis for Prediction of Malignancy in Ground-Glass Nodules Based on Lung Computed Tomography Features
The efficacy of each model in the differential diagnosis of benign and malignant lung ground-glass lesions was examined using the ROC curve analysis, the results of which are shown in Table 3. The sensitivity, specificity, positive predictive value (PPV), negative predictive value (NPV), and area under the curve (AUC) of the combined model were higher than those of each of the 2 groups (manual and AI-determined methods), and the diagnostic performance of the combined model was relatively good (Table 3 and Figure 5).
| Variables | Cutoff Point | P-Value | Sensitivity | Specificity | PPV | NPV | AUC | 95% CI |
|---|---|---|---|---|---|---|---|---|
| The AI system model | 0.618 | 0.001 | 0.756 | 0.696 | 0.837 | 0.318 | 0.771 | 0.705-0.837 |
| The radiologists model | 0.695 | 0.001 | 0.726 | 0.783 | 0.881 | 0.667 | 0.804 | 0.743-0.866 |
| The combined model | 0.637 | 0.001 | 0.768 | 0.793 | 0.933 | 0.783 | 0.833 | 0.775-0.891 |
Diagnostic Performance of the Logistic Regression Model Based on the Receiver Operating Characteristic Curve Analysis for Diagnosis of Malignancy in Lung Ground-Glass Lesions
 curves of the logistic regression models (AUC, area under the curve)")
The receiver operating characteristic (ROC) curves of the logistic regression models (AUC, area under the curve)
4.4. Comparison of the Results of AI System and Radiologists’ Reports of Images
The AI system classified 44 benign GGNs (with 22 cases of incorrect diagnosis) and 160 malignant GGNs (with 47 cases of incorrect diagnosis). In the radiologists’ reports of CT images, 62 benign GGNs were classified as group A (with 16 cases of incorrect diagnosis) and 142 malignant GGNs (with 23 cases of incorrect diagnosis). The combined models classified 63 benign GGNs (with 9 cases of incorrect diagnosis) and 141 malignant GGNs (with 15 cases of incorrect diagnosis; Table 4).
| Variables | AI System | Radiologist | Combine | Pathology | |||
|---|---|---|---|---|---|---|---|
| Malignant | Benign | Malignant | Benign | Malignant | Benign | ||
| Benign GGN | 47 | 22 | 23 | 46 | 15 | 54 | 69 |
| Malignant GGN | 113 | 22 | 119 | 16 | 126 | 9 | 135 |
Comparison of the Prediction and Pathological Results of Benign and Malignant Ground-Glass Nodules Between the Artificial Intelligence System and Radiologists’ Reports of Computed Tomography Images
5. Discussion
High-resolution computed tomography is a screening method for detecting early lung cancer to increase the survival rate of patients (1). Ground-glass nodules may occur as lung adenocarcinoma, precursor glandular lesions (preinvasive lesions), benign lesions, or inflammatory lesions of the lungs. To evaluate the tumor malignancy, it is necessary to distinguish the nature of GGNs, and radiologists primarily rely on the size, density, margins, growth patterns, and other characteristics of the lesions (13).
AI-CAD, using DL technology, automatically extracts CT features and predicts the degree of malignancy of the nodules (14). In this study, we compared and analyzed the diagnostic confidence of GGN properties by manually reading the CT images and using an AI system. Our results indicated that the AI system had a lower rate of qualitative diagnosis of GGNs compared to the manual reading of CT images. This result is consistent with that of a study by Liu (15). This result may be closely related to the AI system detecting the nodules and suggesting the malignant risk value of each nodule and the degree of extraction of the nodule components. Our findings provide a theoretical basis for further improving the feature extraction of GGNs by AI systems in the future.
A previous study showed that GGN subtypes (pGGNs and mGGNs) had different cellular and molecular networks. Understanding the molecular mechanism in each GGN subtype aids in the further discovery of therapeutic targets (16). Experimental evidence indicates that most mGGNs have primarily malignant components. The detection rate of mGGNs in the population is 5.0%, and the detection rate of pGGNs in the population is 4.2%. The malignant incidence of mGGNs is higher than that of pGGNs (17). In this study, a comparison between the 2 groups showed no significant difference between mGGNs and pGGNs, which may be related to the clinical treatment strategies. After the CT examinations, benign and malignant GGNs in the patients were distinguished by analyzing the CT features. Small GGNs, especially pGGNs, were primarily monitored using follow-up observations. They were not subjected to direct treatment. Instead, after a period of follow-up and observation, needle biopsies and pathological examinations were performed to confirm the nature of some GGNs if necessary. This then made the data biased and the early diagnosis and determination of the GGN nature challenging. In the future, we will conduct further analyses using more cases.
An initial diagnosis of GGN based on imaging features is crucial for predicting the nature of the nodules. Many studies have investigated the different features of adenocarcinoma-predominant subtypes of GGNs. According to the 2016 WHO classification, AAH and AIS were classified as preinvasive lesions, and MIA and IAC were classified as invasion lesions. Since the WHO reclassification of thoracic tumors (fifth edition) was published by the International Agency for Research on Cancer in May 2021 (4), AAH and AIS have been classified as precursor glandular lesions of the lungs. Because of the high survival rate after postoperative treatments, these lesions were classified as benign nodules. In this study, we found significant differences in the size, volume, and mean CT value between precursor glandular lesions (preinvasive lesions) and invasive lesions. This is largely consistent with the results of a previous report (18) that found that a larger GGN volume indicated a greater degree of malignancy.
At present, the existing diagnostic methods for GGN include imaging and pathological methods. The intraoperative pathology is mainly provided by frozen sections, and the results are used to guide the selection of surgical methods (19). In the study by Z.N et al, a total of 831 patients with pulmonary GGN were included. The diagnostic accuracy of radiomics and frozen sections for GGN pathological types was compared (20). The results showed that radiomics is not inferior to frozen sections and even has higher imaging accuracy for MIA than frozen sections. Percutaneous lung biopsy is one of the effective methods used to determine the malignancy of GGN, and it is mentioned in the consensus that suspected malignant GGNs are one of the indications for percutaneous lung biopsy (19). It is worth noting that existing Chinese and international guidelines do not recommend a biopsy of GGN as the first diagnostic approach but recommend considering whether to perform a biopsy based on follow-up observations and evaluations. In the cases presented in this article, all patients underwent surgery or biopsy for pathological assessment as the gold standard. Some benign nodules, such as inflammatory nodules or atypical hyperplasia, are surgically removed during wedge resection with indications for lung lesions. Pathological sections are taken together for pathological examination. Some benign nodules, such as granulomas, require biopsy for diagnosis due to difficulties in differential diagnosis and severe patient anxiety.
Most previous studies have primarily examined the CT features of adenocarcinoma-predominant GGNs, primarily the lung-tumor interface, lobulation, spiculation, vacuole sign, air bronchogram sign, vascular convergence sign, pleural indentation sign, and interlobular septal obstruction sign (21, 22). In addition to the above features, this study also showed that the interlobular septal obstruction sign was one of the important CT features distinguishing benign GGNs from malignant GGNs. Pathologically, the interlobular septum is loose tissue that is typically straight, and its 3-dimensional structure resembles a wall. During the growth of an early adenocarcinoma, the interlobular septum blocks the growth of tumor cells, and lymphatic fluid retention may occur, which appears as interlobular septal edema. The interlobular septal obstruction and the contractile force inside the adenocarcinoma pull the central portion of the interlobular septum to form a depression, which occurs more frequently in IAC. In short, larger nodules and more CT features are important indicators for evaluating malignant nodules. Therefore, the GGN size, margins, spiculation, and interlobular septal obstruction have higher predictive values than the other indicators.
Studies have shown that the shape, CT features (eg, vacuole sign, pleural indentation sign, and air bronchogram sign), subtypes, and diameter of GGNs are highly correlated with programmed death-1 ligand 1 expression, which further indicates that different pathological types of tumors or molecular differences can be imaging occurrences and features (23, 24). Our previous research found no significant difference between the radiologists reading films and the size, volume, or CT value of GGN that were measured by AI (P > 0.05) (25). In this study, we present a set of AI measurement data. Our research focused on analyzing the macroscopic imaging features of benign and malignant GGNs, including vacuole sign, air bronchogram sign, vascular bundle sign, vascular perforation sign, pleural indentation sign, spicules, and interlobular septal obstruction sign. We believe that these CT features are important reference factors for the early diagnosis of benign and malignant GGNs and further confirm that GGN size, volume, and CT value are still the basis for evaluating lung cancer. Among these, the vacuole sign, vascular perforator sign, and interlobular septal obstruction sign can be used to predict the nature of GGNs with higher accuracy, sensitivity, and specificity. Our results provide a more favorable diagnostic value for the diagnosis of lung cancer at an early stage.
This study had some limitations. First, the number of cases was small, especially for group A. In addition, the study suggests that some CT imaging features have diagnostic value in distinguishing benign and malignant GGN. We need more data to analyze the correlation between CT imaging features of GGN and the malignancy of lesions. In future studies, a validation cohort will be required to further verify the accuracy of our prediction model. Second, this study lacked postoperative survival and follow-up data in some patients. Thus, further research on the prognosis of some patients with the vascular perforator sign and interlobular septal obstruction sign is necessary.
