1. Background
The concept of autoimmune pancreatitis (AIP) was initially proposed by Yoshida et al. in 1995 (1). It represents a relatively rare, distinct type of pancreatitis that exhibits autoimmune features. According to a recent study, its overall prevalence is 10.1 per 100,000 population, and its annual incidence is 3.1 per 100,000 population in Japan (2). However, the exact incidence of AIP is currently unknown worldwide (3). The characteristic histopathological findings of AIP are divided into two subtypes. Type 1 refers to lymphoplasmacytic sclerosing pancreatitis, which is primarily found in Asia and is associated with immune globulin G4 (IgG4). In contrast, type 2 refers to idiopathic duct-centric pancreatitis, which is most commonly found in Europe and America and is not associated with IgG4 (4).
Generally, AIP is a disease that may be symptomatically and radiographically similar to malignant pancreatic lesions (5). Accurate diagnosis is crucial as AIP is frequently misdiagnosed as PAC. It is important to note that the treatment strategies for these two conditions are completely different (6). A systematic review of 706 AIP patients revealed that 29.7% of AIPs were misdiagnosed as pancreatic cancer, resulting in surgical interventions (7). Therefore, distinguishing between these two conditions is of utmost importance to prevent unnecessary surgical procedures.
Given the difficulty in distinguishing AIP from pancreatic carcinoma, a series of diagnostic criteria have been developed, including the Korean Criteria (8), the Mayo Clinic HISORt Criteria (9, 10), Asian Criteria (11), International Consensus Diagnostic Criteria (ICDC) (4), and the recent Japanese Criteria (JPS 2018) (12). While the criteria may vary, they all emphasize that AIP should be diagnosed through a combination of imaging, laboratory tests, histopathology, extrapancreatic involvement, and response to steroids. Numerous efforts have been made in the literature to identify radiological features that can aid in differentiation, with the capsule-like rim being one of them. The computed tomography (CT) scan shows a low-attenuation halo around the pancreas, which corresponds to inflammation and fibrosis in the pathological analysis (13).
2. Objectives
The purpose of this study was to investigate if the capsule-like structure can be also observed in ultrasonography (US) and if the thickness of the structure can help distinguish AIP1 from PAC.
3. Patients and Methods
The Institutional Ethics Committee approved this retrospective study in accordance with the Declaration of Helsinki (ethical approval code: AF-SOP-07-1.0-01). The requirement to obtain informed consent was waived in this study.
3.1. Patients
Between 2003 and 2021, a total of 23 patients were diagnosed with AIP1 in our institute, according to the ICDC criteria. Transabdominal ultrasonography was performed on 19 of these patients, who were selected as the case group. According to the pre-experimental results, the expected odds ratio (OR) was 7.5, and 15% of patients in the control group were projected to have a thicker hyperechoic capsule-like rim than the cut-off value. The power of the test (1–beta) was established at 0.90, and the significance level (alpha) was set at 0.05. The sample size of the control group was estimated to be 34, using PASS 2021. Considering a 10% attrition rate, the sample size was increased to 38. A total of 763 patients with PAC, who had undergone US examinations between 2014 and 2021 according to our institute's database, were recruited for this study. Additionally, 38 PAC patients were selected to closely match the age and gender of the AIP1 patients. Finally, one patient was excluded due to poor image quality, while the remaining 37 patients were selected as the control group.
The inclusion criteria were as follows: (1) Patients diagnosed with AIP1 in accordance with the ICDC criteria; and (2) PAC patients with available histopathological results. On the other hand, the exclusion criteria were as follows: (1) PAC patients without surgery; (2) patients with multiple tumor sites; (3) patients with gastrointestinal perforation, cholecystitis, or bowel blockage; and (4) patients who did not have a US examination or whose image quality was poor. Clinical data, such as gender, age, and symptoms, were also collected.
3.2. Measurement of the Hyperechoic Capsule-like Structure Around the Pancreas
All ultrasound images were obtained retrospectively from the computer workstation. The examination machines included Philips IU22, Siemens Acuson Sequoia 512, Toshiba Aplio 80, Aloka α10, and SuperSonic Imagine AixPlorer (convex probes; frequency, 3.5 – 5 MHz). The capsule-like structure was observed as a hyperechoic area surrounding the lesion, similar to the capsule of the pancreas. The thickest part of the hyperechoic capsule-like structure around lesions was measured on the workstation. All of the images were calculated by two physicians with more than 10 years of experience in US examinations who had no knowledge of the diagnostic results. The measurements were performed independently, and then, the results were compared. If the measurements were consistent and the difference was less than 0.05 cm, the average value was recorded. If not, a discussion was held to reach a consensus on the final result.
3.3. Definition of Mass Lesions
In imaging, AIP can be classified into diffuse and focal types, and the differentiation between focal AIP and PAC is more challenging (14). Therefore, we employed the term “mass lesion” to describe a lesion located either at the pancreatic head and/or the uncinate process, or at the body and/or tail, appearing as a mass in US images. We specifically examined the differentiation between these locations.
3.4. Statistical Analysis
For the descriptive analysis of qualitative variables, such as gender, the number and percentage were measured, while for quantitative variables, such as age, the mean and standard deviation were calculated. The Chi-square test and Fisher’s exact test were used to evaluate differences in the distribution of categorical variables between the case and control groups. When comparing differences in the involved pancreatic location, the Bonferroni correction test was performed. The two-tailed Student’s t-test was also used to assess statistically significant differences in the distribution of quantitative variables between the case and control groups.
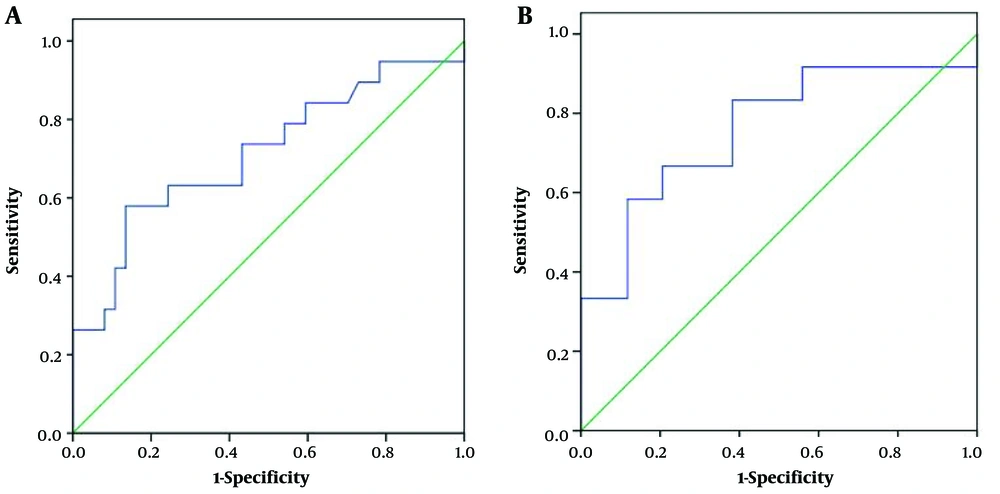
The optimal cut-off value for thickness was determined using the maximum Youden index (sensitivity + specificity - 1). The area under the receiver operating characteristic (ROC) curve (AUC), sensitivity (Sn), specificity (Sp), accuracy, positive predictive value (PPV), negative predictive value (NPV), and OR were also calculated. The threshold for distinguishing between statistically significant and null associations was established at P < 0.05 or <0.05/3 after applying the Bonferroni correction. Statistical analyses were performed using SPSS Version 17.0 (SPSS Inc. Released 2008. SPSS Statistics for Windows, Version 17.0. Chicago: SPSS Inc.).
4. Results
4.1. General Characteristics
All of the lesions, including AIP1 and PAC, appeared as hypoechoic, affecting either the entire pancreas or a specific portion of it. Table 1 summarizes the clinical data and the involved sites of lesions examined by US imaging, indicating that there was no significant difference in gender, age, abdominal pain symptoms, jaundice, or weight loss between the AIP1 and PAC groups. However, there was a significant difference in the involved pancreatic site between the case and control groups (P = 0.008). In 26 out of the 37 PAC cases (70.27%), the pancreatic head and/or the uncinate process was involved, while in only three (8.11%) cases, the entire pancreas was involved. While in seven out of 19 AIP1 cases (36.84%), the entire pancreas was involved, only in six (31.58%) cases, the pancreatic head and/or the uncinate process was involved (P = 0.005).
| AIP1 | PAC | P-Value | |
|---|---|---|---|
| Male/female | 12.7 | 20.17 | 0.515 |
| Age, y, mean ± SD (range) | 52.84 ± 15.33 (18 – 83) | 58.16 ± 10.28 (34 – 80) | 0.128 |
| Abdominal pain, % | 63.16 | 62.16 | 0.942 |
| Jaundice, % | 57.89 | 56.76 | 0.935 |
| Weight loss, % | 36.84 | 43.24 | 0.645 |
| Involved location | 0.008 a | ||
| Head and/or uncinate process | 6 | 26 | |
| Body and tail | 6 | 8 | |
| Entire pancreas | 7 | 3 |
Abbreviations: AIP1, type 1 autoimmune pancreatitis; PAC, pancreatic adenocarcinoma
a P < 0.05 or P < 0.05/3 (after the Bonferroni correction). Values are expressed as Number, unless otherwise indicated.
4.2. Accuracy of the Thickness Measurement of the Hyperechoic Capsule-like Rim Around Pancreatic Lesions in the Diagnosis of AIP1 in All Patients
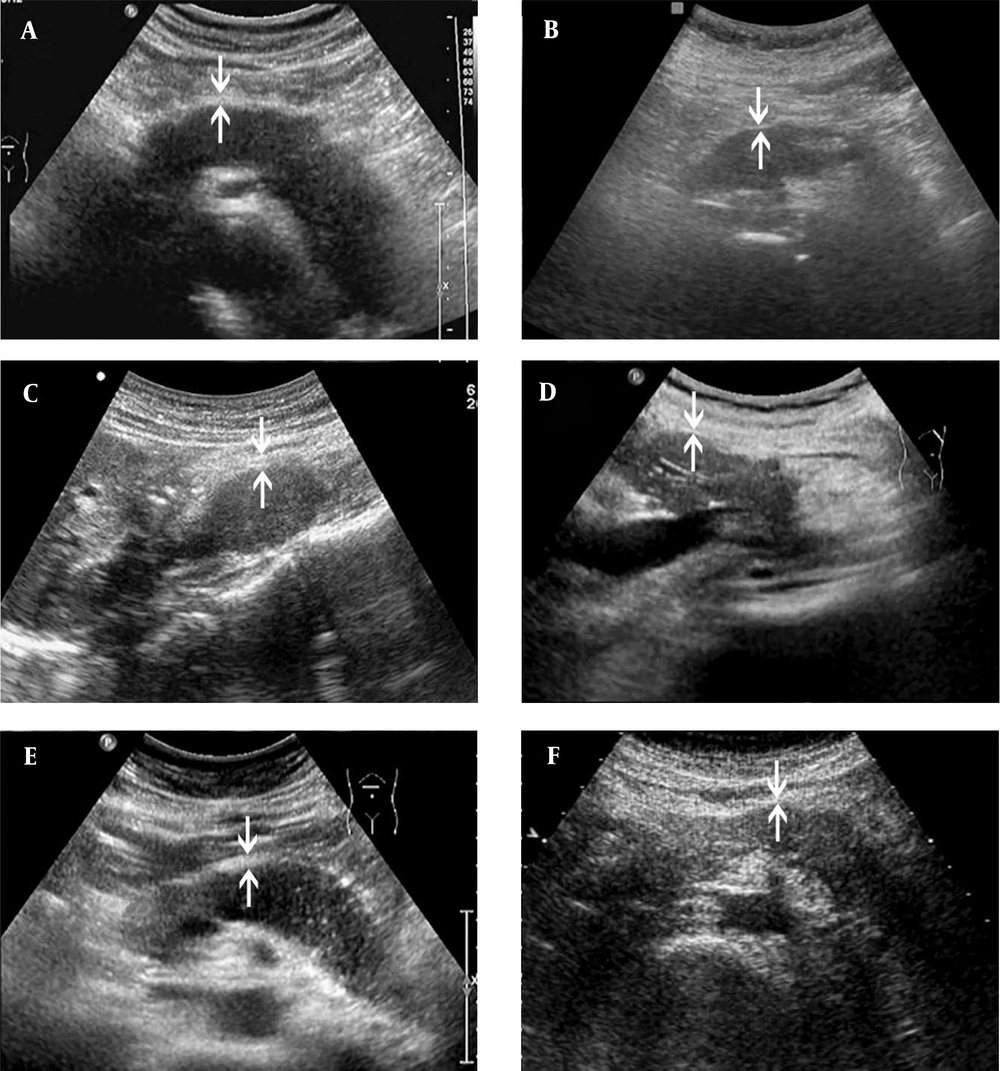
Both AIP1 and PAC lesions presented as capsule-like structures, where a hyperechoic rim surrounded the hypoechoic lesion. The hyperechoic rim was significantly thicker in the AIP1 group compared to the PAC group (mean=0.40 ± 0.12 vs. 0.32 ± 0.09 cm, P = 0.006) (Figure 1). The AUC was 0.71, and the cut-off thickness for AIP1 was estimated at 0.41 cm, according to the maximum Youden index, with a sensitivity of 0.58, specificity of 0.86, accuracy of 0.77, PPV of 0.69, NPV of 0.80, and OR of 8.80 (95% confidence interval [CI]: 2.37 – 32.64) (Figure 2A and Table 2).
The ultrasonography (US) images of AIP1 and PAC cases. Both AIP1 (A, C & E) and PAC (B, D, F) present as hypoechoic lesions, which involve the entire pancreas (A & B) or are located at the pancreatic head/uncinate process (C & D) or body and tail (E & F). The thickness of the hyperechoic capsule-like structure (arrows) is different between the case and control groups. It is often > 0.41 cm in the AIP1 group (A, 0.43 cm; C, 0.49 cm; E, 0.42 cm) and <0.41 cm in the PAC group (B, 0.24 cm; D, 0.24 cm; F, 0.32 cm) (AIP1, type 1 autoimmune pancreatitis; PAC, pancreatic adenocarcinoma).
| AIP1 | PAC | |
|---|---|---|
| Distribution of thickness | ||
| ≥0.41 cm | 11 | 5 |
| <0.41 cm | 8 | 32 |
| Diagnostic performance | ||
| Sensitivity | 0.58 (95% CI, 0.34 – 0.80) | |
| Specificity | 0.86 (95% CI, 0.71 – 0.95) | |
| Accuracy | 0.77 (95% CI, 0.64 – 0.87) | |
| PPV | 0.69 (95% CI, 0.41 – 0.89) | |
| NPV | 0.80 (95% CI, 0.64 – 0.91) | |
Abbreviations: AIP1, type 1 autoimmune pancreatitis; PAC, pancreatic adenocarcinoma; PPV, positive predictive value; NPV, negative predictive value; CI, confidence interval.
4.3. Accuracy of the Thickness Measurement of the Hyperechoic Capsule-like Rim Around Pancreatic Lesions in the Diagnosis of AIP1 Among Patients with Mass Lesions
Out of the 56 pancreatic lesions, 46 were classified as mass lesions on US images. Among these lesions, 12 were identified as AIP1 (six located at the pancreatic head and/or uncinate process and six at the body and tail). The remaining 34 lesions were PACs (26 at the pancreatic head and/or uncinate process and eight at the body and tail). The hyperechoic capsule-like structure was significantly thicker in the AIP1 group than in the PAC group (mean = 0.41 ± 0.13 vs. 0.31 ± 0.09 cm, P = 0.006) (Figure 1C-F). The AUC was estimated to be 0.76. The cut-off thickness value for AIP1 was estimated to be 0.41 cm, according to the maximum Youden index, with a sensitivity of 0.58, specificity of 0.88, accuracy of 0.80, PPV of 0.64, NPV of 0.86, and OR of 10.50 (95% CI: 2.23 – 49.52) (Figure 2B and Table 3).
| AIP1 | PAC | |
|---|---|---|
| Distribution of thickness | ||
| ≥0.41 cm | 7 | 4 |
| <0.41 cm | 5 | 30 |
| Diagnostic performance | ||
| Sensitivity | 0.58 (95% CI, 0.28 – 0.85) | |
| Specificity | 0.88 (95% CI, 0.73 – 0.97) | |
| Accuracy | 0.80 (95% CI, 0.66 – 0.91) | |
| PPV | 0.64 (95% CI, 0.31 – 0.89) | |
| NPV | 0.86 (95% CI, 0.70 – 0.95) | |
Abbreviations: AIP1, type 1 autoimmune pancreatitis; PAC, pancreatic adenocarcinoma; PPV, positive predictive value; NPV, negative predictive value; CI, confidence interval.
5. Discussion
Jaundice, abdominal pain, and weight loss are the most common manifestations of AIP. In these patients, US is often performed as the initial imaging examination, and the affected regions of the pancreas usually appear hypoechoic (15). The findings are so similar to those of adenocarcinomas that they are often mistakenly diagnosed as tumors. When diffuse involvement is present, AIP appears as a “sausage-like” enlargement of the pancreas on US images, making diagnosis relatively simple. However, AIP can also present as a mass lesion, which is more difficult to differentiate from PAC. Indeed, misdiagnoses can occur not only with US, but also with CT scan and magnetic resonance imaging (MRI). Numerous researchers have focused on identifying the imaging characteristics of AIP to enhance diagnostic accuracy. The low-attenuation halo is one of the most common indicators of this disease (16). However, this feature is seldom reported in US images, according to the literature.
In our study, we discovered that the capsule-like rim could be also detected in US images, presenting as a hyperechoic halo around the pancreas. Given that hyperechoic features could be also found adhering to the normal pancreas due to the posterior peritoneum, we calculated the thickness of this feature. Furthermore, to meet the clinical needs, we specifically studied this feature among patients with mass lesions. The hyperechoic structure was significantly thicker in the AIP1 group compared to the PAC group, both in all lesions (mean = 0.40 ± 0.12 vs. 0.32 ± 0.09 cm) and in mass lesions (mean = 0.41 ± 0.13 vs. 0.31 ± 0.09 cm). This thickness measurement for AIP1 was comparable to the CT performance (mean = 0.47 ± 0.28 cm) in the literature (17).
In the present study, a cut-off value of 0.41 cm was calculated according to the maximum Youden index, with low sensitivity but high specificity in both all lesions (Sn = 0.58, Sp = 0.86) and in mass lesions (Sn = 0.58, Sp = 0.88). The AUC indicated a moderate diagnostic value for differentiation (all lesions: AUC = 0.71; mass lesions: AUC = 0.76). It is worth noting that the mass lesions of AIP1, which are more challenging to distinguish from PAC, also exhibited a thicker “capsule”. The low sensitivity and high specificity were akin to the results observed for the capsule-like rim on CT scans in differentiating between focal AIP and PAC. This was a qualitative assessment and demonstrated a sensitivity of 0.46 and a specificity of 0.97 (18).
Some studies have claimed that the peripancreatic hypoechoic margin (PHM) is a characteristic of AIP (19-21), which seems to contradict our findings. In reality, PHM refers to the hypoechoic zone between the enlarged parenchyma and the well-defined hyperechoic capsule (20). This sign was so challenging to detect in US images that it was only identified in three AIP1 cases (15.79%) in our study; this finding is consistent with the results reported by Hoki et al. (19). On the other hand, the well-defined hyperechoic capsule was present in all cases in our study, making it a more universal feature; this feature was the focus of our attention.
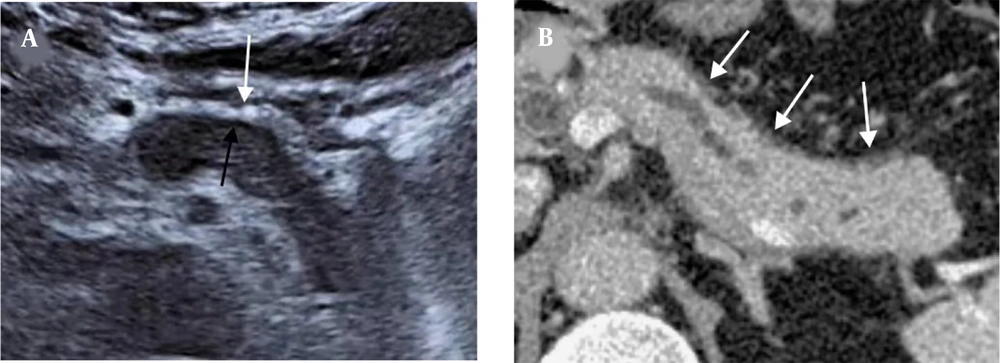
We conducted a comparison between the thickness of the low-attenuation halo observed in CT scans and the thickness of both the PHM and the hyperechoic capsule in US images. Our findings revealed a close similarity between the thickness of the low-attenuation halo in CT scans and that of the hyperechoic capsule. However, the thickness of the PHM showed a significant difference (Figure 3). Therefore, we believe that the hyperechoic capsule-like structure observed in US imaging is likely equivalent to the capsule-like rim sign seen in CT scans. Another potential distinguishing factor could be the specific locations affected by the two diseases. In the current study, AIP1 usually involved the entire pancreas, whereas most PACs involved the pancreatic head and/or the uncinate process. However, this finding is not specific and should be therefore applied with caution.
A 62-year-old man with AIP1. A, The US image shows a thick hyperechoic capsule (white arrow) and a thin PHM (black arrow) around the lesion. B, The capsule-like rim sign on the CT scan (white arrows). The thickness of the hyperechoic capsule on the US image is similar to that of the capsule-like rim on the CT scan (0.49 cm vs. 0.51 cm) (AIP1, type 1 autoimmune pancreatitis; US, ultrasonography; PHM, peripancreatic hypoechoic margin; CT, computed tomography).
There were some limitations in our study. First, the study had a retrospective design and relied on images obtained from a workstation rather than direct measurements on an ultrasound machine, which might introduce measurement inaccuracies. Second, the study might have had a small sample size, which could affect the generalizability of the findings. Third, classification of the lesions was another limitation due to the difficulty in differentiating masses, and some lesions were classified as local lesions despite changes observed in follow-up imaging. Finally, our study only included AIP1 cases and excluded type 2 AIP, potentially limiting the generalizability of the findings to other types of AIP.
In conclusion, the presence of a hyperechoic capsule-like rim with a thickness of ≥0.41 cm on US images indicates a higher likelihood of AIP1 compared to PAC. This finding provides valuable information for differentiating between AIP1 and PAC. However, to validate these findings and enhance the diagnostic accuracy in clinical practice, further studies are required. These studies should involve larger sample sizes and include different types of AIP.


