


1. Background
Enhanced computed tomography (CT) scans of the liver have gained widespread use as a common diagnostic and examination method for liver diseases due to their high lesion detection rate. However, the liver has a dual blood supply system through the portal vein and hepatic artery (1, 2). Consequently, a 3-phase scan is used in liver enhancement examinations, leading to an increased number of scans and higher radiation doses for patients. In routine enhancement examinations for children, a contrast agent dosage of 2 mL/kg is typically administered, but an excessive amount of contrast agent can raise the incidence of contrast-induced nephropathy (CIN) (3, 4).
When a contrast agent is injected using a high-pressure syringe, there is a potential risk of adverse reactions of the contrast agent due to the rapid injection speed, with higher speeds increasing the likelihood of such reactions. As a result, reducing patient radiation doses, minimizing adverse reaction incidences, and improving patient success rates have become critical areas of research in liver CT enhancement. In this experiment, low tube voltage and low contrast dose combined with low flow velocity scanning technology were used to investigate hepatic vascular CT angiography (CTA) imaging in children.
2. Objectives
This study aimed to explore the feasibility of low dose and low contrast medium combined with low flow rate scanning in CTA of children's liver.
3. Patients and Methods
This study was approved by the Medical Ethics Research Committee of Children's Hospital affiliated with Chongqing Medical University (referred to as "our hospital") with reference number 2021 - 83. Informed consent was obtained from all parents of the children participating in the study. The study has been registered in the Chinese Clinical Trial Registry, which is the primary registry of the World Health Organization International Clinical Trial Registry Platform, under the registration number ChiCTR2400079392.
3.1. General Data
A total of 59 children who visited our department for liver vascular CT scans between April 2021 and December 2022 were prospectively selected and randomly divided into an experimental group and a control group. The experimental group consisted of 16 males and 12 females, with an average age of 6.2 ± 2.8 months. The control group included 20 males and 11 females, with an average age of 6.9 ± 2.9 months. Inclusion criteria were (1) no iodine use contraindications or allergy history, (2) absence of hyperthyroidism, hyperglycemia, and liver or kidney dysfunction, and (3) body mass index (BMI) of 5% ≤ BMI ≤ 95%. Exclusion criteria were (1) patients with a history of iodine intake within the past 2 weeks and (2) children who had received excessive X-ray exposure in the short term.
3.2. Equipment and Method
All children underwent scanning using the PHILIPS Brilliance128 iCT scanner (Royal Philips; Amsterdam, Netherlands), and the following equipment was used: A high-pressure syringe (Bracco Injeneering SA, Empower CTA, Milan, Italy), postprocessing workstation (AW4.6, GE Health care, Waukesha, Wisconsin, USA), and incubator (Fuyi Electric Appliance Co, LTD; Beijing, China). The scanning range was from the upper margin of the diaphragm to the lower margin of the liver, with a scanning direction from head to foot.
In the experimental group, scanning was conducted at 80 kV with a contrast dose of 1.5 mL/kg, injected through the right elbow vein within 20 s. The control group underwent scanning at 100 kV with a contrast dose of 2 mL/kg, injected through the right elbow vein within 16 s. Other scanning parameters were as follows: Automatic tube current, dose right index (DRI) set to 13, 5-mm layer thickness, 1.00-mm reconstruction layer thickness, pitch of 0.925, and data reconstructed using the iDose4 iterative reconstruction algorithm at grade 4. The region of interest (ROI) was located at the center of the abdominal aorta at the diaphragmatic parietal level. The trigger point threshold for automatic scanning was set at 150 Hu. The portal phase scanning time ranged from 35 to 40 s, while the venous phase scanning time ranged from 60 to 65 s.
The contrast agent used was Nucopark 320 mgL/mL, stored in a thermostatic box at 37°C. The volume CT dose index (CTDIvol) and dose-length product (DLP) were recorded for all children, and the effective dose (ED) was calculated using the formula ED = DLP × k (k = 0.015) (5, 6). Iodine intake was compared between the 2 groups as follows: For the control group, iodine intake (g) = contrast concentration (mgI/kg) × body weight (kg) × 2 mL/kg and, for the experimental group, iodine intake (g) = contrast concentration (mgI/kg) × body mass (kg) × 1.5 mL/kg.
In this experiment, both groups of children were sedated and examined at the sedation center of our hospital. The medication regimen included inhalation of 2% sevoflurane, oral administration of chloral hydrate (30 mg/kg), and intranasal administration of dexmedetomidine (2 μg/kg).
3.3. Image Analysis
3.3.1. Subjective Assessment
Two physicians with over 5 years of experience in imaging diagnosis blindly evaluated the images. The scoring standard was set at 4 points, and images with subjective quality scores ≥ 3 were considered suitable for clinical diagnosis. The scoring criteria were as follows:
Score 1: The image had significant noise, poor resolution, and inadequate display of the arterial and portal veins, and it was not suitable for clinical diagnosis.
Score 2: The image had significant noise and poor resolution, but the portal vein could be clearly displayed, allowing for a diagnosis.
Score 3: The image had minimal noise and good resolution, and the portal vein was clearly displayed, meeting the requirements for clinical diagnosis.
Score 4: The image had no obvious noise, the resolution was very good, the arteriovenous display was very clear, and the complete vascular tree structure was visible (7-9).
3.3.2. Objective Evaluation
At the AW4.6 workstation, the ROI of abdominal aorta (2.0 mm2 ± 0.5 mm2), common hepatic artery (2.0 mm2 ± 0.5 mm2), parenchyma of right lobe of liver (20.0 mm2 ± 2.0 mm2), and erector spine muscle (ROI = 20.0 mm2 ± 2.0 mm2) were measured at the common hepatic artery during the arterial phase on the axial thin layer image. The portal phase measures the main portal at the portal of the liver ROI (2.0 mm2 ± 0.5 mm2), parenchyma of the right lobe of liver ROI (20.0 mm2 ± 2.0 mm2), and erector spine muscle ROI (ROI = 20.0 mm2 ± 2.0 mm2). Hepatic vein ROI (2.0 mm2 ± 0.5 mm2), parenchyma of right lobe of liver ROI (20.0 mm2 ± 2.0 mm2), and erector spine muscle ROI (ROI = 20.0 mm2 ± 2.0 mm2) were measured at the exit of left, middle, and right hepatic veins.
The CT value of the vertical spine muscle was taken as the SD value, and the mean value was measured 3 times (Figure 1).
![A, The computed tomography (CT) values and image noise (SD) values of common hepatic artery (region of interest [ROI]; 2.0 mm<sup>2</sup> ± 0.5 mm<sup>2</sup>), abdominal aorta ROI (2.0 mm<sup>2</sup> ± 0.5 mm<sup>2</sup>), liver parenchyma ROI (20.0 mm<sup>2</sup> ± 2.0 mm<sup>2</sup>) and erector spine muscle ROI (20.0 mm<sup>2</sup> ± 2.0 mm<sup>2</sup>) were measured at the level of common hepatic artery during the arterial phase. B, The CT values and image noise (SD) values of portal vein main ROI (2.0 mm<sup>2</sup> ± 0.5 mm<sup>2</sup>), liver parenchyma ROI (20.0 mm<sup>2</sup> ± 2.0 mm<sup>2</sup>), and erector spine muscle ROI (20.0 mm<sup>2</sup> ± 2.0 mm<sup>2</sup>) were measured at the portal phase. C, The CT values and image noise (SD) values of hepatic vein ROI (2.0 mm<sup>2</sup> ± 0.5 mm<sup>2</sup>), hepatic liver parenchyma ROI (20.0 mm<sup>2</sup> ± 2.0 mm<sup>2</sup>), and erector spine muscle ROI (20.0 mm<sup>2</sup> ± 2.0 mm<sup>2</sup>) were measured at the exit of the left, middle, and right hepatic vein.](https://services.brieflands.com/cdn/serve/3170b/2e471ce24b326943103e9407f0e75896b31f8d23/ijradiology-138586-g001-F1-preview.webp "A, The computed tomography (CT) values and image noise (SD) values of common hepatic artery (region of interest [ROI]; 2.0 mm<sup>2</sup> ± 0.5 mm<sup>2</sup>), abdominal aorta ROI (2.0 mm<sup>2</sup> ± 0.5 mm<sup>2</sup>), liver parenchyma ROI (20.0 mm<sup>2</sup> ± 2.0 mm<sup>2</sup>) and erector spine muscle ROI (20.0 mm<sup>2</sup> ± 2.0 mm<sup>2</sup>) were measured at the level of common hepatic artery during the arterial phase. B, The CT values and image noise (SD) values of portal vein main ROI (2.0 mm<sup>2</sup> ± 0.5 mm<sup>2</sup>), liver parenchyma ROI (20.0 mm<sup>2</sup> ± 2.0 mm<sup>2</sup>), and erector spine muscle ROI (20.0 mm<sup>2</sup> ± 2.0 mm<sup>2</sup>) were measured at the portal phase. C, The CT values and image noise (SD) values of hepatic vein ROI (2.0 mm<sup>2</sup> ± 0.5 mm<sup>2</sup>), hepatic liver parenchyma ROI (20.0 mm<sup>2</sup> ± 2.0 mm<sup>2</sup>), and erector spine muscle ROI (20.0 mm<sup>2</sup> ± 2.0 mm<sup>2</sup>) were measured at the exit of the left, middle, and right hepatic vein.")
A, The computed tomography (CT) values and image noise (SD) values of common hepatic artery (region of interest [ROI]; 2.0 mm2 ± 0.5 mm2), abdominal aorta ROI (2.0 mm2 ± 0.5 mm2), liver parenchyma ROI (20.0 mm2 ± 2.0 mm2) and erector spine muscle ROI (20.0 mm2 ± 2.0 mm2) were measured at the level of common hepatic artery during the arterial phase. B, The CT values and image noise (SD) values of portal vein main ROI (2.0 mm2 ± 0.5 mm2), liver parenchyma ROI (20.0 mm2 ± 2.0 mm2), and erector spine muscle ROI (20.0 mm2 ± 2.0 mm2) were measured at the portal phase. C, The CT values and image noise (SD) values of hepatic vein ROI (2.0 mm2 ± 0.5 mm2), hepatic liver parenchyma ROI (20.0 mm2 ± 2.0 mm2), and erector spine muscle ROI (20.0 mm2 ± 2.0 mm2) were measured at the exit of the left, middle, and right hepatic vein.
The signal-to-noise ratio (SNR) SNR = CT value/SD value of each site and the contrast-to-noise ratio (CNR) CNR = (CT value of each site - CT value of erector ridge muscle)/SD value were calculated (10-12).
3.4. Statistical Analysis
All data were analyzed using SPSS version 26.0 (IBM Corp. Released 2019. IBM SPSS Statistics for Windows, Version 26.0. Armonk, NY: IBM Corp). Continuous variables were presented as mean ± SD. The chi-square test was used for gender analysis. The age, BMI, radiation dose, iodine intake, objective evaluation of image quality, and subjective score of image quality for the children were assessed using an independent sample t-test. P-values less than 0.05 were considered statistically significant.
The Kappa test was used to determine the consistency of the subjective score of image quality between the 2 physicians: Kappa coefficient ≥ 0.75, good agreement; 0.4 < Kappa coefficient < 0.75, medium agreement; Kappa coefficient ≤ 0.4, poor agreement.
4. Results
4.1. General Data
The experimental group consisted of 16 males and 12 females, with an average age of 6.2 ± 2.8 months and a BMI of 16.182 ± 2.733 kg/m2. The control group included 20 males and 11 females, with a mean age of 6.9 ± 2.9 months and a BMI of 17.687 ± 3.417 kg/m2. There were no significant differences in age, sex, or BMI between the experimental group and the control group (P > 0.05; Table 1).
| Information | Group | |
|---|---|---|
| Control Group | Experimental Group | |
| Male-to-female ratio | 20:11 | 16:12 |
| X2 value | 0.336 | |
| P-value | 0.562 | |
| BMI (kg/m2) | 17.687 ± 3.417 | 16.182 ± 2.733 |
| t value | 1.855 | |
| P-value | 0.069 | |
| Average age (mo) | 6.9 ± 2.9 | 6.2 ± 2.8 |
| t value | 0.851 | |
| P-value | 0.398 | |
Abbreviation: BMI, body mass index.
a Values are expressed as mean ± SD.
4.2. Subjective Evaluation of Image Quality
The images of both groups were scored based on the subjective quality scoring criteria. In the experimental group, the arterial phase score was 3.93 ± 0.262, the portal phase score was 3.86 ± 0.356, and the venous phase score was 3.93 ± 0.262. For the control group, the arterial phase score was 3.97 ± 0.180, the portal phase score was 3.94 ± 0.250, and the venous phase score was 3.94 ± 0.250. There were no significant differences between the groups (P > 0.05). Doctors A and B exhibited good agreement in their subjective scores of image quality for each phase, Kappa = 1.000 (Table 2).
| Group (Scanning Phase) | Physician A Acores | Physician B Scores | Kappa Value | ||||||
|---|---|---|---|---|---|---|---|---|---|
| 1 Points | 2 Points | 3 Points | 4 Points | 1 Points | 2 Points | 3 Points | 4 Points | ||
| Experimental group | |||||||||
| Arterial phase | 0 | 0 | 1 | 27 | 0 | 0 | 2 | 26 | 1.000 |
| Portal vein phase | 0 | 0 | 2 | 26 | 0 | 0 | 2 | 26 | 1.000 |
| Venous phase | 0 | 0 | 1 | 27 | 0 | 0 | 0 | 28 | 1.000 |
| Control group | |||||||||
| Arterial phase | 0 | 0 | 0 | 31 | 0 | 0 | 1 | 30 | 1.000 |
| Portal vein phase | 0 | 0 | 1 | 30 | 0 | 0 | 1 | 30 | 1.000 |
| Venous phase | 0 | 0 | 0 | 31 | 0 | 0 | 2 | 29 | 1.000 |
4.3. Objective Evaluation of Image Quality
The SNR and CNR values of the experimental group were lower than those of the control group at each stage of the image, and these differences were statistically significant (P < 0.05; Table 3 and Figure 2).
| Object of Observation | SNR Value | t-Value | P-Value | CNR Value | t | P-Value | ||
|---|---|---|---|---|---|---|---|---|
| Control Group | Experimental Group | Control Group | Experimental Group | |||||
| Common hepatic artery | 17.287 ± 3.305 | 13.608 ± 3.509 | 4.147 | < 0.001 | 14.931 ± 3.291 | 11.444 ± 3.467 | 3.962 | < 0.001 |
| Aorta abdominalis | 23.153 ± 7.268 | 15.305 ± 3.886 | 5.091 | < 0.001 | 20.628 ± 6.569 | 13.444 ± 4.014 | 4.982 | < 0.001 |
| Hepatic portal vein | 12.638 ± 3.624 | 9.505 ± 1.832 | 4.121 | < 0.001 | 9.608 ± 3.185 | 7.186 ± 1.731 | 3.572 | 0.001 |
| Hepatic vein | 12.954 ± 3.755 | 8.371 ± 1.732 | 5.911 | < 0.001 | 9.347 ± 3.068 | 5.937 ± 1.379 | 5.405 | < 0.001 |
Abbreviations: SNR, signal-to-noise ratio; CNR, contrast-to-noise ratio.
a Values are expressed as mean ± SD.
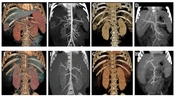
 and maximum intensity projection (MIP)min images of the arterial phase and portal veins phase in the control group under scanning conditions. E, F, G, and H are VR and MIPmin images of the arterial phase and portal veins phase in the experimental group under scanning conditions.")
A, B, C, and D are volume rendering (VR) and maximum intensity projection (MIP)min images of the arterial phase and portal veins phase in the control group under scanning conditions. E, F, G, and H are VR and MIPmin images of the arterial phase and portal veins phase in the experimental group under scanning conditions.
4.4. Radiation Dose Comparison
The CTDIvol, DLP, and ED values of the experimental group were all significantly lower than those of the control group at each stage (P < 0.05; Table 4).
| Group (Parameter) | Control Group | Experimental Group | t-value | P-Value |
|---|---|---|---|---|
| Arterial phase | ||||
| CTDIvol (mGy) | 2.435 ± 0.928 | 1.311 ± 0.442 | 5.843 | < 0.001 |
| DLP (mGy/cm) | 59.861 ± 22.287 | 32.957 ± 11.200 | 5.761 | < 0.001 |
| ED (mSv) | 0.898 ± 0.334 | 0.495 ± 0.168 | 5.764 | < 0.001 |
| Portal vein phase | ||||
| CTDIvol (mGy) | 2.461 ± 0.994 | 1.311 ± 0.441 | 5.643 | < 0.001 |
| DLP (mGy/cm) | 60.048 ± 23.985 | 32.489 ± 11.162 | 5.557 | < 0.001 |
| ED (mSv) | 0.901 ± 0.360 | 0.488 ± 0.167 | 5.56 | < 0.001 |
| Venous phase | ||||
| CTDIvol (mGy) | 2.435 ± 0.928 | 1.311 ± 0.442 | 5.843 | < 0.001 |
| DLP (mGy/cm) | 60.184 ± 22.251 | 32.996 ± 11.214 | 5.828 | < 0.001 |
| ED (mSv) | 0.903 ± 0.334 | 0.495 ± 0.168 | 5.831 | < 0.001 |
Abbreviations: CTDIvol, volume CT dose index; DLP, dose-length product; ED, effective dose.
a Values are expressed as mean ± SD.
4.5. Iodine Intake Comparison
The iodine intake of the control group was 4.315 ± 0.826 g, while that of the experimental group was 3.566 ± 0.855 g. The t-value was 3.418, and the P-value was 0.001.
5. Discussion
Contrast agents are nephrotoxic drugs primarily excreted through the kidneys. Excessive iodine intake puts a greater burden on kidney function, especially in infants aged 0 - 1 years. Therefore, it is crucial to select an appropriate contrast agent concentration and minimize its intake to prevent adverse reactions (13-15). Previous studies have reported (16-19) that using higher concentration contrast agents can lower the dose of low contrast agents, significantly reduce iodine intake, and decrease the incidence of acute kidney injury, and the image quality can still meet the clinical diagnosis. In this study, iodixanol 320 was used as the contrast agent, leading to a 17% reduction in iodine intake in the experimental group compared to the control group. No adverse kidney function reactions were observed in the children, aligning with previous findings.
Excessive contrast injection velocity during enhancement can result in contrast agent leakage and reactions, leading to scanning failures. Higher injection speeds are associated with a higher incidence of adverse reactions (20-23). Infants have delicate blood vessels, and the model of indwelling needles during enhancement depends on their specific vascular condition. The size of the indwelling needle determines the injection flow rate of the contrast agent during enhancement. In this study, the experimental group received contrast agent injections within 20 s, reducing the injection flow rate. As a result, no contrast agent leakage or reactions occurred in the children.
Both groups of children required sedation for the examination. Reducing the flow rate minimizes blood vessel stimulation and the likelihood of awakening in children, providing a basis for reducing the use of sedative drugs in follow-up procedures and decreasing the depth of sedation.
The liver, being a parenchymal organ, is challenging to detect naturally. Multiphase scanning is performed to confirm disease diagnosis, which increases the radiation dose for patients. Infants in the growth stage have active cell division and are more sensitive to radiation, necessitating low-dose scanning (24-26). Therefore, it is essential to reduce radiation dose while still ensuring clinical diagnosis. You et al (27) found that the radiation dose of 70 kV was reduced by 25.0% compared to 100 kV. In this study, the experimental group exhibited a 46% reduction in CTDIvol, a 45% reduction in DLP, and a 45% reduction in ED compared to the control group. This effectively lowered the radiation dose during the multistage liver CTA enhancement examination, thus reducing the likelihood of radiation-related damage. Tube voltage is positively correlated with X-ray energy. By reducing the tube voltage, X-ray photon energy decreases, leading to an increase in the X-ray attenuation coefficient of high-density substances and enhanced image contrast (28-30). In this experiment, 80 kV was used, bringing the X-ray energy closer to the K-layer electron binding energy (33.2 keV) of the iodine atom in the contrast agent. This resulted in a stronger photoelectric effect and higher vascular CT values (31-33). The CT values of the hepatic parenchyma and erector spinae muscle in the experimental group were higher than those in the control group (P > 0.05), with no significant difference in the CT values of the abdominal aorta in the arterial phase between the 2 groups (P > 0.05). These findings indicate that there was no significant difference in the amount of iodine entering the tissue between the 2 groups, and the CT value of the iodine signal in the experimental group increased with decreasing tube voltage, ensuring accurate detection of liver lesions. The CT values of blood vessels in the arterial phase and the CT value of blood vessels in the portal vein phase in both groups were greater than 250 Hu, meeting the clinical diagnostic criteria.
As the tube voltage decreases, the image quality decreases, and the medical image allows for moderate noise without affecting the diagnosis of the disease. The reconstruction technology used in this experiment, iDose4, is an iterative reconstruction technology based on double space and multiple models introduced by Philips. It effectively removes noisy data, preserves the clarity of structural boundaries, reduces noise resulting from reduced radiation dose, improves image resolution, and maximally maintains image authenticity (34-36). Studies have shown that iDose4 reconstruction technology ensures accurate diagnosis while significantly reducing radiation dose (18, 37).
In this study, a low tube voltage was used, resulting in significantly lower SNR and CNR values in the experimental group compared to the control group (P < 0.05), leading to decreased image quality. However, when combined with iDose4 reconstruction technology, there was no significant difference in the subjective image quality scores between the 2 groups at the 3 stages (P > 0.05). The subjective scores were consistent with a Kappa value of 1.000, which met the diagnostic requirements.
Given that the blood vessels of infants aged 0 - 1 year are thinner, they have higher requirements regarding the type and flow rate of the indwelling needle. Additionally, they are more sensitive to radiation and contrast agent doses, necessitating greater attention. Hence, this experiment focused on infants within the 0 - 1 year age group as the experimental subjects. To ensure the accuracy and reliability of the experimental data, a suitable weight factor, K, was selected based on the specific location, and the effective radiation dose was calculated by the radiation dose parameter automatically generated by the computer. According to the literature, iodixanol 320 was used as a contrast agent during enhancement in both groups, which made the experiment more reasonable and practical.
A limitation of this study is the small sample size in each group. To confirm the results, it is important to expand the sample size. Furthermore, this study exclusively investigated children aged 0-1 year, and it would be beneficial to conduct further studies involving children of other age groups. Additionally, the study only included patients with a BMI ranging from 5% to 95%, and examining patients with different BMI ranges would be worth exploring.
In conclusion, the combination of low tube voltage and low contrast dose with a low flow rate CTA scanning protocol can reduce the radiation dose and contrast intake of children while meeting clinical diagnostic requirements. Moreover, the use of a low flow rate minimizes discomfort during the examination and enhances the success rate of the procedure. These findings highlight the potential for wider adoption and promotion of this approach.
