.jpg)


1. Background
Mammographically visible microcalcifications are present in approximately 55% of non-palpable breast malignancies (1). They are responsible for detection of 85% - 95% of the cases of ductal carcinoma in situ (DCIS) by screening mammography (2). DCIS accounts for 20% - 25% of breast cancers detected at screening mammography (3).
The Breast Imaging Reporting and Data System (BI-RADS) has standardized and facilitated the description and management of microcalcifications identified on mammograms (4, 5).
Based on BI-RADS 5th edition that was published in 2013, the term of grouped distribution (historically “clustered”) is usually used when five calcifications grouped within 1 cm of each other or when a definable pattern is identified. The upper limit for use of this descriptor is when larger numbers of calcifications gather within 2cm of each other (4, 5). The microcalcifications with morphology of coarse heterogeneous, fine pleomorphic, fine linear, fine linear branching and amorphous are suspicious forms and should further evaluate by biopsy.
In detail, suspicious morphology is defined as follows:
1. Amorphous (BI-RADS 4b; hazy in appearance with no distinct and sharp border)
2. Coarse heterogeneous (BI-RADS 4b; irregular calcifications smaller than dystrophic calcifications measured between 0.5 mm and 1 mm, they tend to coalesce)
3. Fine pleomorphic (BI-RADS 4c; usually more conspicuous than amorphous forms with discrete shapes often measure < 0.5 mm)
4. Fine linear or fine-linear branching (BI-RADS 4c; thin and irregular linear calcifications measure usually < 0.5 mm).
In the previous 2003 atlas of BI-RADS (4th edition), the clusters of microcalcifications were classified by morphology and distribution either as benign, intermediate concern or high probability of malignancy; and groups with fine pleomorphic and linear morphology were categorized as BI-RADS 5 category. Nevertheless, in the new 2013 version, the approach has changed and they were reclassified as suspicious forms (BI-RADS 4C) (4, 5). Therefore, groups with coarse heterogeneous and amorphous morphology are included in 4b category and the fine pleomorphic and fine linear branching morphologies are in the 4c category. If any distortion is associated with the latter forms, the final BIRADS would be 5 (4, 5).
On the other hand, heterogeneity (in size, morphology and density) and number of microcalcification within a group are not included in BI-RADS classification.
2. Objectives
The purpose of this study was to retrospectively determine the malignancy risk of microcalcification groups regarding these characteristics. In addition, we compared the fourth and fifth editions of BI-RADS in their interpretation.
3. Patients and Methods
In a cross sectional study, 88 patients with microcalcification groups (age range, 26 - 80 years; mean, 53.4 years) who had undergone mammographically guided biopsy between March 2013 and March 2015 were evaluated.
All mammographic examinations were obtained by using a LORAD Selenia (Hologic) full-field digital mammography system. Screening and diagnostic mammograms were obtained prior to mammographically guided biopsy, then analyzed by a breast subspecialty-trained radiologist.
Overall, the number of microcalcification groups in each patient, number of deposits within each group, group location and heterogeneity in size, density and morphology assessed and subsequently BI-RADS descriptors for fourth and fifth editions were recorded separately. Finally, correlation with histopathology was performed.
3.1. Statistical Analysis
In statistical analysis, the Fisher-Freeman-Halton Exact Test, the linear association chi-square test and SPSS were used to evaluate the statistical significance among the descriptor groups with respect to the risk of malignancy.
A statistically significant difference was defined as P values of less than 0.05 and for results found to be statistically significant, odds ratios and 95% confidence intervals (CIs) were used in a pairwise method to assess differences.
Additionally, for assessment of the efficacy of BIRADS versions we used receiver operating characteristics (ROC) curves.
4. Results
In this study, 88 patients, who had grouped calcifications on mammogram and underwent mammo-guided biopsy, were included. All of them were women with the mean age of 54.3 years. The malignant groups composed 53 out of 88 (60.2%) cases and were mostly located in the upper outer quadrants in 30 (34%) cases (Table 1), mostly in upper parts and further in the left breast in 49 (55.7%) cases.
| Location | No. (%) |
|---|---|
| Upper/outer | 30 (34.1) |
| Upper/inner | 2 (2.3) |
| Lower/inner | 4 (4.5) |
| Lower/outer | 6 (6.8) |
| Upper | 18 (20.5) |
| Medial | 2 (2.3) |
| Lower | 8 (9.1) |
| Lateral | 5 (5.7) |
| Retroareolar/Central | 13 (14.8) |
Location of the Calcification Groups
Evaluation of frequency distribution demonstrated that the most common morphology descriptors included pleomorphic (27/88, 30.7%) and amorphous (26/88, 29. 5%). The less frequent features were coarse heterogeneous (19/88, 21.6%) and fine linear and fine linear branching (16/88, 18. 2%). In 86.4% of cases, the calcium flecks within the group were above 10.
Heterogeneity in size was seen in 81 cases (92%) and in density and morphology it was noted in 69 (78.4%) and 86 cases (97.7%), respectively.
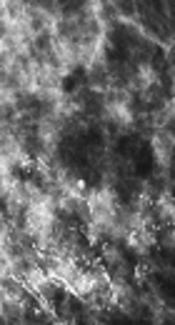
The probability of malignancy based on morphology is as follows: coarse heterogeneous (Figure 1), 42.1% (8 out of 19); amorphous (Figure 2), 29% (7 out of 26); fine pleomorphic, 85.2% (23 out of 27); and fine linear (Figure 3) and fine linear branching, 93% (15 out of 16), which showed a statistically significant difference between these groups (P < 0.001) (Table 2).

Calcification groups that have amorphous morphology as seen here on magnification view. They were suspicious, which led to the diagnosis of fibrocystic changes after histopathological assessment.

There are calcifications with fine linear morphology and fine-linear branching morphology on this magnification view. As we know, they should be judged by those with the worse morphology. Core biopsy showed invasive ductal carcinoma.

In this mammogram, groups of coarse heterogeneous morphology with tissue distortion are due to invasive ductal carcinoma.
| Morphology descriptor | Probability of malignancy | Positive predictive value |
|---|---|---|
| Amorphous | 7/26 (29) | 7.9 |
| Coarse heterogeneous | 8/19 (42.1) | 17.8 |
| Fine linear or fine-linear branching | 23/27 (85.2) | 63.2 |
| Fine pleomorphic | 15/16 (93) | 100 |
Probability of Malignancy Regarding Morphology of the Calcifications, All with Grouped Distributiona
As shown in Table 3, the likelihood of malignancy in groups under 10 in number of microcalcifications were 50% (6 out of 12) and in above 10 group, 61.8% (47 out of 76). Heterogeneity in size existed in 81 cases (92%), in density, in 69 cases (86.4%) and in morphology, in 86 cases (97.7%).
| Variable | TP | FN | TN | FP | Sen %95CI | Spec %95CI | PPV %95CI | NPV %95CI | PLR %95CI | NLR %95CI | Accuracy %95CI |
|---|---|---|---|---|---|---|---|---|---|---|---|
| Number (<10and >10) | 47 | 6 | 6 | 30 | 0.89 (0.77-0.96) | 0.17 (0.06-0.33) | 0.61 (0.49-0.72) | 0.5 (0.21-0.79) | 1.1 (0.89-1.3) | 1.47 (0.5-4.1) | 0.6 (0.49-0.7) |
| Size heterogeneity | 51 | 2 | 6 | 30 | 0.96 (0.87-0.99) | 0.17 (0.06-0.33) | 0.63 (0.52-0.73) | 0.75 (0.35-0.17) | 1.2 (0.99-1.3) | 4.4 (0.94-20.7) | 0.64 (0.53-0.74) |
| Density heterogeneity | 45 | 8 | 12 | 24 | 0.85 (0.72-0.93) | 0.33 (0.19-0.51) | 0.65 (0.53-0.76) | 0.6 (0.36-0.81) | 1.3 (0.98-1.6) | 2.2 (1-4.9) | 0.63 (0.5-0.74) |
| Morphology heterogeneity | 53 | 0 | 2 | 34 | 1 (0.93-1) | 0.06 (0.01-0.19) | 0.61 (0.5-0.71) | 1 (0.16-1) | 1.1 (0.98-1.1) | - | 0.62 (0.51-0.72) |
| Distribution (1 vs. >1) | 13 | 40 | 28 | 8 | 0.25 (0.14-0.38) | 0.78 (0.61-0.9) | 0.62 (0.38-0.82) | 0.41 (0.29-0.54) | 1.1 (0.51-2.4) | 1.3 (0.82-1.3) | 0.46 (0.35-0.57) |
| Associated (yes vs. no) | 27 | 26 | 23 | 13 | 0.51 (0.37-0.65) | 0.64 (0.46-0.79) | 0.68 (0.51-0.81) | 0.47 (0.33-0.62) | 1.4 (0.85-2.3) | 1.3 (0.9-1.9) | 0.56 (0.45-0.67) |
Diagnostic Efficacies of Different Descriptors for Malignancy
The risk of malignancy increased with the heterogeneity of microcalcifications especially in the groups with heterogeneity in density, however with no statistically significant difference. (P =0.68). The overall PPV of suspicious microcalcifications was 22.4%. PPVs of morphology descriptors were as follows: amorphous, 7.9 %; coarse heterogeneous, 17.8 %; fine pleomorphic, 63.2 %; fine linear/fine linear branching, 100 % (P < 0.001).
We assessed the area under the receiver operating characteristic (AUC of ROC) curve for evaluating BIRADS efficacy in predicting the risk of malignancy, regarding that the AUC of 4th and 5th versions of BIRADS were 0.76 and 0.74 (both P values < 0.001, 95% confidence intervals = 0.66 - 0.87 and 0.63 - 0.85 respectively). P value for comparison of two BIRADS was insignificant. Considering successive cutoff points [(4a - 4b), (4b - 4c) and (4 - 5)] for BIRADS versions, diagnostic efficacies of two BIRADS versions were calculated (Table 4).
| BI-RADS Version | Cutt-Off Point | TP | FN | TN | FP | Sen [95%CI] | Spec [95%CI] | PPV [95%CI] | NPV [95%CI] | PLR [95%CI] | NLR [95%CI] | Accuracy [95%CI] |
|---|---|---|---|---|---|---|---|---|---|---|---|---|
| 4th | 4a versus others | 58 | 1 | 5 | 24 | 98 [91-99] | 17 [6-36] | 71 [60-80] | 83 [36-99] | 1.2 [1-1.4] | 10.2 [1.2-83] | 72 [61-81] |
| (4a and 4b) versus others | 41 | 18 | 22 | 7 | 69 [56-81] | 76 [56-90] | 85 [72-94] | 55 [38-71] | 2.9 [1.5-5.6] | 2.5 [1.6-3.8] | 72 [61-81] | |
| 4 versus 5 | 37 | 22 | 24 | 5 | 63 [49-75] | 83 [64-94] | 88 [74-96] | 52 [37-67] | 3.6 [1.6-8.3] | 2.2 [1.5-3.2] | 69 [59-79] | |
| 5th | 4b versus others | 41 | 18 | 22 | 7 | 69 [56-81] | 76 [56-90] | 85 [72-94] | 55 [38-71] | 2.9 [1.5-5.6] | 2.5 [1.6-3.8] | 72 [61-81] |
| 4 versus 5 | 7 | 52 | 29 | 0 | 12 [5-23] | 100 [88-100] | 100 [59-100] | 36 [25-47] | - | 1.1 [1-1.2] | 41 [31-52] |
Diagnostic Efficacies of Two BI-RADS Lexicons in Different Cutoff Points
5. Discussion
Calcium deposits are extremely common in mammograms which increase with age between the ranges of 8 to 86% (6).
As previous studies reported, small calcium groupings are one of the frequent features of breast cancer on mammograms (7). In this study, most of the calcium groups were histologically malignant and located in the left upper and upper outer quadrants. The pleomorphic and amorphous morphologies are the most common forms. Calcium flecks within the group were above 10 in most groups.
Mammographic assessment of microcalcifications and classification according to BI-RADS system is an essential part of abnormal screening or diagnostic mammograms. Regarding the last edition of BI-RADS system, when they are visible in a volume of approximately 2 cm3 with a numerical threshold of five or more calcium flecks, 20% to 25% of them may indicate cancer.
The risk of malignancy accompanied with a mammographic microcalcification in our study is comparable to results done by most investigators with the range of 13% - 36% (8-10). Our data showed that the positive predictive value for microcalcification group risk of malignancy is 22.4%.
The most important element of microcalcification characteristics is morphology. The shape of calcium flecks and heterogeneity of them in shape are valuable in determining the likelihood of malignancy and suspicion should be aroused as previously reported in prior studies (11).
The microcalcification morphologic descriptors amorphous, coarse heterogeneous, fine pleomorphic, and fine linear had a progressively increasing risk of malignancy especially the fine linear and fine linear branching types with estimated percentages of 29%, 42%, 85% and 93%, respectively.
The positive predictive value of malignancy likelihood for fine pleomorphic and fine linear/fine linear branching are higher than previous similar studies (4-12).
It can be mentioned that in the case of coarse heterogeneous morphology, the risk of malignancy is compatible with prior data; although relatively few studies have been carried out before (12).
Additionally, the risk of malignancy of amorphous morphology (7.9%) shows lower PPV compared to prior studies; however, regarding BI-RADS system, this morphology descriptor with about eight percent of malignancy is within the 4b category (higher than 2%).
Pathologically, the overall heterogeneity and number of calcium deposits could be due to the process of tumor necrosis. Therefore, in our experience and that of others, irregular heterogeneous groups with an increased number of calcium flecks are more suspicious for malignancy reasonably as Egan et al. concluded in a study and found similar results.
Heterogeneity in size, density and morphology of microclacifiaction groups as well as increasing numbers of calcium deposits within a group increased the likelihood of malignancy with CI of 1, 0.96, 0.89 and 0.85, respectively.
In this study, group microcalcifications in association with an asymmetry, ill-defined density or tissue distortion are of more concern and increased risk of malignancy, which is consistent with previous studies (13).
Apparently, BI-RADS category 5 is usually reserved for lesions having a 95% probability of malignancy. If a mammogram is classified into BI-RADS category 4 or 5 it tends to have a positive predictive value of breast cancer of approximately 2% or more.
The frequency of carcinoma was higher in category 5 than in category 4 lesions, which is similar to previously reported findings (4, 5).
In conclusion, in this study we found that the descriptors in BI-RADS 5th edition could predict the risk of malignancy as well as 4th edition with no significant statistical difference although comparing PPV of descriptors, the likelihood of malignancy is slightly closer to the 5th edition predictors than the 4th.
