


1. Background
Nowadays, non-alcoholic fatty liver disease (NAFLD) is a suffering problem in our population. The prevalence of this phenomenon raised from 2.9% - 3.3% in 2011 to 21.5% in 2013 probably due to change of lifestyle (reducing physical activity and bad dietary regimen) or the increase in capabilities of physicians or utility of diagnostic tools for disease screening (1, 2). Various risk factors have been identified in the pathogenesis of NAFLD including insulin resistance, stress oxidative, diabetes, hyperlipidemia, obesity, and metabolic syndrome (3-7). In recent decades, an upward trend in the prevalence of obesity was found in all ages that among those, obesity has been suggested as the most important risk factor for NAFLD. This issue can highlight the importance of NAFLD as one of the important chronic liver diseases in the entire world (8-10). Now, NAFLD is known as a common debilitative disorder among adults as well as one of the most important causes for growth retardation in childhood (11).
NAFLD is revealed along with obesity, hyperlipidemia, cardiovascular diseases, and type II diabetes (12, 13). Hyperlipidemia can be revealed in about 20% to 80% of the affected patients (14). In a group of autopsied cases with NAFLD, 20 out of 22 cases suffered from diabetes or hyperlipidemia (15). Additionally, about half of the hyperlipidemia patients may be diagnosed as NAFLD by sonography (16). Abdominal obesity, sudden weight loss, complete enteral nutrition, diverticulus, medications and family history are main determinants of steatohepatitis.
The gold standard for diagnosing NAFLD is liver biopsy, while this approach is completely invasive leading to morbidity and even mortality (17). Besides, sonography is a reliable, available, and cost-benefit tool as compared to other modalities. Hence, in spite of its potential limitations, the researchers believe that sonography is the safest for screening NAFLD (18).
Pathophysiologically, NAFLD has a progressive nature with a degree of inflammation and fibrosis with a tendency to end-stage liver disease, cirrhosis or even hepatocellular carcinoma that result in poor prognosis and high mortality (19, 20). Thus, the importance of its early diagnosis and management is absolutely clear (21). Patients with NAFLD highly tend to suffer from atherosclerotic disorders manifested as increasing carotid intima-media thickness (IMT) or coronary atherosclerotic lesions (22-25). In other words, NAFLD patients are susceptible to liver disease-related death or life-threatening cardiovascular disorders (26-29).
Recent studies have attempted to assess the relation between fatty liver disease and atherosclerosis indicating this close link (30, 31). Some risk factors for coronary artery disease or carotid atherosclerosis can be commonly found in NAFLD. In this regard, simultaneously occurring NAFLD and atherosclerosis patterns can be shown in 2.3% to 54% of patients (32-34). Advanced age, female gender, hypertension, diabetes, and smoking potentially increase the likelihood for both coronary stenosis and carotid artery atherosclerosis (35, 36). In recent decades, the link between liver esteatosis and carotid atherosclerosis has been also suggested. Although some studies could not find any association among increased c-IMT following NAFLD and its consequent cardiovascular disorders (37), some cross-sectional and case-control studies could show NAFLD and c-IMT as independent predictors for cardiovascular diseases and carotid atherosclerotic plaques (38-41). However, some other studies could not find this association (37). This contradictory result may be due to employing nonstandard diagnostic procedures or using linear probes with low-level frequency at sonography. Also, the studies on the increased risk for cardiovascular disorders in those with NAFLD led to paradoxical findings (42, 43). Additionally, some observations suggested that hypothyroidism may increase c-IMT (44), but it was not observed in other surveys (45). The probable association between liver esteatosis and carotid lesions may lead to poor clinical outcome requiring repeated annual sonographic assessments. In these cases, more assessment of carotid arteries may be indicated.
2. Objectives
The present study aimed to assess the relationship between NAFLD and increase risk for atherosclerosis.
3. Patients and Methods
This study was performed on all patients who were admitted to the radiology department of Rsoul-e-Akram, Firouzgar, Shahid Rajaee, or Shohada hospitals between 2014 and 2016. Overall, 300 patients were enrolled and categorized as the case group (NAFLD group) or control group. The exclusion criteria were history of alcohol use, positive hepatitis or HIV infection, undergoing chemotherapy, evidence of lesion or failure of other organs, pregnancy, or infancy. Anthropometric parameters were measured by a single trained nurse. Laboratory indices assessed in single reference laboratory included fasting blood sugar (FBS), triglyceride (TG), total cholesterol (TC), low density lipoprotein (LDL), and body mass index (BMI). All data were set at the study checklist. Abdomial sonography was conducted using a probe 3 to 5 mHZ and carotid sonography using a probe 7.5 mHZ by a single sonographer. The subjects who were diagnosed as grade I NAFLD had all criteria of disease and therefore, those with marginal or borderline patterns were not considered as our cases. NAFLD was diagnosed based on the diagnostic criteria including sonographic findings in the absence of cardiovascular disorders, acute or chronic liver diseases, malignancies, acute or chronic renal diseases, history of alcohol use (higher than 40 g/day for men and 20 g/day for women for more than 5 years), pregnancy, liver masses, abnormal Cu metabolism, or using drugs that adversely affected liver function. After liver assessment, the carotid IMT was assessed by sonography in all participants. According to the standard protocol, the posterior wall of both common carotids was assessed. The cutoff value of ≥ 0.8 mm was considered for increased c-IMT (37) although a reference range from 0.64 to 1.2 has been used as significant carotid thickness (Figures 1 - 3) (22, 28).
 measurement - B-mode ultrasonography. IMT is measured as the distance between calipers (lumen-intima interface) shown with the white arrows. High-resolution B-mode system equipped with a linear array transducer > 7 MHz with minimal compression at a distance of at least 5 mm below the distal end of common carotid artery (CCA) with averaging of three measurements. A, A 50-year-old female with flank pain. White arrow show thin IMT. B, A 40-year-old female with hyperlipidemia as the incidental finding during checkup. White arrow shows medium IMT. C, A 62-year-old male with a medical history of atherosclerosis, coronary artery disease and fatty liver. White arrow shows thick IMT.")
Intima media thickness (IMT) measurement - B-mode ultrasonography. IMT is measured as the distance between calipers (lumen-intima interface) shown with the white arrows. High-resolution B-mode system equipped with a linear array transducer > 7 MHz with minimal compression at a distance of at least 5 mm below the distal end of common carotid artery (CCA) with averaging of three measurements. A, A 50-year-old female with flank pain. White arrow show thin IMT. B, A 40-year-old female with hyperlipidemia as the incidental finding during checkup. White arrow shows medium IMT. C, A 62-year-old male with a medical history of atherosclerosis, coronary artery disease and fatty liver. White arrow shows thick IMT.
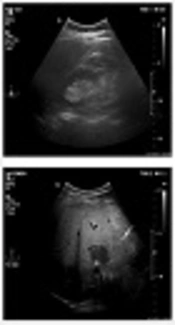
. A 35-year-old male with no underlying disease. He underwent abdominal B-mode ultrasonography for vague abdominal pain. Solid two-way arrow: almost same echogenicity of liver and kidney; open arrows: portal and ductal wall echogenicity.")
Normal liver (grade 0). A 35-year-old male with no underlying disease. He underwent abdominal B-mode ultrasonography for vague abdominal pain. Solid two-way arrow: almost same echogenicity of liver and kidney; open arrows: portal and ductal wall echogenicity.
 - B-mode ultrasonography . A 47-year-old female, 70kg with mild hypertension and slightly abnormal liver function tests (LFT). Moderate increased liver echo. The solid arrow shows obscured portal wall echogenicity and the open arrow shows focal fat sparing.")
Fatty liver (grade 2) - B-mode ultrasonography . A 47-year-old female, 70kg with mild hypertension and slightly abnormal liver function tests (LFT). Moderate increased liver echo. The solid arrow shows obscured portal wall echogenicity and the open arrow shows focal fat sparing.
Results were presented as mean ± standard deviation (SD) for quantitative variables and were summarized by absolute frequencies and percentages for categorical variables. Normality of data was analyzed using the Kolmogorov-Smirnoff test. Categorical variables were compared using chi-square test or Fisher’s exact test when more than 20% of cells with an expected count of less than five were observed. Quantitative variables were also compared with t test, NOVA test, Mann-Whitney U test, or Kruskal-Wallis test. For statistical analysis, statistical software SPSS version 16.0 for windows (SPSS Inc., Chicago, IL) was used. P values of 0.05 or less were considered statistically significant.
4. Results
Among 300 subjects enrolled in the study, 150 had NAFLD [50%]; in which, 118 were grade 1 [%78.7], 28 were grade 2 [%18.7] and four were grade 3 [%2.7]. The mean age of NAFLD patients and normal subjects were 49.9 ± 13.2 [20 - 80] and 52.5 ± 16.2 [21 - 97] [P = 0.12]. Among the NAFLD group, 98 [%65.3] were male while in normal subjects, 86 [%57.3] were male [P = 0.16]. The mean weight of NAFLD patients and normal subjects were 82 ± 13.1 and 77.5 ± 15.3 [P = 0.007]. Mean BMI of NAFLD patients and normal subjects were 29.1 ± 4.5 and 28.1 ± 5 [P = 0.069]. Among all subjects, 78 [%26] had hyperlipidemia, 71 [%23.7] had hypertension, 41 [%13.7] were smokers and 61 [%20.3] were diabetic or showed impaired glucose tolerance test (IGTT) (45 were diabetic [%15] and 16 showed IGTT [%5.3]). Mean right and left IMTs were 0.56 ± 0.18 [0.25 - 1.5] and 0.57 ± 0.18 [0.25 - 1.45] respectively [P = 0.026]. Considering a cutoff point of ≥ 0.8 as increased IMT, we had 37 [%12.3] and 38 [%12.7] patients with increased IMT on right and left sides respectively. Totally, we had 46 [%15.3] patients with at least one side increased IMT. Twenty nine patients had bilateral increased IMT [%9.7]. Association of cardiovascular risk factors with NAFLD was statistically nonsignificant while the mean of IMT among patients with these risk factors were higher than patients without them. The findings have been mentioned in Table 1.
| NAFLD | IMT | |||
|---|---|---|---|---|
| No. (%) | P value | Mean ± SD | P value | |
| HTN | 0.89 | < 0.001 | ||
| Yes | 35 (49.3) | 0.64 ± 0.16 | ||
| No | 115 (50.2) | 0.54 ± 0.17 | ||
| HLP | 0.6 | < 0.001 | ||
| Yes | 37 (47.4) | 0.66 ± 0.21 | ||
| No | 113 (50.9) | 0.53 ± 0.15 | ||
| Smoking | 0.24 | 0.12 | ||
| Yes | 24 (58.5) | 0.59 ± 0.15 | ||
| No | 126 (48.6) | 0.56 ± 0.18 | ||
| Diabetes or IGTT | 0.89 | < 0.001 | ||
| Yes | 30 (49.2) | 0.65 ± 0.18 | ||
| No | 20 (50.2) | 0.54 ± 0.17 | ||
| NAFLD | < 0.001 | |||
| Yes | - | 0.62 ± 0.19 | ||
| No | - | 0.5 ± 0.13 | ||
Association of HTN, HLP, Diabetes and Smoking with NAFLD and IMT
Mean age of patients in increased IMT patients versus others were 61.8 ± 11.2 and 49.3 ± 14.6, respectively [P < 0.001]. Mean BMI of patients in increased IMT patients versus others were 27 ± 3.5 and 28.8 ± 4.9, respectively [P = 0.02].
When we considered patients in three groups of no NAFLD, grade 1 NAFLD and grade (2 and 3) of NAFLD together, there was no association between smoking, hypertension (HTN), diabetes and hyperlipoproteinemia (HLP) with this new classification [all P-values > 0.1]. Mean IMT in grade 1 NAFLD patients was 0.62 ± 0.18 and it was 0.63 ± 0.22 in group 2 and 3 NAFLD patients [P > 0.9]. Among NAFLD patients, 38 had increased IMT [uni- or bilateral] [%25.3] while this frequency was 8 [%5.3] among normal subjects [P < 0.001, odds ratio = 6, 95% confidence interval = 2.7 - 13.4]. Mean IMT in men and women were 0.57 ± 0.19 and 0.55 ± 0.15 [P = 0.32].
Among diabetic patients, 18 [%29.5] showed increased IMT while among others, 28 [%11.7] had increased IMT [P = 0.001, odds ratio = 3.2, 95% confidence interval = 1.6 - 6.2]. Among HLP patients, 22 [%28.2] showed increased IMT while among others, 24 [%10.8] had increased IMT [P < 0.001, odds ratio = 3.2, 95% confidence interval = 1.7 - 6.2]. Among HTN patients, 17 [%23.9] showed increased IMT while among others, 29 [%12.7] had increased IMT [P = 0.02, odds ratio = 2.2, 95% confidence interval = 1.1 - 4.2]. Among smokers, five [%12.2] showed increased IMT while among others, 41 [%15.8] had increased IMT [P = 0.55].
We calculated univariate regression models considering IMT as dependent variable and age, BMI, smoking, HLP, diabetes and HTN as independent variables [These models were constructed in NAFLD patients, normal subjects and all subjects separately]. In this relation, we calculated linear regression models [when we considered the exact value of IMT measured by sonography] and logistic regression models [when we considered a dichotomous variable for IMT determined by mentioned cutoff point of ≥ 0.8] separately (Table 2).
| Independent variable | Linear regression | Logistic regression | |||||
|---|---|---|---|---|---|---|---|
| Adjusted R square | Coefficient | P value | R square | Odds ratio | %95 CI | P value | |
| Age | |||||||
| All | 0.22 | 0.006 | < 0.001 | 0.09 | 1.06 | 1.03 - 1.09 | < 0.001 |
| NAFLD | 0.3 | 0.008 | < 0.001 | 0.02 | 1.11 | 1.06 - 1.15 | < 0.001 |
| No NAFLD | 0.33 | 0.005 | < 0.001 | 0.06 | 1.08 | 1.02 - 1.14 | 0.01 |
| BMI | |||||||
| All | -0.002 | -0.001 | 0.52 | 0.02 | 0.91 | 0.85 - 0.99 | 0.02 |
| NAFLD | 0.1 | -0.005 | 0.12 | 0.04 | 0.9 | 0.81 - 0.99 | 0.02 |
| No NAFLD | -0.006 | -0.001 | 0.77 | 0.04 | 0.79 | 0.65 - 0.98 | 0.03 |
| HLP | |||||||
| All | 0.1 | 0.13 | < 0.001 | 0.04 | 3.2 | 1.7 - 6.2 | < 0.001 |
| NAFLD | 0.16 | 0.18 | < 0.001 | 0.08 | 4.4 | 2 - 9.9 | < 0.001 |
| No NAFLD | 0.07 | 0.08 | < 0.001 | 0.01 | 2.8 | 0.68 - 11.9 | 0.15 |
| HTN | |||||||
| All | 0.06 | 0.11 | < 0.001 | 0.02 | 2.2 | 1.1 - 4.2 | 0.02 |
| NAFLD | 0.05 | 0.1 | 0.005 | 0.01 | 1.8 | 0.78 - 4.1 | 0.17 |
| No NAFLD | 0.12 | 0.11 | < 0.001 | 0.04 | 6 | 1.4 - 26.4 | 0.02 |
| Smoking | |||||||
| All | 0.001 | 0.03 | 0.28 | 0.001 | 0.74 | 0.27 - 2 | 0.55 |
| NAFLD | 0.001 | -0.05 | 0.29 | 0.02 | 0.4 | 0.1 - 1.3 | 0.13 |
| No NAFLD | 0.06 | 0.11 | 0.002 | 0.01 | 2.8 | 0.52 - 15.3 | 0.23 |
| Diabetes | |||||||
| All | 0.06 | 0.11 | < 0.001 | 0.035 | 3.2 | 1.6 - 6.2 | 0.001 |
| NAFLD | 0.09 | 0.14 | < 0.001 | 0.07 | 4.2 | 1.8 - 9.8 | 0.001 |
| No NAFLD | 0.06 | 0.06 | 0.002 | 0.01 | 2.4 | 0.6 - 10.8 | 0.24 |
| NAFLD | 0.13 | 0.13 | < 0.001 | 0.08 | 6 | 2.7 - 13.4 | < 0.001 |
Univariate Linear and Logistic Regression Models Considering IMT as a Dependent Variable in All Patients and NAFLD and Normal Groups Separately
Considering statistically significant univariate linear and logistic regression models [age, HLP, HTN, diabetes and NAFLD in linear regression and age, BMI, HLP, HTN, diabetes and NAFLD in logistic regression], we calculated multivariate regression model considering IMT as a dependent variable. Results showed an adjusted R square of 0.41 for the linear regression model and R square of 0.24 in logistic regression model. Age, NAFLD, and HLP were significant independent variables in the linear model and age, NAFLD, BMI and HLP were significant independent variables in the logistic model (Table 3).
| Linear regression | Logistic regression | ||||||
|---|---|---|---|---|---|---|---|
| Variable | Unstandardized coefficients (B) | Standard error | Standardized coefficients (beta) | P value | Odds ratio | %95 CI | P value |
| NAFLD | 0.14 | 0.02 | 0.41 | < 0.001 | 16.4 | 5.9 - 45 | < 0.001 |
| Age | 0.01 | 0.001 | 0.43 | < 0.001 | 1.08 | 1.05 - 1.12 | < 0.001 |
| BMI | - | - | - | - | 0.86 | 0.78 - 0.95 | 0.003 |
| HLP | 0.07 | 0.02 | 0.18 | < 0.001 | 2.74 | 1.1 - 6.9 | 0.03 |
| HTN | 0.01 | 0.02 | 0.03 | 0.001 | 1.2 | 0.47 - 2.9 | 0.74 |
| Diabetes | 0.01 | 0.02 | 0.02 | 0.50 | 1.2 | 0.45 - 3.1 | 0.74 |
| Constant | 0.21 | 0.03 | - | 0.74 | 0.013 | - | 0.015 |
Multivariate Linear and Logistic Regression Models Between Significant Univariate Regressors of IMT as a Dependent Variable
5. Discussion
NAFLD is a feature of liver esteatosis with or without inflammation or fibrosis (46). It is the most common liver disorder in western countries (47). Moreover, the high prevalence of atherosclerosis in such patients encouraged us to assess the sonographic value of c-IMT in those patients with NAFLD (48). In other words, it is unknown whether NAFLD can predict an increased risk for cardiovascular atherosclerotic disorders especially in initial phases (49). We first detected no association between BMI and c-IMT that was similar to the findings of Tarantino et al. (50), Chen et al. (31), and Sert et al. (51) studies. Nevertheless, the result of the study conducted by Jarvisalo et al. (52) Manco et al. (53) and Berenson et al. (54) was contrary to our observation because of their focus on children. This contradictory result might be due to the definition of metabolic syndrome in adulthood. Another result in our survey was not observing an association between c-IMT and gender.
We also revealed a direct association between age and c-IMT that was similar to studies carried out by Jarvisalo et al. (52), Berenson et al. (54). We also found an association between the change in lipid profiles and the value of c-IMT that was contrary to other studies (52, 53).
As other findings, hypertensive patients were found to have a higher value of c-IMT than normotensive ones. Regarding the association between the presence of diabetes and increased measure of c-IMT, this association was only found in the control group not in the case group similar to some previous studies (34, 43). This contradictory result can be due to the abnormal distribution of cases in the NAFLD group.
As the most important result, we showed an association between the presence of NAFLD and increase value of c-IMT that was similar to other studies (36, 55-62).
In addition, in this context, Akin et al. (62) could not also find difference in diabetic status between those with and without NAFLD (Figures 2 - 4).
. B, A 38-year-old female with fatty liver grade 1 (mild) The echogenicity is slightly increased with normal visualization of the diaphragm and the intrahepatic vessel borders. C, A 47-year-old female, 70 kg with mild hypertension and slightly abnormal liver function tests (LFT). Fatty liver grade 2 (moderate). The echogenicity is moderately increased, with slightly impaired visualization of the diaphragm or intrahepatic vessels. D, A 45-year-old male, 110 kg with no underlying disease but slightly abnormal LFT. Fatty liver grade 3 (severe). The echogenicity is markedly increased with poor visualization of the diaphragm, the intrahepatic vessels, and the posterior portion of the right lobe.")
Grades of fatty liver. A, A 24-year-old male with a fatty liver grade 0 (normal liver parenchyma and echogenicity). B, A 38-year-old female with fatty liver grade 1 (mild) The echogenicity is slightly increased with normal visualization of the diaphragm and the intrahepatic vessel borders. C, A 47-year-old female, 70 kg with mild hypertension and slightly abnormal liver function tests (LFT). Fatty liver grade 2 (moderate). The echogenicity is moderately increased, with slightly impaired visualization of the diaphragm or intrahepatic vessels. D, A 45-year-old male, 110 kg with no underlying disease but slightly abnormal LFT. Fatty liver grade 3 (severe). The echogenicity is markedly increased with poor visualization of the diaphragm, the intrahepatic vessels, and the posterior portion of the right lobe.
At last, the relation between smoking and increased c-IMT was observed only in the control group, not in the NAFLD group. In fact, c-IMT value was not overall associated with smoking that was similarly found in a study conducted by Chavez-Tapia et al. (63) but contrary to a study performed by Chen et al. (31). It seems that the effect of smoking on c-IMT may be mimicked by powerful predicting effects of other risk factors such as the presence of NAFLD.
More interestingly, the power of NAFLD to predict increased c-IMT was the highest when compared to other two factors including age and lipid levels. However, we found no association between the value of IMT and grading of NAFLD similar to the study conducted by Tarantino et al. (50). In Framingham study published in 2015, a microvascular defect in carotid was the main manifestation in NAFLD patients. Insignificant association observed in our study might be due to the fact that most patients in our survey had a low grade of disease as well as the abnormal distribution of patients in our study.
In conclusion, in patients with NAFLD, advanced age and increased level of lipids along with hypertensive and diabetic states could predict increased c-IMT and thus could be helpful for predicting cardiovascular diseases. However, it can be noted that NAFLD may not be an independent factor for predicting cardiovascular prognosis. In final, further studies with the aim of assessing NAFLD as a predictive factor for cardiovascular disease prognosis are recommended.
